Michael's FVG Detector═══════════════════════════════════════
Michael's FVG Detector
═══════════════════════════════════════
A clean and efficient Fair Value Gap (FVG) indicator for TradingView that helps traders identify market imbalances with precision.
───────────────────────────────────────
Overview
───────────────────────────────────────
Fair Value Gaps (FVGs) are price inefficiencies that occur when there's a gap between the wicks of candlesticks, indicating rapid price movement with minimal trading activity. These gaps often act as support/resistance zones where price may return to "fill the gap."
This indicator automatically detects and visualizes both bullish and bearish FVGs on any timeframe, making it easy to spot potential trading opportunities.
───────────────────────────────────────
Features
───────────────────────────────────────
Core Functionality
Automatic FVG Detection : Identifies Fair Value Gaps in real-time as they form
Bullish & Bearish FVGs : Detects both upward and downward price gaps
3-Candle Pattern : Uses classic FVG logic (current candle low > high from 2 bars ago for bullish, vice versa for bearish)
Gap Size Display : Shows the exact size of each FVG in ticks directly on the box
Confirmed Bars Only : Only draws FVGs on confirmed bars to prevent repainting
Customization
Color Settings : Fully customizable colors for bullish and bearish FVGs with transparency control
Text Color : Configurable color for the tick size labels
Default Styling : Comes with sensible defaults (20% transparency, dark gray labels)
Performance Optimization
Smart Cleanup : Automatically removes boxes outside the visible chart area
Efficient Rendering : Maintains optimal performance even on lower timeframes
No Repainting : Uses confirmed bars only for reliable signals
───────────────────────────────────────
How It Works
───────────────────────────────────────
Detection Logic
Bullish FVG:
Current bar's low is higher than the high from 2 bars ago
Creates an upward gap that price left behind during bullish momentum
Bearish FVG:
Current bar's high is lower than the low from 2 bars ago
Creates a downward gap that price left behind during bearish momentum
Visual Display
Each detected FVG is displayed as:
A semi-transparent colored box spanning the gap area
The box extends from bar -2 to the current bar
Gap size in ticks shown at the bottom-left of each box
Singular/plural formatting ("1 tick" vs "X ticks")
───────────────────────────────────────
Performance Notes
───────────────────────────────────────
Cleanup runs every 50 bars to maintain optimal performance
Only creates boxes on confirmed bars (no real-time repainting)
Efficiently manages memory by removing off-screen boxes
Suitable for both manual and automated trading strategies
───────────────────────────────────────
Disclaimer
───────────────────────────────────────
This indicator is for educational and informational purposes only. It is not financial advice. Always do your own research and risk management before making trading decisions.
───────────────────────────────────────
Author : Michael
Version : 1.0
License : Free for personal use
Last Updated : November 2025
Pontos e níveis de pivô

MTF-CPR TableTable gives you CPR values based on Camarilla calculation with S&R 3 & 4 Levels...
Highlights the cell green when Price is in range and marks the Pivot Red when we have a Narrow CPR range...
Enjoy!!

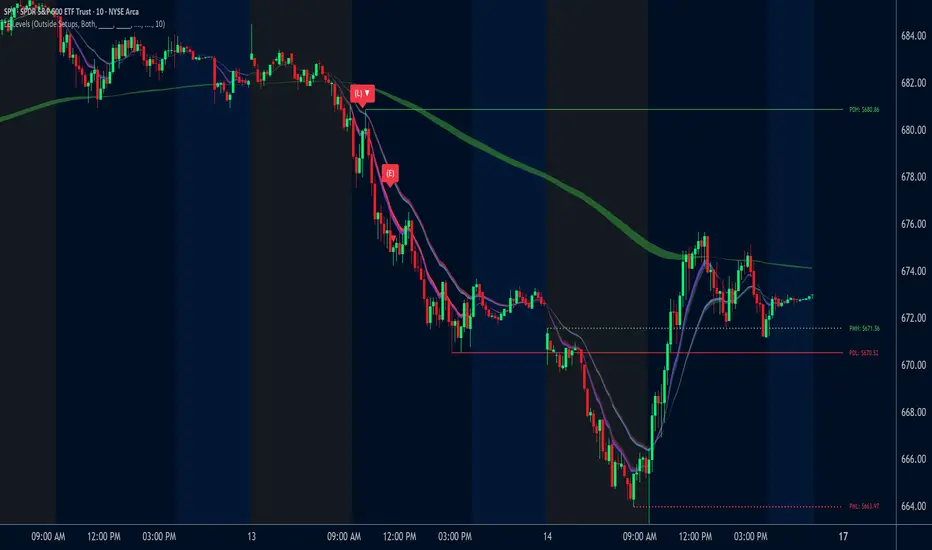
LE LevelsGENERAL OVERVIEW:
The LE Levels indicator plots yesterday’s high/low and today’s pre-market high/low directly on your chart, then layers signal logic around those levels and a set of EMA waves. You can choose “Inside” setups, “Outside” setups, or both. You can also pick entries that trigger at levels, entries that trigger off the EMA wave, or both.
This indicator was developed by Flux Charts in collaboration with Ellis Dillinger (Ellydtrades).
What is the purpose of the indicator?:
The purpose of the LE Levels indicator is to give traders a clear view of how price is behaving around key session levels and EMA structure. It follows the same model EllyD teaches by showing where price is relative to the Previous Day High and Low and the Pre-Market High and Low, then printing signals when specific reactions occur around those levels.
What is the theory behind the indicator?:
The theory behind the LE Levels indicator is based on the concept of inside and outside days. An inside day occurs when price trades within the previous day’s high and low, signaling compression and potential breakout conditions. An outside day occurs when price moves beyond those boundaries, confirming expansion and directional bias. When price trades above the PDH or PMH, it reflects bullish control and potential continuation if supported by volume and momentum. When price trades below the PDL or PML, it shows bearish control and possible downside continuation. The idea is to combine this logic with tickers that have catalysts or news, since these events often bring higher-than-normal volume.
LE SCANNER FEATURES:
Key Levels
Signals
EMA Waves
Key Levels:
The LE Levels indicator automatically plots four key levels each day:
Previous Day High (PDH)
Previous Day Low (PDL)
Pre-Market High (PMH)
Pre-Market Low (PML)
🔹How are Key Levels used in the indicator?:
The key levels are a crucial factor in determining if the trend is bullish, bearish, or neutral trend bias. The indicator uses the key levels as a condition for identifying inside or outside setups (explained below). After determining a trend bias and setup type, the indicator prints long and short entry signals based on how price interacts with the key levels and 8 EMA Wave. (explained below).
These levels define where price previously reacted or reversed, helping traders visualize how current price action relates to prior session structure. They update automatically each day and pre-market session, allowing traders to see if price is trading inside, above, or below prior key ranges without manually drawing them.
Please Note: Pre-market times are based on U.S. market hours (Eastern Standard Time) and may vary for non-U.S. tickers or exchanges.
🔹Previous Day High (PDH):
The PDH marks the highest price reached during the previous regular trading session. It shows where buyers pushed price to its highest point before the market closed. This value is automatically pulled from the daily chart and projected forward onto intraday timeframes.
🔹Previous Day Low (PDL):
The PDL marks the lowest price reached during the previous regular trading session. It shows where selling pressure reached its lowest point before buyers stepped in. Like the PDH, this level is retrieved from the prior day’s data and extended into the current session.
🔹Pre-Market High (PMH):
The PMH is the highest price reached between 4:00 AM and 9:29 AM EST, before the regular market open. It shows how far buyers managed to push price up during the pre-market session.
🔹Pre-Market Low (PML):
The PML is the lowest price reached between 4:00 AM and 9:29 AM EST, before the regular market open. It shows how far sellers were able to drive price down during the pre-market session.
🔹Customization Options:
Extend Levels:
Extends each plotted line a user-defined number of bars into the future, keeping them visible even as new candles print. This helps maintain a clear visual reference as the session progresses.
Extend PDH/L Left & Extend PMH/L Left:
These settings let you extend the Previous Day and Pre-Market levels back to their origin point, so you can see exactly where each level was formed on the prior trading day. This makes it easy to understand the context of each level and how it developed. When this option is disabled, the lines begin at the regular session open instead of extending backward into the previous day’s data.
Show Name / Show Price:
Enabling Show Name displays labels (PDH, PDL, PMH, PML) beside each line, while Show Price adds the exact price value. You can choose to show just the name, just the price, or both for a complete label format.
Line Color and Style:
Each level can be fully customized. You can change the line color and select between solid, dashed, or dotted styles to visually distinguish each level type.
At the bottom of the indicator settings, under the ‘Miscellaneous’ section, two additional options allow further control over how levels are displayed:
Hide Previous Day Highs/Lows:
When enabled, the previous day’s high and low levels aren’t shown. When disabled, users can view previous day levels without using replay mode. By default, this setting is enabled.
Disabled:
Enabled:
Hide Previous Pre-Market Highs/Lows:
When enabled, the previous pre-market high and low levels aren’t shown. When disabled, users can view previous pre-market levels without using replay mode. By default, this setting is enabled.
Disabled:
Enabled:
Signals:
The LE Levels indicator automatically prints long and short entry signals based on how price interacts with its key levels (PDH, PDL, PMH, PML) and the EMA Waves. It identifies moments when price either breaks out beyond prior ranges or retests those levels in alignment with momentum shown by the EMA Waves.
There are two types of setups (Inside and Outside) and two entry types ((L)evels and (E)MAs). Together, these settings allow traders to customize the type of structure the indicator recognizes and how signals are generated.
🔹What is an Inside Setup?
An Inside Setup occurs when the current trading session forms entirely within the previous day’s range, meaning price has not yet broken above the Previous Day High (PDH) or below the Previous Day Low (PDL). In the LE Levels indicator, inside setups are recognized when price trades within the previous day’s boundaries while also considering the pre-market range (Pre-Market High and Pre-Market Low).
Inside Setups have two main conditions, depending on directional bias:
Bullish Inside Setup:
Price trades above the Pre-Market High (PMH) and above the Previous Day Low (PDL), while still below the Previous Day High (PDH).
Bearish Inside Setup:
Price trades below the Pre-Market Low (PML) and below the Previous Day High (PDH), while still above the Previous Day Low (PDL).
🔹What is an Outside Setup?
An Outside Setup occurs when the current trading session extends beyond the previous day’s range, meaning price has broken above the Previous Day High (PDH) or below the Previous Day Low (PDL). This structure reflects expansion and directional control, showing that either buyers or sellers have taken price into new territory beyond the prior session’s boundaries.
In the indicator, an Outside Setup forms once price closes beyond both the previous day and pre-market boundaries, showing bias in one direction.
Bullish Outside Setup:
Price closes above both the PDH and the PMH, confirming buyers have pushed through every key resistance from the prior session and the pre-market.
Bearish Outside Setup:
Price closes below both the PDL and the PML, showing sellers have pushed price beneath all key support levels from the previous session and the pre-market.
🔹Entry Types: (L)evels and (E)MAs
Once a setup type (Inside or Outside) has been established, the LE Levels indicator generates trade signals using one of two entry confirmation methods: (L) for Key Level based Entries and (E) for EMA Wave based Entries. These determine how the signal prints and what triggers it within.
🔹(L)evels Entry:
The (L)evels entry type is built around how price reacts to the key levels (PDH, PDL, PMH, PML). It prints when price retests those levels during an active setup. The logic focuses on retests, where price returns to confirm a previous breakout or breakdown before continuing in the same direction.
Bullish Outside (L)evels Setup:
A Bullish Outside Setup forms when price breaks above both the PDH and PMH. Once this breakout occurs, the indicator waits for a pullback to one of those levels. For a signal to print, the 8 EMA Wave must also be near that level, showing momentum is supporting the structure. A small buffer is applied between price and the level so that even if price only comes close, without fully touching, the retest still counts. When price holds above the PDH or PMH with the 8 EMA nearby, the indicator prints an (L) ▲ entry.
Bearish Outside (L)evels Setup:
A Bearish Outside Setup forms when price breaks below both the PDL and PML. Once this breakdown occurs, the indicator waits for a pullback to one of those levels. For a signal to print, the 8 EMA Wave must also be near that area, confirming momentum is aligned with the move. A small buffer is included so that even if price comes close but doesn’t fully touch the level, the retest still qualifies. When price holds below the PDL or PML with the 8 EMA nearby, the indicator prints an (L) ▼ entry.
Bullish Inside (L)evels Setup:
A Bullish Inside Setup forms when price trades above the PMH but stays below the PDH and above the PDL. Once this condition is met, the indicator waits for a pullback to the PMH. For a signal to print, the 8 EMA Wave must also be near that level. A small buffer is applied so that even if price only comes close to the level, the retest still counts. When price holds above the PMH with the 8 EMA nearby, the indicator prints an (L) ▲ entry.
Bearish Inside (L)evels Setup:
A Bearish Inside Setup forms when price trades below the PML but stays above the PDL and below the PDH. Once this condition is met, the indicator waits for a pullback to the PML. For a signal to print, the 8 EMA Wave must also be near that level. A small buffer is applied so that even if price only comes close, the retest still counts. When price holds below the PML with the 8 EMA nearby, the indicator prints an (L) ▼ entry.
🔹(E)MAs Entry:
The (E)MA Entry type focuses on how price reacts to the 8 EMA Wave. It identifies when price first interacts with the EMAs, then confirms continuation once momentum resumes in the setup’s direction. The first candle that touches the EMA prints an (E) marker, and the confirmation signal triggers only after price breaks above or below that candle, depending on the bias.
Bullish Outside (E)MA Setup:
A Bullish Outside Setup forms when price is trading above both the PDH and PMH. Once this breakout occurs, the indicator waits for price to pull back and touch the 8 EMA Wave, which prints the initial (E) label. If price then breaks above that candle’s high, the continuation setup is confirmed.
Bearish Outside (E)MA Setup:
A Bearish Outside Setup forms when price is trading below both the PDL and PML. After the breakdown, the indicator waits for price to pull back to the 8 EMA Wave, marking the candle that touches it with an (E) label. If price then breaks below that candle’s low, the continuation setup is confirmed.
Bullish Inside (E)MA Setup:
A Bullish Inside Setup forms when price trades above the PMH but remains below the PDH and above the PDL. The indicator waits for price to retrace and touch the 8 EMA Wave, which prints the initial (E) label. If price then breaks above that candle’s high, the continuation setup is confirmed.
Bearish Inside (E)MA Setup:
A Bearish Inside Setup forms when price trades below the PML but remains above the PDL and below the PDH. Once price touches the 8 EMA Wave, the indicator prints an (E) marker. If price then breaks below that candle’s low, the continuation setup is confirmed.
🔹Signal Settings:
At the bottom of the indicator settings panel, three core controls define how signals are displayed and which setups the indicator actively scans for. These settings allow you to refine signal generation based on your trading approach and chart preference.
Setup Type:
This setting determines which structural conditions the indicator tracks.
Inside Setups: Signals only appear when price is trading within the previous day’s range (between PDH and PDL).
Outside Setups: Signals only appear when price breaks outside the previous day’s range (above PDH/PMH or below PDL/PML).
Both: Enables signals for both Inside and Outside setups.
Entry Type:
Controls how the indicator confirms entries.
(E)MAs: Prints signals based on price interacting with the 8 EMA Wave.
(L)evels: Prints signals based on price retesting key levels such as PDH, PDL, PMH, or PML.
Both: Allows both EMA and Level-based signals to appear on the same chart.
Signal Filters (Long, Short, and Re-Entry):
These toggles let you control which trade directions are active.
Long: Displays only bullish entries and ignores all short setups.
Short: Displays only bearish entries and ignores long setups.
Re-Entry: Enables or disables repeated signals in the same direction after the first valid setup has printed. When off, only the initial signal is shown until conditions reset.
EMA Waves:
The EMA Waves help identify potential entries and show directional bias. They’re made of grouped EMAs that form shaded areas to create a “wave” look. The color-coding on the waves allows users to view when price is consolidating, in a bullish trend, or in a bearish trend. The wave updates in real time as new candles form and does not repaint historical data.
🔹8 EMA Wave
The 8 EMA Wave is used directly in the indicator’s signal logic described earlier. It reacts fastest to price compared to the other EAM Waves and determines when (L) and (E) signals can trigger.
How It Works:
The wave is made from the 8, 9, and 10 EMAs and fills the space between them to create a “wave” look. The 8 EMA Wave continuously updates its color based on where price trades relative to the key levels (PDH, PDL, PMH, PML). The color changes are conditional and based solely on price position relative to key levels.
Price is above both PDH and PMH: The wave is bright green, and the top half is purple.
Price is between PDH and PMH: The wave is dark green, and the top half is purple.
Price is below both PDL and PML: The wave is bright red, and the bottom half is purple.
Price is between PDL and PML: The wave is dark red, and the bottom half is purple.
Price is between all four levels: The wave is gray to represent consolidation or neutral bias.
🔹8 EMA Wave Signal Function:
For (L)evels entries, the 8 EMA must be close to the key level being retested, with a small buffer that allows near touches to qualify.
For (E)MA entries, the first candle that touches the wave prints an (E), and the confirmation signal appears when price breaks that candle’s high or low.
🔹8 EMA Wave Customization:
Users can customize all colors for bullish, bearish, and neutral conditions directly in the settings. The purple overlay color cannot be changed, as it is hard-coded into the indicator. The 8 EMA Wave can also be toggled on or off. Turning it off only removes the visual display from the chart and does not affect signals.
🔹20 EMA Wave
The 20 EMA Wave measures medium-term momentum and helps visualize larger pullbacks. It reacts more slowly than the 8 EMA Wave, giving a smoother wave look. No signals are generated from it. It’s purely a visual guide for spotting potential pullback areas for continuation setups.
How It Works:
The wave is made from the 19, 20, and 21 EMAs and fills the space between them to create a shaded “wave.” The color updates continuously based on where price trades relative to the key levels (PDH, PDL, PMH, PML). The color changes are conditional and based only on price position relative to these levels.
Price is above both PDH and PMH: The wave is bright green, and the top half is blue.
Price is between PDH and PMH: The wave is dark green, and the top half is blue.
Price is below both PDL and PML: The wave is bright red, and the bottom half is blue.
Price is between PDL and PML: The wave is dark red, and the bottom half is blue.
Price is between all four levels: The wave is gray to represent consolidation or neutral bias.
🔹20 EMA Wave Use Case:
After 12:00 PM EST, the 20 EMA Wave is used to spot larger pullbacks that form later in the session. No signals are generated from it; it only serves as a visual guide for identifying potential continuation areas.
Bullish Continuation Pullback:
Bearish Continuation Pullback:
🔹20 EMA Wave Customization:
Users can customize all colors for bullish, bearish, and neutral conditions directly in the settings. The blue overlay color cannot be changed, as it is hard-coded into the indicator. The 20 EMA Wave can also be toggled on or off.
🔹200 EMA Wave
The 200 EMA Wave is used to determine long-term trend bias. When price is above it, the bias is bullish; when price is below it, the bias is bearish. It updates automatically in real time and is used to define the broader directional bias for the day.
How it Works:
The 200 EMA Wave is created using the 190, 199, and 200 EMAs, with the area between them shaded to form a “wave.”
🔹200 EMA Wave Use Case:
When price is above the 200 EMA Wave and both the 8 and 20 EMA Waves are stacked above it, the overall trend is bullish.
When price is below the 200 EMA Wave and both shorter-term waves are also below it, the overall trend is bearish.
🔹200 EMA Wave Customization:
Users can customize both colors that form the 200 EMA Wave. The entire wave can also be toggled on or off in the settings.
Uniqueness:
The LE Levels indicator is unique because it combines signal logic with a clear visual structure. It automatically detects inside and outside setups, printing (L) and (E) entries based on how price reacts to key levels and the EMA Waves. Each signal follows strict conditions tied to the 8 EMA and key levels. The color-coded EMA Waves make it simple to understand where price is in relation to the key levels and getting a quick trend bias overview.
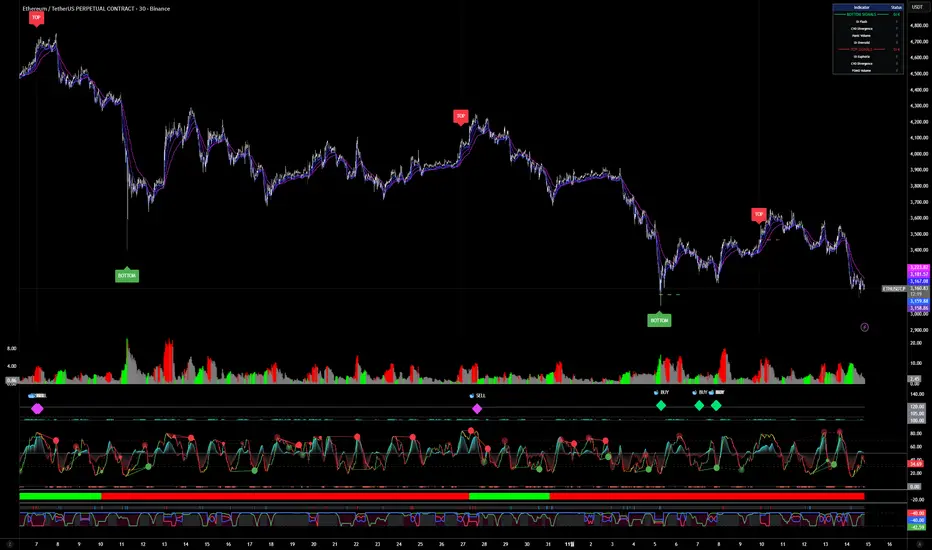
Reversal Point Dynamics - Machine Learning⇋ Reversal Point Dynamics - Machine Learning
RPD Machine Learning: Self-Adaptive Multi-Armed Bandit Trading System
RPD Machine Learning is an advanced algorithmic trading system that implements genuine machine learning through contextual multi-armed bandits, reinforcement learning, and online adaptation. Unlike traditional indicators that use fixed rules, RPD learns from every trade outcome , automatically discovers which strategies work in current market conditions, and continuously adapts without manual intervention .
Core Innovation: The system deploys six distinct trading policies (ranging from aggressive trend-following to conservative range-bound strategies) and uses LinUCB contextual bandit algorithms with Random Fourier Features to learn which policy performs best in each market regime. After the initial learning phase (50-100 trades), the system achieves autonomous adaptation , automatically shifting between policies as market conditions evolve.
Target Users: Quantitative traders, algorithmic trading developers, systematic traders, and data-driven investors who want a system that adapts over time . Suitable for stocks, futures, forex, and cryptocurrency on any liquid instrument with >100k daily volume.
The Problem This System Solves
Traditional Technical Analysis Limitations
Most trading systems suffer from three fundamental challenges :
Fixed Parameters: Static settings (like "buy when RSI < 30") work well in backtests but may struggle when markets change character. What worked in low-volatility environments may not work in high-volatility regimes.
Strategy Degradation: Manual optimization (curve-fitting) produces systems that perform well on historical data but may underperform in live trading. The system never adapts to new market conditions.
Cognitive Overload: Running multiple strategies simultaneously forces traders to manually decide which one to trust. This leads to hesitation, late entries, and inconsistent execution.
How RPD Machine Learning Addresses These Challenges
Automated Strategy Selection: Instead of requiring you to choose between trend-following and mean-reversion strategies, RPD runs all six policies simultaneously and uses machine learning to automatically select the best one for current conditions. The decision happens algorithmically, removing human hesitation.
Continuous Learning: After every trade, the system updates its understanding of which policies are working. If the market shifts from trending to ranging, RPD automatically detects this through changing performance patterns and adjusts selection accordingly.
Context-Aware Decisions: Unlike simple voting systems that treat all conditions equally, RPD analyzes market context (ADX regime, entropy levels, volatility state, volume patterns, time of day, historical performance) and learns which combinations of context features correlate with policy success.
Machine Learning Architecture: What Makes This "Real" ML
Component 1: Contextual Multi-Armed Bandits (LinUCB)
What Is a Multi-Armed Bandit Problem?
Imagine facing six slot machines, each with unknown payout rates. The exploration-exploitation dilemma asks: Should you keep pulling the machine that's worked well (exploitation) or try others that might be better (exploration)? RPD solves this for trading policies.
Academic Foundation:
RPD implements Linear Upper Confidence Bound (LinUCB) from the research paper "A Contextual-Bandit Approach to Personalized News Article Recommendation" (Li et al., 2010, WWW Conference). This algorithm is used in content recommendation and ad placement systems.
How It Works:
Each policy (AggressiveTrend, ConservativeRange, VolatilityBreakout, etc.) is treated as an "arm." The system maintains:
Reward History: Tracks wins/losses for each policy
Contextual Features: Current market state (8-10 features including ADX, entropy, volatility, volume)
Uncertainty Estimates: Confidence in each policy's performance
UCB Formula: predicted_reward + α × uncertainty
The system selects the policy with highest UCB score , balancing proven performance (predicted_reward) with potential for discovery (uncertainty bonus). Initially, all policies have high uncertainty, so the system explores broadly. After 50-100 trades, uncertainty decreases, and the system focuses on known-performing policies.
Why This Matters:
Traditional systems pick strategies based on historical backtests or user preference. RPD learns from actual outcomes in your specific market, on your timeframe, with your execution characteristics.
Component 2: Random Fourier Features (RFF)
The Non-Linearity Challenge:
Market relationships are often non-linear. High ADX may indicate favorable conditions when volatility is normal, but unfavorable when volatility spikes. Simple linear models struggle to capture these interactions.
Academic Foundation:
RPD implements Random Fourier Features from "Random Features for Large-Scale Kernel Machines" (Rahimi & Recht, 2007, NIPS). This technique approximates kernel methods (like Support Vector Machines) while maintaining computational efficiency for real-time trading.
How It Works:
The system transforms base features (ADX, entropy, volatility, etc.) into a higher-dimensional space using random projections and cosine transformations:
Input: 8 base features
Projection: Through random Gaussian weights
Transformation: cos(W×features + b)
Output: 16 RFF dimensions
This allows the bandit to learn non-linear relationships between market context and policy success. For example: "AggressiveTrend performs well when ADX >25 AND entropy <0.6 AND hour >9" becomes naturally encoded in the RFF space.
Why This Matters:
Without RFF, the system could only learn "this policy has X% historical performance." With RFF, it learns "this policy performs differently in these specific contexts" - enabling more nuanced selection.
Component 3: Reinforcement Learning Stack
Beyond bandits, RPD implements a complete RL framework :
Q-Learning: Value-based RL that learns state-action values. Maps 54 discrete market states (trend×volatility×RSI×volume combinations) to 5 actions (4 policies + no-trade). Updates via Bellman equation after each trade. Converges toward optimal policy after 100-200 trades.
TD(λ) with Eligibility Traces: Extension of Q-Learning that propagates credit backwards through time . When a trade produces an outcome, TD(λ) updates not just the final state-action but all states visited during the trade, weighted by eligibility decay (λ=0.90). This accelerates learning from multi-bar trades.
Policy Gradient (REINFORCE): Learns a stochastic policy directly from 12 continuous market features without discretization. Uses gradient ascent to increase probability of actions that led to positive outcomes. Includes baseline (average reward) for variance reduction.
Meta-Learning: The system learns how to learn by adapting its own learning rates based on feature stability and correlation with outcomes. If a feature (like volume ratio) consistently correlates with success, its learning rate increases. If unstable, rate decreases.
Why This Matters:
Q-Learning provides fast discrete decisions. Policy Gradient handles continuous features. TD(λ) accelerates learning. Meta-learning optimizes the optimization. Together, they create a robust, multi-approach learning system that adapts more quickly than any single algorithm.
Component 4: Policy Momentum Tracking (v2 Feature)
The Recency Challenge:
Standard bandits treat all historical data equally. If a policy performed well historically but struggles in current conditions due to regime shift, the system may be slow to adapt because historical success outweighs recent underperformance.
RPD's Solution:
Each policy maintains a ring buffer of the last 10 outcomes. The system calculates:
Momentum: recent_win_rate - global_win_rate (range: -1 to +1)
Confidence: consistency of recent results (1 - variance)
Policies with positive momentum (recent outperformance) get an exploration bonus. Policies with negative momentum and high confidence (consistent recent underperformance) receive a selection penalty.
Effect: When markets shift, the system detects the shift more quickly through momentum tracking, enabling faster adaptation than standard bandits.
Signal Generation: The Core Algorithm
Multi-Timeframe Fractal Detection
RPD identifies reversal points using three complementary methods :
1. Quantum State Analysis:
Divides price range into discrete states (default: 6 levels)
Peak signals require price in top states (≥ state 5)
Valley signals require price in bottom states (≤ state 1)
Prevents mid-range signals that may struggle in strong trends
2. Fractal Geometry:
Identifies swing highs/lows using configurable fractal strength
Confirms local extremum with neighboring bars
Validates reversal only if price crosses prior extreme
3. Multi-Timeframe Confirmation:
Analyzes higher timeframe (4× default) for alignment
MTF confirmation adds probability bonus
Designed to reduce false signals while preserving valid setups
Probability Scoring System
Each signal receives a dynamic probability score (40-99%) based on:
Base Components:
Trend Strength: EMA(velocity) / ATR × 30 points
Entropy Quality: (1 - entropy) × 10 points
Starting baseline: 40 points
Enhancement Bonuses:
Divergence Detection: +20 points (price/momentum divergence)
RSI Extremes: +8 points (RSI >65 for peaks, <40 for valleys)
Volume Confirmation: +5 points (volume >1.2× average)
Adaptive Momentum: +10 points (strong directional velocity)
MTF Alignment: +12 points (higher timeframe confirms)
Range Factor: (high-low)/ATR × 3 - 1.5 points (volatility adjustment)
Regime Bonus: +8 points (trending ADX >25 with directional agreement)
Penalties:
High Entropy: -5 points (entropy >0.85, chaotic price action)
Consolidation Regime: -10 points (ADX <20, no directional conviction)
Final Score: Clamped to 40-99% range, classified as ELITE (>85%), STRONG (75-85%), GOOD (65-75%), or FAIR (<65%)
Entropy-Based Quality Filter
What Is Entropy?
Entropy measures randomness in price changes . Low entropy indicates orderly, directional moves. High entropy indicates chaotic, unpredictable conditions.
Calculation:
Count up/down price changes over adaptive period
Calculate probability: p = ups / total_changes
Shannon entropy: -p×log(p) - (1-p)×log(1-p)
Normalized to 0-1 range
Application:
Entropy <0.5: Highly ordered (ELITE signals possible)
Entropy 0.5-0.75: Mixed (GOOD signals)
Entropy >0.85: Chaotic (signals blocked or heavily penalized)
Why This Matters:
Prevents trading during choppy, news-driven conditions where technical patterns may be less reliable. Automatically raises quality bar when market is unpredictable.
Regime Detection & Market Microstructure - ADX-Based Regime Classification
RPD uses Wilder's Average Directional Index to classify markets:
Bull Trend: ADX >25, +DI > -DI (directional conviction bullish)
Bear Trend: ADX >25, +DI < -DI (directional conviction bearish)
Consolidation: ADX <20 (no directional conviction)
Transitional: ADX 20-25 (forming direction, ambiguous)
Filter Logic:
Blocks all signals during Transitional regime (avoids trading during uncertain conditions)
Blocks Consolidation signals unless ADX ≥ Min Trend Strength
Adds probability bonus during strong trends (ADX >30)
Effect: Designed to reduce signal frequency while focusing on higher-quality setups.
Divergence Detection
Bearish Divergence:
Price makes higher high
Velocity (price momentum) makes lower high
Indicates weakening upward pressure → SHORT signal quality boost
Bullish Divergence:
Price makes lower low
Velocity makes higher low
Indicates weakening downward pressure → LONG signal quality boost
Bonus: Adds probability points and additional acceleration factor. Divergence signals have historically shown higher success rates in testing.
Hierarchical Policy System - The Six Trading Policies
1. AggressiveTrend (Policy 0):
Probability Threshold: 60% (trades more frequently)
Entropy Threshold: 0.70 (tolerates moderate chaos)
Stop Multiplier: 2.5× ATR (wider stops for trends)
Target Multiplier: 5.0R (larger targets)
Entry Mode: Pyramid (scales into winners)
Best For: Strong trending markets, breakouts, momentum continuation
2. ConservativeRange (Policy 1):
Probability Threshold: 75% (more selective)
Entropy Threshold: 0.60 (requires order)
Stop Multiplier: 1.8× ATR (tighter stops)
Target Multiplier: 3.0R (modest targets)
Entry Mode: Single (one-shot entries)
Best For: Range-bound markets, low volatility, mean reversion
3. VolatilityBreakout (Policy 2):
Probability Threshold: 65% (moderate)
Entropy Threshold: 0.80 (accepts high entropy)
Stop Multiplier: 3.0× ATR (wider stops)
Target Multiplier: 6.0R (larger targets)
Entry Mode: Tiered (splits entry)
Best For: Compression breakouts, post-consolidation moves, gap opens
4. EntropyScalp (Policy 3):
Probability Threshold: 80% (very selective)
Entropy Threshold: 0.40 (requires extreme order)
Stop Multiplier: 1.5× ATR (tightest stops)
Target Multiplier: 2.5R (quick targets)
Entry Mode: Single
Best For: Low-volatility grinding moves, tight ranges, highly predictable patterns
5. DivergenceHunter (Policy 4):
Probability Threshold: 70% (quality-focused)
Entropy Threshold: 0.65 (balanced)
Stop Multiplier: 2.2× ATR (moderate stops)
Target Multiplier: 4.5R (balanced targets)
Entry Mode: Tiered
Best For: Divergence-confirmed reversals, exhaustion moves, trend climax
6. AdaptiveBlend (Policy 5):
Probability Threshold: 68% (balanced)
Entropy Threshold: 0.75 (balanced)
Stop Multiplier: 2.0× ATR (standard)
Target Multiplier: 4.0R (standard)
Entry Mode: Single
Best For: Mixed conditions, general trading, fallback when no clear regime
Policy Clustering (Advanced/Extreme Modes)
Policies are grouped into three clusters based on regime affinity:
Cluster 1 (Trending): AggressiveTrend, DivergenceHunter
High regime affinity (0.8): Performs well when ADX >25
Moderate vol affinity (0.6): Works in various volatility
Cluster 2 (Ranging): ConservativeRange, AdaptiveBlend
Low regime affinity (0.3): Better suited for ADX <20
Low vol affinity (0.4): Optimized for calm markets
Cluster 3 (Breakout): VolatilityBreakout
Moderate regime affinity (0.6): Works in multiple regimes
High vol affinity (0.9): Requires high volatility for optimal characteristics
Hierarchical Selection Process:
Calculate cluster scores based on current regime and volatility
Select best-matching cluster
Run UCB selection within chosen cluster
Apply momentum boost/penalty
This two-stage process reduces learning time - instead of choosing among 6 policies from scratch, system first narrows to 1-2 policies per cluster, then optimizes within cluster.
Risk Management & Position Sizing
Dynamic Kelly Criterion Sizing (Optional)
Traditional Fixed Sizing Challenge:
Using the same position size for all signal probabilities may be suboptimal. Higher-probability signals could justify larger positions, lower-probability signals smaller positions.
Kelly Formula:
f = (p × b - q) / b
Where:
p = win probability (from signal score)
q = loss probability (1 - p)
b = win/loss ratio (average_win / average_loss)
f = fraction of capital to risk
RPD Implementation:
Uses Fractional Kelly (1/4 Kelly default) for safety. Full Kelly is theoretically optimal but can recommend large position sizes. Fractional Kelly reduces volatility while maintaining adaptive sizing benefits.
Enhancements:
Probability Bonus: Normalize(prob, 65, 95) × 0.5 multiplier
Divergence Bonus: Additional sizing on divergence signals
Regime Bonus: Additional sizing during strong trends (ADX >30)
Momentum Adjustment: Hot policies receive sizing boost, cold policies receive reduction
Safety Rails:
Minimum: 1 contract (floor)
Maximum: User-defined cap (default 10 contracts)
Portfolio Heat: Max total risk across all positions (default 4% equity)
Multi-Mode Stop Loss System
ATR Mode (Default):
Stop = entry ± (ATR × base_mult × policy_mult)
Consistent risk sizing
Ignores market structure
Best for: Futures, forex, algorithmic trading
Structural Mode:
Finds swing low (long) or high (short) over last 20 bars
Identifies fractal pivots within lookback
Places stop below/above structure + buffer (0.1× ATR)
Best for: Stocks, instruments that respect structure
Hybrid Mode (Intelligent):
Attempts structural stop first
Falls back to ATR if:
Structural level is invalid (beyond entry)
Structural stop >2× ATR away (too wide)
Best for: Mixed instruments, adaptability
Dynamic Adjustments:
Breakeven: Move stop to entry + 1 tick after 1.0R profit
Trailing: Trail stop 0.8R behind price after 1.5R profit
Timeout: Force close after 30 bars (optional)
Tiered Entry System
Challenge: Equal sizing on all signals may not optimize capital allocation relative to signal quality.
Solution:
Tier 1 (40% of size): Enters immediately on all signals
Tier 2 (60% of size): Enters only if probability ≥ Tier 2 trigger (default 75%)
Example:
Calculated optimal size: 10 contracts
Signal probability: 72%
Tier 2 trigger: 75%
Result: Enter 4 contracts only (Tier 1)
Same signal at 80% probability
Result: Enter 10 contracts (4 Tier 1 + 6 Tier 2)
Effect: Automatically scales size to signal quality, optimizing capital allocation.
Performance Optimization & Learning Curve
Warmup Phase (First 50 Trades)
Purpose: Ensure all policies get tested before system focuses on preferred strategies.
Modifications During Warmup:
Probability thresholds reduced 20% (65% becomes 52%)
Entropy thresholds increased 20% (more permissive)
Exploration rate stays high (30%)
Confidence width (α) doubled (more exploration)
Why This Matters:
Without warmup, system might commit to early-performing policy without testing alternatives. Warmup forces thorough exploration before focusing on best-performing strategies.
Curriculum Learning
Phase 1 (Trades 1-50): Exploration
Warmup active
All policies tested
High exploration (30%)
Learning fundamental patterns
Phase 2 (Trades 50-100): Refinement
Warmup ended, thresholds normalize
Exploration decaying (30% → 15%)
Policy preferences emerging
Meta-learning optimizing
Phase 3 (Trades 100-200): Specialization
Exploration low (15% → 8%)
Clear policy preferences established
Momentum tracking fully active
System focusing on learned patterns
Phase 4 (Trades 200+): Maturity
Exploration minimal (8% → 5%)
Regime-policy relationships learned
Auto-adaptation to market shifts
Stable performance expected
Convergence Indicators
System is learning well when:
Policy switch rate decreasing over time (initially ~50%, should drop to <20%)
Exploration rate decaying smoothly (30% → 5%)
One or two policies emerge with >50% selection frequency
Performance metrics stabilizing over time
Consistent behavior in similar market conditions
System may need adjustment when:
Policy switch rate >40% after 100 trades (excessive exploration)
Exploration rate not decaying (parameter issue)
All policies showing similar selection (not differentiating)
Performance declining despite relaxed thresholds (underlying signal issue)
Highly erratic behavior after learning phase
Advanced Features
Attention Mechanism (Extreme Mode)
Challenge: Not all features are equally important. Trading hour might matter more than price-volume correlation, but standard approaches treat them equally.
Solution:
Each RFF dimension has an importance weight . After each trade:
Calculate correlation: sign(feature - 0.5) × sign(reward)
Update importance: importance += correlation × 0.01
Clamp to range
Effect: Important features get amplified in RFF transformation, less important features get suppressed. System learns which features correlate with successful outcomes.
Temporal Context (Extreme Mode)
Challenge: Current market state alone may be incomplete. Historical context (was volatility rising or falling?) provides additional information.
Solution:
Includes 3-period historical context with exponential decay (0.85):
Current features (weight 1.0)
1 bar ago (weight 0.85)
2 bars ago (weight 0.72)
Effect: Captures momentum and acceleration of market features. System learns patterns like "rising volatility with falling entropy" that may precede significant moves.
Transfer Learning via Episodic Memory
Short-Term Memory (STM):
Last 20 trades
Fast adaptation to immediate regime
High learning rate
Long-Term Memory (LTM):
Condensed historical patterns
Preserved knowledge from past regimes
Low learning rate
Transfer Mechanism:
When STM fills (20 trades), patterns consolidated into LTM . When similar regime recurs later, LTM provides faster adaptation than starting from scratch.
Practical Implementation Guide - Recommended Settings by Instrument
Futures (ES, NQ, CL):
Adaptive Period: 20-25
ML Mode: Advanced
RFF Dimensions: 16
Policies: 6
Base Risk: 1.5%
Stop Mode: ATR or Hybrid
Timeframe: 5-15 min
Forex Majors (EURUSD, GBPUSD):
Adaptive Period: 25-30
ML Mode: Advanced
RFF Dimensions: 16
Policies: 6
Base Risk: 1.0-1.5%
Stop Mode: ATR
Timeframe: 5-30 min
Cryptocurrency (BTC, ETH):
Adaptive Period: 20-25
ML Mode: Extreme (handles non-stationarity)
RFF Dimensions: 32 (captures complexity)
Policies: 6
Base Risk: 1.0% (volatility consideration)
Stop Mode: Hybrid
Timeframe: 15 min - 4 hr
Stocks (Large Cap):
Adaptive Period: 25-30
ML Mode: Advanced
RFF Dimensions: 16
Policies: 5-6
Base Risk: 1.5-2.0%
Stop Mode: Structural or Hybrid
Timeframe: 15 min - Daily
Scaling Strategy
Phase 1 (Testing - First 50 Trades):
Max Contracts: 1-2
Goal: Validate system on your instrument
Monitor: Performance stabilization, learning progress
Phase 2 (Validation - Trades 50-100):
Max Contracts: 2-3
Goal: Confirm learning convergence
Monitor: Policy stability, exploration decay
Phase 3 (Scaling - Trades 100-200):
Max Contracts: 3-5
Enable: Kelly sizing (1/4 Kelly)
Goal: Optimize capital efficiency
Monitor: Risk-adjusted returns
Phase 4 (Full Deployment - Trades 200+):
Max Contracts: 5-10
Enable: Full momentum tracking
Goal: Sustained consistent performance
Monitor: Ongoing adaptation quality
Limitations & Disclaimers
Statistical Limitations
Learning Sample Size: System requires minimum 50-100 trades for basic convergence, 200+ trades for robust learning. Early performance (first 50 trades) may not reflect mature system behavior.
Non-Stationarity Risk: Markets change over time. A system trained on one market regime may need time to adapt when conditions shift (typically 30-50 trades for adjustment).
Overfitting Possibility: With 16-32 RFF dimensions and 6 policies, system has substantial parameter space. Small sample sizes (<200 trades) increase overfitting risk. Mitigated by regularization (λ) and fractional Kelly sizing.
Technical Limitations
Computational Complexity: Extreme mode with 32 RFF dimensions, 6 policies, and full RL stack requires significant computation. May perform slowly on lower-end systems or with many other indicators loaded.
Pine Script Constraints:
No true matrix inversion (uses diagonal approximation for LinUCB)
No cryptographic RNG (uses market data as entropy)
No proper random number generation for RFF (uses deterministic pseudo-random)
These approximations reduce mathematical precision compared to academic implementations but remain functional for trading applications.
Data Requirements: Needs clean OHLCV data. Missing bars, gaps, or low liquidity (<100k daily volume) can degrade signal quality.
Forward-Looking Bias Disclaimer
Reward Calculation Uses Future Data: The RL system evaluates trades using an 8-bar forward-looking window. This means when a position enters at bar 100, the reward calculation considers price movement through bar 108.
Why This is Disclosed:
Entry signals do NOT look ahead - decisions use only data up to entry bar
Forward data used for learning only, not signal generation
In live trading, system learns identically as bars unfold in real-time
Simulates natural learning process (outcomes are only known after trades complete)
Implication: Backtested metrics reflect this 8-bar evaluation window. Live performance may vary if:
- Positions held longer than 8 bars
- Slippage/commissions differ from backtest settings
- Market microstructure changes (wider spreads, different execution quality)
Risk Warnings
No Guarantee of Profit: All trading involves substantial risk of loss. Machine learning systems can fail if market structure fundamentally changes or during unprecedented events.
Maximum Drawdown: With 1.5% base risk and 4% max total risk, expect potential drawdowns. Historical drawdowns do not predict future drawdowns. Extreme market conditions can exceed expectations.
Black Swan Events: System has not been tested under: flash crashes, trading halts, circuit breakers, major geopolitical shocks, or other extreme events. Such events can exceed stop losses and cause significant losses.
Leverage Risk: Futures and forex involve leverage. Adverse moves combined with leverage can result in losses exceeding initial investment. Use appropriate position sizing for your risk tolerance.
System Failures: Code bugs, broker API failures, internet outages, or exchange issues can prevent proper execution. Always monitor automated systems and maintain appropriate safeguards.
Appropriate Use
This System Is:
✅ A machine learning framework for adaptive strategy selection
✅ A signal generation system with probabilistic scoring
✅ A risk management system with dynamic sizing
✅ A learning system designed to adapt over time
This System Is NOT:
❌ A price prediction system (does not forecast exact prices)
❌ A guarantee of profits (can and will experience losses)
❌ A replacement for due diligence (requires monitoring and understanding)
❌ Suitable for complete beginners (requires understanding of ML concepts, risk management, and trading fundamentals)
Recommended Use:
Paper trade for 100 signals before risking capital
Start with minimal position sizing (1-2 contracts) regardless of calculated size
Monitor learning progress via dashboard
Scale gradually over several months only after consistent results
Combine with fundamental analysis and broader market context
Set account-level risk limits (e.g., maximum drawdown threshold)
Never risk more than you can afford to lose
What Makes This System Different
RPD implements academically-derived machine learning algorithms rather than simple mathematical calculations or optimization:
✅ LinUCB Contextual Bandits - Algorithm from WWW 2010 conference (Li et al.)
✅ Random Fourier Features - Kernel approximation from NIPS 2007 (Rahimi & Recht)
✅ Q-Learning, TD(λ), REINFORCE - Standard RL algorithms from Sutton & Barto textbook
✅ Meta-Learning - Learning rate adaptation based on feature correlation
✅ Online Learning - Real-time updates from streaming data
✅ Hierarchical Policies - Two-stage selection with clustering
✅ Momentum Tracking - Recent performance analysis for faster adaptation
✅ Attention Mechanism - Feature importance weighting
✅ Transfer Learning - Episodic memory consolidation
Key Differentiators:
Actually learns from trade outcomes (not just parameter optimization)
Updates model parameters in real-time (true online learning)
Adapts to changing market regimes (not static rules)
Improves over time through reinforcement learning
Implements published ML algorithms with proper citations
Conclusion
RPD Machine Learning represents a different approach from traditional technical analysis to adaptive, self-learning systems . Instead of manually optimizing parameters (which can overfit to historical data), RPD learns behavior patterns from actual trading outcomes in your specific market.
The combination of contextual bandits, reinforcement learning, random fourier features, hierarchical policy selection, and momentum tracking creates a multi-algorithm learning system designed to handle non-stationary markets better than static approaches.
After the initial learning phase (50-100 trades), the system achieves autonomous adaptation - automatically discovering which strategies work in current conditions and shifting allocation without human intervention. This represents an approach where systems adapt over time rather than remaining static.
Use responsibly. Paper trade extensively. Scale gradually. Understand that past performance does not guarantee future results and all trading involves risk of loss.
Taking you to school. — Dskyz, Trade with insight. Trade with anticipation.

EMA Crossover with Supertrend + Ribbon + Multi TFThis is a multi indicator all in one, incorporates several indicators in one. Stay on the right side of the trend with this indicator, has customizable everything, a fast and slow ema ribbon, a second ema ribbon for longer ema lengths, a customizable multi time frame trend table, a customizable supertrend, the vwap, 2 background trend color changes , one for the ema's and one for the supertrend, daily support and resistance lines, follow up bearish or bullish signals on every candle. I am sure you will be able to find this multi indicator very useful!

Session H/L + Mid + Quarters — Live EvolvingSession High and Low with quarter lines for stop progressions with lines projected back X days

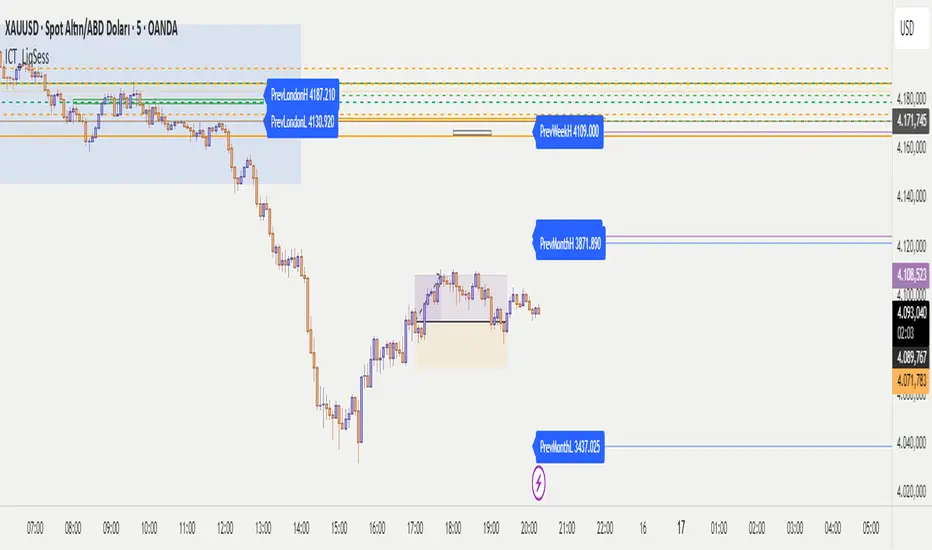
ICT - Liquidity & Sessions (Modular)ICT - Liquidity & Sessions (Modular)
A modular indicator for Inner Circle Trader (ICT) concepts, displaying liquidity zones, session levels, and key price levels.
Features:
Daily Levels:
Previous Day High/Low (PDH/PDL)
Previous Day Open/Close (PDO/PDC)
True Day Open (TDO) — NY 00:00
Current Day Open
Higher Timeframe Levels:
Previous Weekly High/Low
Previous Monthly High/Low
Session Analysis:
Session boxes: Asia, London, New York, Sydney, NY Lunch
Previous session High/Low for liquidity identification
Session open vertical lines
Session midlines (50% of session range)
Customization:
Toggle any level on/off
Customize colors, line styles, and widths
Adjustable session times (NY timezone)
Session box opacity control
Light mode option
Alerts:
Price crosses PDH/PDL
Price crosses Weekly/Monthly levels
Session open notifications
Performance:
Auto-cleanup of old lines/labels
Efficient drawing to prevent chart clutter
Modular design for easy customization
How to Use:
Add the indicator to your chart
Configure session times in the "Session Times (NY)" group
Enable/disable levels in the settings
Customize colors and styles to match your preference
Set up alerts for key level breaks
Perfect for:
ICT traders identifying liquidity zones
Session-based trading strategies
Multi-timeframe analysis
Identifying key support/resistance levels
Note: This indicator uses NY timezone for session calculations. Adjust session times in the settings to match your trading hours.
Weekly Fibonacci Pivot Signals (4H) - S1/R1 & S3/R3 rulesThis Indicator used weekly price range to calculate the pivot R1,R3,S1 and S3 ,when price crossed and closed below R3 in 4H timeframe the indicator gives sell signal, when the price crossed and close above the S3 the indicator gives buy signal. This indicator can give approximately 50% win Rate .

Dynamic Liquidity Levels [CDC Trading LABN] (ENGLISH)Script Description :
Take your market structure and liquidity analysis to the next level with Dynamic Liquidity Levels, a professional-grade tool designed to visualize the key levels that truly move the price. This indicator doesn't just plot static lines; it offers a dynamic framework that reacts to price action in real-time, keeping your chart clean and focused on what matters.
Designed for scalpers and swing traders alike, this indicator is your map for navigating market liquidity.
Key Features
• Smart Dynamic Lines: The standout feature of this indicator. Lines automatically stop extending once price has "invalidated" them. You decide whether the break occurs on a simple wick touch (to capture liquidity grabs) or a full candle close beyond the level (for a stronger confirmation).
• Comprehensive Liquidity Levels: Automatically draws the most important liquidity pools that professional traders watch every day:
• HTF Levels: Previous Day, Week, and Month Highs & Lows (PDH/L, PWH/L, PMH/L).
• Session Levels: Asian, London, and New York Session Highs & Lows (ASH/L, LSH/L, NYH/L).
• Full Label Control: Forget about overlapping labels. Adjust the position of each label individually (Left, Right, Center, Upper, Lower) for perfect visual clarity in any market condition.
• Instant, Configurable Alerts: Never miss an opportunity. Set up alerts that trigger the moment a level of your choice is broken, helping you execute your trades with precision.
• Clean & Professional Visualization: Fully customizable. Adjust colors, line width, and decide whether to display exact prices in the labels for an analysis setup tailored to your style.
Who is This Indicator For?
This tool is essential for a wide range of trading methodologies:
• Smart Money Concepts (SMC) & ICT Traders: Perfect for identifying liquidity pools and draw on liquidity levels. Use it to frame your order blocks and points of interest.
• Candle Range Theory (CRT) Traders: This indicator automates the core of your analysis. It identifies and projects the key candle ranges from higher timeframes (Daily, Weekly, Monthly) and trading sessions. Use these levels to anticipate price expansion and identify liquidity targets above and below established ranges, without manual markup every day.
• Price Action Traders: Clearly and automatically visualize the most relevant support and resistance levels based on high-timeframe market structure.
• Day Traders & Scalpers: Make quick decisions based on previous day's levels and session highs/lows, which act as magnets for intraday price.
• Swing Traders: Use the weekly and monthly levels to get a macro view of the structure and plan longer-term trades.
How to Use
1. Add the indicator to your chart.
2. Explore the settings panel to enable the levels and alerts that fit your trading plan.
3. Adjust the label positions for maximum clarity.
4. To receive alerts, right-click on the chart, create a new alert, select the indicator from the dropdown, and choose the "Any alert() function call" option.
We hope this tool greatly helps you improve your market analysis.
Happy trading!
CDC Trading LABN

Dynamic Liquidity Levels [CDC Trading LABN] (ESPAÑOL)Script Description :
Take your market structure and liquidity analysis to the next level with Dynamic Liquidity Levels , a professional-grade tool designed to visualize the key levels that truly move the price. This indicator doesn't just plot static lines; it offers a dynamic framework that reacts to price action in real-time, keeping your chart clean and focused on what matters.
Designed for scalpers and swing traders alike, this indicator is your map for navigating market liquidity.
Key Features
• Smart Dynamic Lines: The standout feature of this indicator. Lines automatically stop extending once price has "invalidated" them. You decide whether the break occurs on a simple wick touch (to capture liquidity grabs) or a full candle close beyond the level (for a stronger confirmation).
• Comprehensive Liquidity Levels: Automatically draws the most important liquidity pools that professional traders watch every day:
• HTF Levels: Previous Day, Week, and Month Highs & Lows (PDH/L, PWH/L, PMH/L).
• Session Levels: Asian, London, and New York Session Highs & Lows (ASH/L, LSH/L, NYH/L).
• Full Label Control: Forget about overlapping labels. Adjust the position of each label individually (Left, Right, Center, Upper, Lower) for perfect visual clarity in any market condition.
• Instant, Configurable Alerts: Never miss an opportunity. Set up alerts that trigger the moment a level of your choice is broken, helping you execute your trades with precision.
• Clean & Professional Visualization: Fully customizable. Adjust colors, line width, and decide whether to display exact prices in the labels for an analysis setup tailored to your style.
Who is This Indicator For?
This tool is essential for a wide range of trading methodologies:
• Smart Money Concepts (SMC) & ICT Traders: Perfect for identifying liquidity pools and draw on liquidity levels. Use it to frame your order blocks and points of interest.
• Candle Range Theory (CRT) Traders: This indicator automates the core of your analysis. It identifies and projects the key candle ranges from higher timeframes (Daily, Weekly, Monthly) and trading sessions. Use these levels to anticipate price expansion and identify liquidity targets above and below established ranges, without manual markup every day.
• Price Action Traders: Clearly and automatically visualize the most relevant support and resistance levels based on high-timeframe market structure.
• Day Traders & Scalpers: Make quick decisions based on previous day's levels and session highs/lows, which act as magnets for intraday price.
• Swing Traders: Use the weekly and monthly levels to get a macro view of the structure and plan longer-term trades.
How to Use
1. Add the indicator to your chart.
2. Explore the settings panel to enable the levels and alerts that fit your trading plan.
3. Adjust the label positions for maximum clarity.
4. To receive alerts, right-click on the chart, create a new alert, select the indicator from the dropdown, and choose the "Any alert() function call" option.
We hope this tool greatly helps you improve your market analysis.
Happy trading!
CDC Trading LABN

B21V21This Pine Script is designed to provide both previous-day reference levels and real-time market data, making it suitable for live trading applications. It automatically retrieves all key historical levels—such as PDH, PDL, PDC, and PDO—for the currently selected strike as well as the corresponding opponent strike.
The script allows users to compare two instruments or strikes by selecting either a self-opponent view or any required strike for cross-analysis. Important intraday levels are displayed dynamically during live market conditions, enabling traders to make informed and timely decisions.

ADR Daily Range + Volatility + KZs — SMC/ICT (@PueblaATH)ADR Daily Range + Volatility + KZs — SMC/ICT (@PueblaATH) is a complete intraday context and volatility HUD that plots market opens, killzones, previous period highs/lows, and a dynamic ADR/volatility dashboard. It is built to give SMC/ICT traders an at-a-glance view of when and where price is moving: sessions, overlaps, ranges, and distance to key levels, all on a single clean overlay.
What the Indicator Does
Market Opens (Tokyo, London, New York)
Professional-grade session open lines with:
Individually configurable open times per session and timezone.
Infinite vertical lines or height-limited extensions (custom tick offsets).
Fully styled labels: size, alignment, auto-background, manual background, and vertical offset.
Killzones & Session Overlaps
Precision-timed shaded boxes for:
Tokyo Killzone
London Killzone
New York Killzone
London–New York Overlap
Previous Period Levels (PDH/PWH/PMH & PDL/PWL/PML)
Robust daily/weekly/monthly high/low engine:
Accurate Previous Day / Week / Month Highs & Lows (Europe/Madrid reference).
Line length modes: infinite, N bars, or end-of-day projection.
Per-level colors + labeled markers placed to the right of price with custom horizontal/vertical spacing.
Timeframe & Weekend Filters
Keep charts clean by hiding components based on:
Custom timeframe ranges (hide opens or killzones on HTFs).
Weekend filters for opens, killzones, and ADR/table.
Optional override to display the HUD table across all timeframes.
Session Comparison Table (Top-Right HUD)
A compact, institutional-style session dashboard comparing:
Tokyo, London, New York — current open vs previous session and previous day.
Bullish/Bearish state with color-coded logic (+ optional ▲/▼ arrows).
Optional Δ% change column relative to previous day’s open.
ADR / Volatility Panel (24h Rolling Window)
A powerful real-time volatility module providing:
True 24-hour rolling high–low range.
SMA-based ADR calculation with automatic bar-count safety limits.
ADR% expansion metric with two thresholds + blinking color logic for volatility extremes.
Directional bias vs price 24 hours ago (Bullish/Bearish).
Optional metrics: distance to PDH/PDL (in price units) and absolute H–L / ADR values.
How to Use It
Set each session’s open time and killzone window according to your broker or desired timezone alignment.
Enable or disable session opens and killzones to frame the trading windows you prioritize (e.g., LDN Killzone or NY session expansion).
Activate key previous period levels (PDH/PDL, PWH/PWL, PMH/PML) and tune the line-length mode and label spacing to match your workflow.
Use timeframe & weekend filters to keep higher-timeframe charts clean while maintaining precise intraday visibility on lower timeframes.
Monitor the session comparison table to understand directional behavior relative to previous sessions and previous day opens.
Watch the ADR panel to classify the day as compressed, normal, or expanded—and anticipate potential reversion or continuation.
Originality & Credits Disclaimer
This indicator is an original work by @PueblaATH , created specifically for the tool ADR Daily Range + Volatility + KZs — SMC/ICT (@PueblaATH) and distributed under the MPL 2.0 license.
While the concepts implemented—session opens, killzones, ADR, and previous highs/lows—are public and widely known in the trading community, this script introduces a uniquely integrated framework that combines:
Multi-timezone session scheduling with dynamic TF/weekend filtering.
A modular PDH/PWH/PMH + PDL/PWL/PML engine with versatile projection and labeling controls.
A precise 24-hour volatility model tied to an ADR panel with extension thresholds, blinking alerts, and distance-to-PD metrics.
A multi-session comparative table that unifies Tokyo, London, and New York open data in real time.
This work does not reuse or repackage code from other authors. Any future adaptations from public sources will always include full, transparent credit and documentation.

Liquidity Hunter Pro v11.9 — TQI EditionLiquidity Hunter Pro v12 is built for intraday traders who want structure, clarity, and precision without unnecessary clutter. The tool blends market structure, momentum, trend alignment, volatility regime analysis, and liquidity mapping into a single unified model.
This version focuses on three core goals:
1. Identify only high-quality, directional market conditions.
The engine filters through HTF bias, short-term structure shifts, RSI momentum, and volatility compression/expansion. The idea is simple: wait for the market to become clean, aligned, and directional before considering an entry.
2. Map liquidity and detect sweeps in real time.
Major highs and lows are tracked using extended pivots, and the system highlights key areas where stop hunts or sweeps may occur. Sweeps and pressure zones are evaluated and factored directly into the quality score.
3. Grade every potential setup with a single, objective metric (TQI).
The Trade Quality Index (0–5⭐) compresses all signals into one reading so the trader can quickly judge whether a setup has enough quality to act on.
The script includes:
• Trend + Momentum + Structure detection
• HTF bias (optional)
• Volatility regime analysis
• Liquidity sweeps + pressure zones
• Micro-confirmation engine
• PQI (0–100%)
• TQI (0–5⭐)
• Clean HUD and Driver’s Guide
• Auto-cleaning labels and signal management
• Optional session filtering (London/NY)
This tool is designed for traders who value confirmation over noise.
It will not fire constantly.
It will wait patiently for clean, directional, aligned markets — and only then issue a signal.
How to Use Liquidity Hunter Pro v12
1. Check the HUD (top-right by default)
The HUD is your dashboard. Before doing anything:
A. HTF Bias
This is your map. Only trade in the direction of the bias.
B. Trend / Momentum / Structure
These should ideally all match the direction of the bias.
If they don’t line up → wait. No alignment = low probability.
C. Liquidity + Volatility Regime
“Sweep ↑→↓” or “Sweep ↓→↑” = potential reversal points
“Expansion” = clean conditions
“Compression” = choppy, avoid
You don’t need to overthink any of this — just think:
“Are the ingredients lined up?”
2. Wait for a valid signal
The indicator will only trigger a BUY or SELL when:
✓ HTF bias aligns
✓ Trend & momentum align
✓ Structure supports the move
✓ Micro-confirmation kicks in
✓ PQI ≥ 75
✓ Sessions are open (optional)
Signals are rare on purpose.
When one prints, you know the market conditions are stacked.
3. Read the label
Each signal prints a small block next to the candle containing:
• Entry price
• SL (based on structure)
• TP(2R) suggestion
• Liquidity context (e.g., sweep or pressure)
• Volatility regime
• TQI ⭐ rating (0–5)
This helps you judge the setup instantly.
A simple rule for beginners:
Trade only if TQI ≥ ⭐⭐⭐
Lower than that = more noise, less edge.
4. Use the liquidity zones
The script plots subtle boxes at recent liquidity highs/lows.
These mark:
• Where the market may hunt stops
• Where reversals often start
• Where signals are more meaningful
When a signal happens near liquidity → higher quality.
5. Follow the session filter (optional but recommended)
By default the tool focuses on:
• London session
• New York session
That removes 70% of low-volatility garbage.
You can turn this off if you trade crypto or indices overnight, but beginners usually benefit from keeping it on.
Recommended Settings
These are the settings used by most testers and early users.
Everything is configurable, but start with this:
Core Settings
• Fast EMA: 21
• Slow EMA: 55
• RSI Length: 14
• Pivot Lookback: 2
These settings create balanced structure detection and smooth trend signals.
HTF Bias
• Use HTF Bias: ON
• HTF Timeframe: 240 (H4)
H4 bias keeps you out of counter-trend traps.
Sessions
• Use London/NY Filter: ON
• London: 08:00–17:00
• New York: 13:30–21:00
Perfect for FX, indices, and metals.
Crypto traders: turn sessions OFF.
HUD + Guide
• HUD: ON
• Guide: ON
• Linger Bars: 12
This keeps things readable and prevents clutter.
Trading Tips for Beginners
These help keep you out of trouble:
1. Don’t fade the bias.
If HTF says bearish → avoid buys.
2. Don’t trade in compression regimes.
It saves you from chop.
3. Don’t chase signals that fire far from structure.
If the signal candle is huge, let it go.
4. Don’t trade without at least ⭐⭐⭐.
You’ll thank yourself later.
Final Thoughts
Liquidity Hunter Pro v12 isn’t meant to spam signals.
It’s meant to filter hard, highlight clean conditions, and help new traders avoid the traps the market throws every day.
Treat it as a trading assistant that tells you:
“The environment is right. Now you decide.”

Long-term Reversal Signals [OI + CVD + Volume]Open Interest, CVD, Volume Delta 등을 활용해서 장기적 반전 구간을 측정하는 시그널 지표입니다.
It uses Open Interest, CVD, Volume Delta Indicators.
This is an indicator that quantitatively creates conditions and specifies them by comprehensively utilizing the characteristics of each data and combining them with the characteristics of the area where prices are reversed.
Thank you!
Liquidity Sweeps + Swing High/Low — SMC/ICT (@PueblaATH)Liquidity Sweeps + Swing High/Low — SMC/ICT (@PueblaATH) is a liquidity-driven Smart Money Concepts tool that automatically maps out key swing highs and lows, tracks how they evolve into liquidity pools, and highlights when those levels are swept and either respected or invalidated. This indicator is built to give traders a clean, event-driven view of stop runs and liquidity grabs across any timeframe, from scalping to higher-timeframe context.
What the Indicator Does
Swing Structure & Liquidity Pools
Detects swing highs and lows using a configurable swing length, projects levels forward in time, and builds a liquidity-pool database through pivot arrays used for sweep detection.
Liquidity Sweeps (Stop Runs)
Identifies bearish (upward) and bullish (downward) sweeps through prior liquidity levels using three modes: Any Touch, Wick + Close Back, and Retest Rejection.
Each sweep can generate projective lines, labeled markers, and alerts.
Scope, Rate Limiting & Clean Visuals
Controls minimum spacing between swings and sweeps, limits sweep duplication, auto-revokes invalidated sweeps, and restricts the maximum number of visible events.
Smart offset logic reduces label overlap and keeps charts clean even in dense price action.
Timeframe Filters & Utilities
Allows hiding all drawings between specific timeframes and optionally skipping calculations or clearing internal state when hidden.
Includes debug pivot markers and an optional TF/Bucket badge.
Timeframe Auto-Mode (Original Adaptive Engine)
This indicator features a fully original, seven-bucket Auto-Mode engine that adapts sensitivity to the active timeframe.
Bucket Classification (by seconds)
≤1m, >1m–15m, >15m–30m, >30m–1h, >1h–4h, >4h–1d, >1d.
Bucket-Specific Settings
Each bucket has unique sensitivity sets:
Swing/Sweep lengths
Projection distances
Line style and width
Rate-limiting gaps
Pivot count and bar-lookback windows
Overlap windows
Adaptive Behavior
Lower timeframes gain more reactive behavior, while higher timeframes apply smoother and more selective filters.
Manual Override
Auto-Mode can be disabled to use the Core manual settings for full customization.
How to Use It
Attach the indicator and choose whether to keep Auto-Mode ON or OFF.
Select the sweep mode (e.g., Wick + Close Back for ICT-style liquidity grabs).
Adjust label text, size, color, and offsets to your preference.
Use timeframe filters to show drawings only where you want them.
Enable alerts for bullish sweeps, bearish sweeps, or revocations.
Combine sweep events with your own confluence (sessions, bias, OBs/FVGs, etc.).
Originality & Credits Disclaimer
This script is an original work by @PueblaATH , created specifically for Liquidity Sweeps + Swing High/Low — SMC/ICT (@PueblaATH) under the MPL 2.0 license.
The concepts used (swing highs/lows, liquidity pools, sweeps, SMC/ICT behavior) are public and widely known—they do not belong to any author or protected script.
This indicator does not repackage or cosmetically modify existing code.
Its architecture—including the multi-bucket Auto-Mode engine, pivot/sweep management system, revocation logic, overlap-aware labeling, and TF-based hide/skip/clear controls—is uniquely implemented for this script.
If any future update reuses or adapts code from public sources, full credit will be given in both comments and description, with clear explanation of what was reused and what was originally added or improved.

Previous Day H/L/CYour good old Previous day High, Low and Closing lines. I made this so you don't have to! lol
