Pontos Pivô

ETH Top Cap [jamesray]This script is modified from Top Cap , as published here.
Historically it matches market tops for ETH

Indicator EMA(20),SMA(100,150,200),VMA, Trader/Learner ModeBINANCE:XLMUSDT
This script contains two modes or environment of operation: Trader and Learner. Below, each mode of operation is explained.
Learner Mode
In Learner mode (Settings -> Enviroment Learner), you can see pivot points with floats values, color change for high bars, ema/ sma cross movements with vertical lines and texts (Golden Cross, Death Cross, Upward movement, Downward movement), green bar over red bar and ema 20 support (ENTRY POINT), trend arrows and supports / resistances.
Trader Mode
In Trader mode (Settings -> Enviroment Trader), you can see pivot points with triangle shaped, color change for high bars, ema/ sma cross movements with vertical lines, green bar over red bar and ema 20 support (ENTRY POINT).

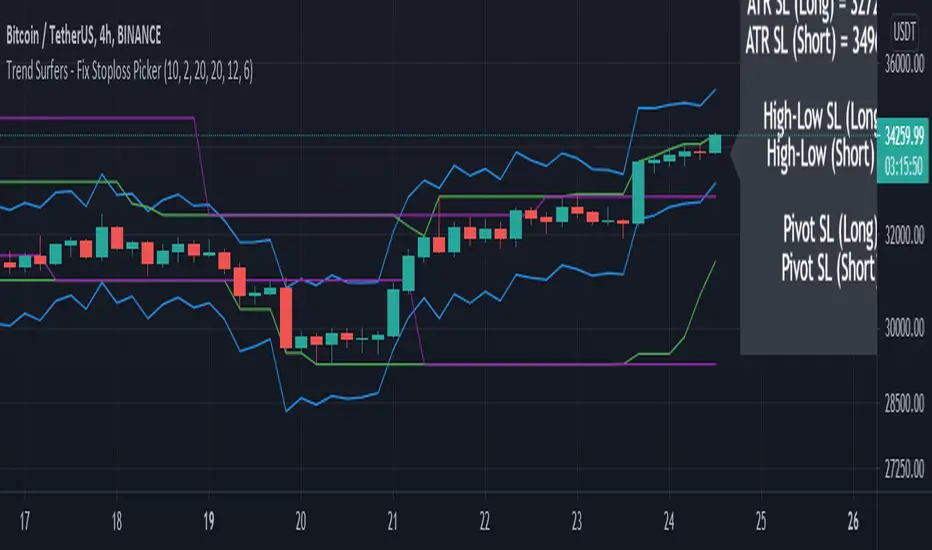
Trend Surfers - Fix Stoploss PickerThis study include 3 types of stop-loss (ATR, High/Low and Pivot point)
This script aimed to help new traders to respect risk management.
Simply select which stop-loss you would like to use in the settings and the suggested stop-loss will be displayed on the chart for Long and Short positions.
Please let me know in the comment if you would like me to add more indicators for the stop-loss in this script.
Hope you like it!
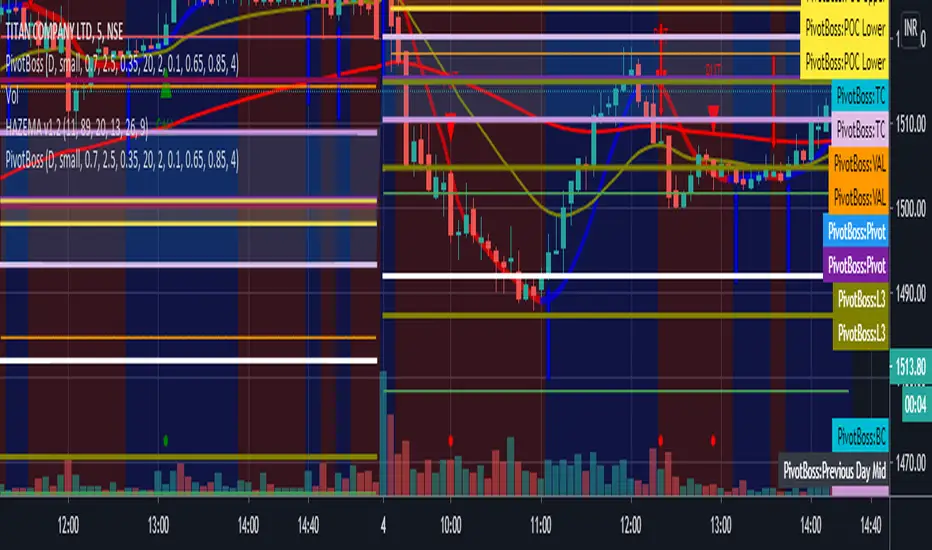
Floor Pivots With CPR and Camarilla 3 LevelsThis script plots floor pivots with the central pivot range and camarilla R3/S3 pivots, to spot with ease the Golden Pivot Zone (GPZ). As described in the book *Secret of a pivot Boss* by Franklin Ochoa, the Golden Pivot Zone occurs when R3 or S3 pivot from the Camarilla Equation or from lies within the central pivot range. This combination can be simply profitable.
A bearish GPZ occurs when R3 of the Camarilla Equation is mixed within the central pivot range, therefore we should look for sells in that zone.
A bullish GPZ occurs when S3 of the Camarilla Equation is mixed within the central pivot range, therefore we should look for buys in that zone.
Here are some examples on Gold
Good luck !
Ps* i got part of the code from @cristian.d script

All in one pivot by AkhileshCamarilla Trade Setup:
Sell Opportunity:
H3 Reversal Trade
Entry - H3
Stop Loss - H4
Target - L3
L4 Breakout Trade
Entry - L4
Stop Loss - L3
Target - L5
Buy Opportunity:
L3 Reversal Trade
Entry - L3
Stop Loss - L4
Target - H3
H4 Breakout Trade
Entry - H4
Stop Loss - H3
Target - H5
Trade Type:
Scalping trading
Intraday trading
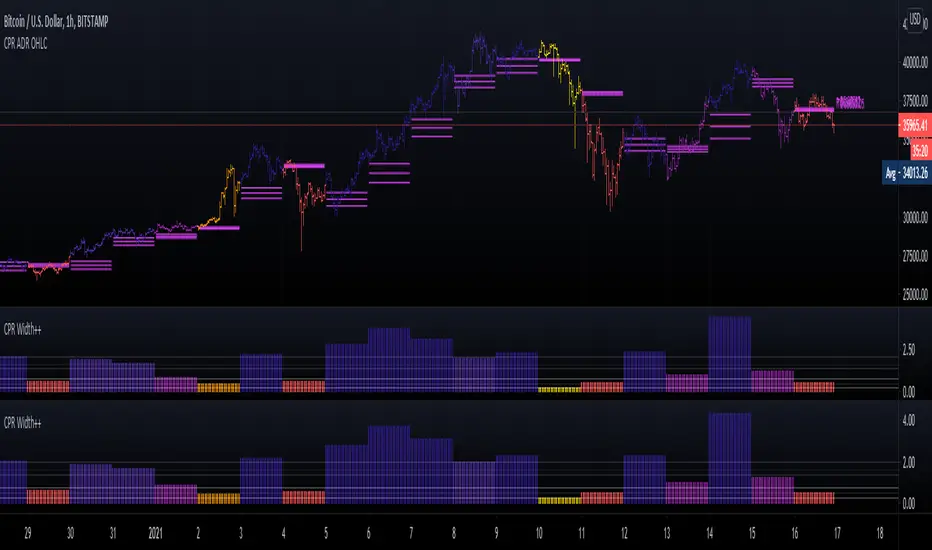
CPR Trade Setup:
1. Narrow CPR indicates Trending market
2. Wide CPR indicates Sideways market
Volume-Supported Linear Regression TrendHello Traders,
Linear Regression gives us some abilities to calculate the trend and if we combine it with volume then we may get very good results. Because if there is no volume support at up/downtrends then the trend may have a reversal soon. we also need to check the trend in different periods. With all this info, I developed Volume-Supported Linear Regression Trend script. The script checks linear regression of price and volume and then calculates trend direction and strength.
You have option to set Source, Short-Term Period and Long-Term Period. you can set them as you wish.
By default:
Close is used as "Source"
Short-Term Period is 20
Long-Term Period is 50
in following screenshot I tried to explain short term trend (for uptrend). Volume supports the trend? any volume pressure on trend? possible reversal? same idea while there is downtrend.
in following screenshot I tried to explain long term trend:
You can also check Positive/Negative Divergences to figure out possible reversals (to automate it, you can use Divergence for Many Indicators v4 , it has ability to check divergences on external indicators)
Enjoy!

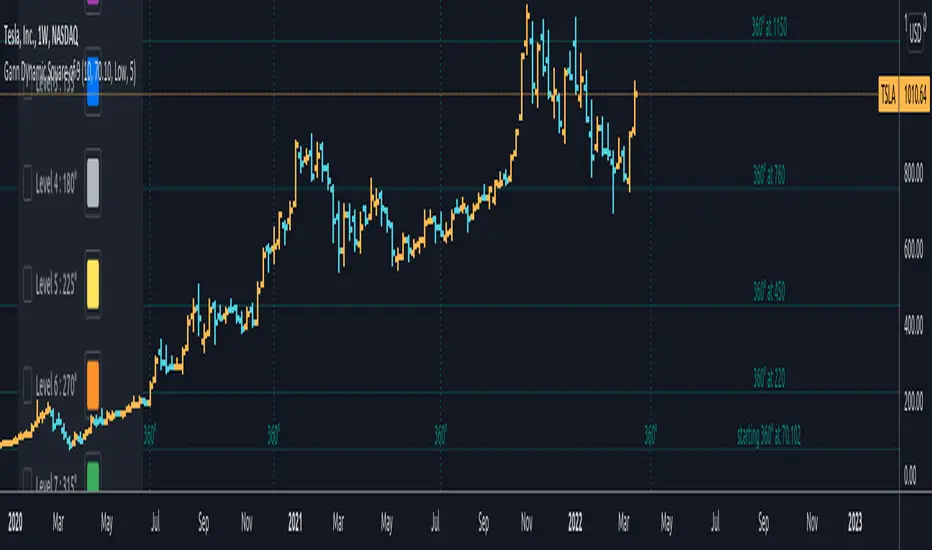
Gann Dynamic Square of 9Gann Dynamic Square of 9
// ========================================================================//
This script uses the same number series in the square of nine chart. Taking into considerations a high/low pivotal level of your choosing at $1/degree. It includes these degrees : ( 360, 315, 270, 225, 180, 135, 90, and 45 )
This dynamic square of 9 is different than the static one. The values always start at your low/high rather than one. All that you need to do is select and anchor your low/high and it will plot everything for you.
You will also be able to adjust the color of each line to differentiate between them.
This script also complements the Gann ToolBox that I have on my tradingview page giving you good measurement of the market and some of its volatility dates and locations in price.
// ========================================================================//
To get access to this add-on or for the full package including the toolbox you can see my information below.
Pricing in Alternative CurrenciesSometimes securities make new highs/lows in one currency but not in other currencies. This can lead traders to believe that a security's price move is much stronger than it is in reality, and especially to international traders and investors. To avoid trading errors, it can be useful to be able to look at a security's price in alternative currencies which is what this indicator is designed to do.
INDICATOR USAGE
1. Select the primary alternative currency (Default USD)
2. Select the secondary alternative currency (Default EUR)
3. Select "Candles" to view OHLC chart or Close/High/Low to view the pricing as a line chart
Note 1
The secondary alternative currency will apply ONLY when a security is priced in the selected primary alternative currency.
For example, assuming the primary alternative currency is USD and the secondary is EUR:
Scenario 1: Security priced in GBP would be repriced under this indicator using the primary alternative currency being USD
Scenario 2: Security priced in USD would be repriced rather using the secondary alternative currency being EUR

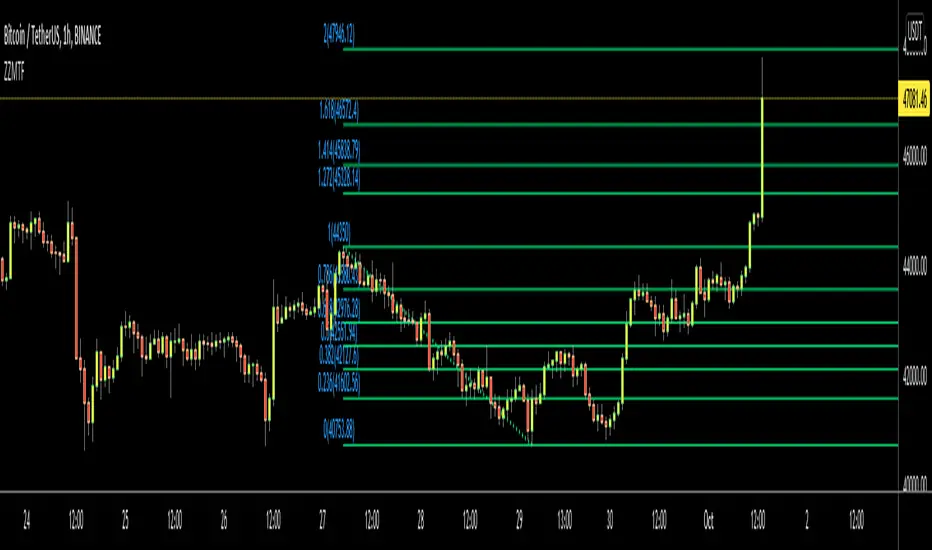
ZigZag Multi Time Frame with Fibonacci RetracementHello Traders,
This is ZigZag Multi Time Frame with Fibonacci Retracement script. It calculates the ZigZag using Higher Time Frame, draw Fibonacci Retracement lines and put labels accordingly. I already published Zigzag with Fibonacci Levels script but this one is Multi Time Frame and I didn't want to change/update it.
You can set ZigZag Period and Resolution as you wish. Zigzag is calculated using higher time frames (ex: 1day) so you better choose small numbers as Zigzag Period, such 2, 3 etc. you should choose higher time frame wisely, meaning that you should not set 1Day while chart resolution is 1min ;)
It draws Fibonacci levels between 0%-100% and If the price goes higher/lower than 100% level than the script draws Fibonacci Levels accordingly. This means it draws Fibonacci levels until this levels get higher/lower than the price.
"Show Zig Zag" is not enabled by default, you can enable it if you want to see ZigZag as well.
You have options to set Text Color, Line Color, Zigzag Up Color and Zigzag Down Color.
You can set the location of the Fibonnaci Levels -> Left or Right
You also have option to enable/disable following Fibonnaci Levels:
---> 0.236
---> 0.382
---> 0.500
---> 0.618
---> 0.786
I added "Colorful Fibonacci Levels" for fun. if you enable it then Fibonacci line colors will be different randomly on each move, see it for yourself :)
Some Screenshots:
if you enable "Show Zigzag Option":
how the script adjust levels automatically:
if you set Label Location as "Right":
if you enable "Colorful Fibonacci Levels" then Line colors will be changed on each move randomly ;)
Enjoy!
Intraday Multi timeframe CPRDue to the request of some users and inspired by "Intraday CPR " I updated "CPR for Intraday Trading " and added extra functionality for your convenience.
Intraday CPR levels are changed according to timeframe instead of previous day high, low and close
This indicator you can change timeframe : Week ,Day, 240 min ,180in, 120 min, 60 min
code credit : ThePivotTrader

Wick Stop ZonesCount how many wicks bottom out in each price zone. Specify the following inputs.
Lookback: How far back from the latest candle to look for wick intersects.
Zone Size: The price range size for zone. Wicks tips that fall into each zone will be counted.
Minimum Intersects: Specifies how many wick tips must intersect with the zone before the zone is allowed to plot.

Beacon - Anthony Crudele's IndicatorBeacon uses the current volatility of the market based on your trading time frame to determine support and resistance levels, whether a trend is intact or ready to revert back in the range. One of the most difficult things I went through as a trader was determining whether we are in a trend day or if we are in grind up or grind down mode. I created Beacon to give me a simple look at the market to determine what type of environment we are in. I use Bollinger Bands (3 standard deviation) to determine the volatility cycle. Once the BB make peaks I took my Fibonacci Retracement tool and did a retracement from the peak high of the BB to the peak low. I use 70%, 50% and 30% for my support and resistance levels. I use those levels because I tested pretty much every percent level and those percentages averaged the highest performance on all tick charts and time charts. You can use Beacon on whatever time frame or tick chart you are trading on and it will determine that specific volatility cycle.

Nick Rypock Trailing Reverse (NRTR)This indicator was invented in 2001 by Konstantin Kopyrkin. The name "Nick Rypock" is derived from his surname reading in the opposite direction:
Kopyrkin -> Kopyr Kin -> Kin Kopyr -> Nik Rypok
The idea of the indicator is similar to the Chandelier Exit, but doesn't involve ATR component and uses a percentage instead.
A dynamic price channel is used to calculate the NRTR. The calculations involve only those prices that are included in the current trend and exclude the extremes related to the previous trend. The indicator is always at the same distance (in percent) from the extremes reached by prices (below the maximum peak for the current uptrend, above the minimum bottom for the current downtrend).

[JRL] Pivot Regression OscillatorIntroducing the Pivot Regression Oscillator. This oscillator uses a similar formula to the Stochastic Oscillator. However, instead of comparing the closing price to the lowest price of a period, it compares the distance between current price and the current pivot point. By basing our oscillator on pivot levels, we incorporate a much more relevant and consequential price point around which to base our comparisons.
The indicator can give reliable overbought and oversold signals, and it plots two exponential moving averages as output, which provides crossover signals that can be used to help time trades.
The Pivot Regression Oscillator can be effective for timing re-entries into a trend and seems to be able to avoid some of the false signals of other indicators.
Let me know if you find this useful. Cheers!

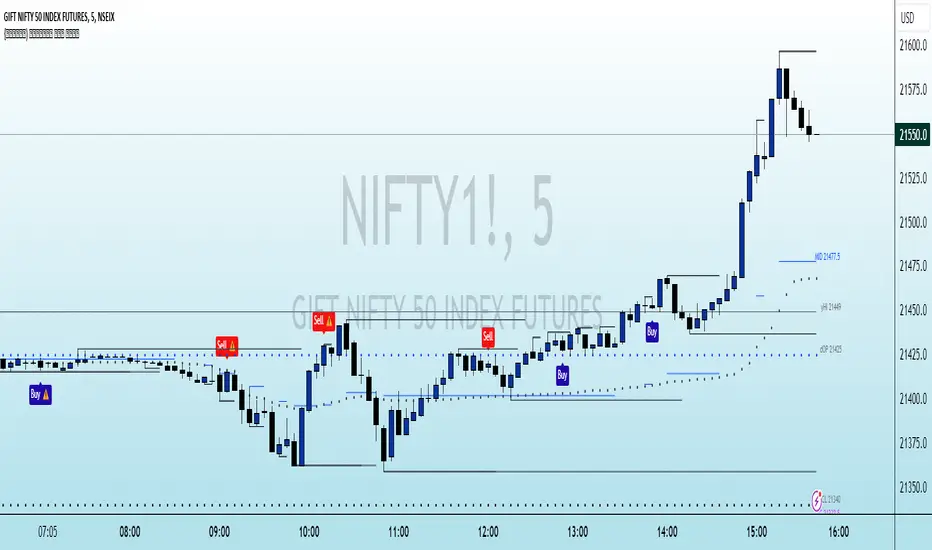
{INDYAN} Perfect Buy SellA simple indicator based on candle stick strength, with cpr,vwap and support resistance...
search for buy sell signal on 15 min timeframe and wait for second candle to close above/below of signal candle. Cpr pivots would act as support and resistance. Entry should only be based on 15 mins or higher timeframe. 3 and 5 mins timeframe for profit booking.
No supertrend or atr used in this indicator.
This show how a single candle can give u good trade...
Love Indyan
* tested on Banknifty and nifty , kindly share ur experiences on other scrips. Thanks
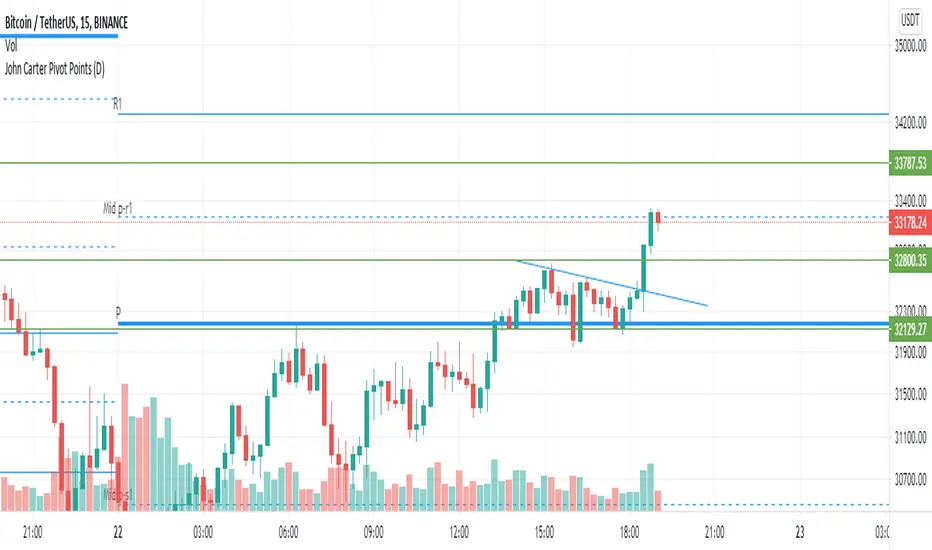
John Carter Pivot Points
This script is based on John Carter Mastering The Trade book. Pivot calculation is based on the previous day high, low, and close.
What Are the Trading Rules for Pivot Buys on Trending Days?
Sells are reversed.
1. Each day I update the appropriate pivot levels on the charts to reflect the previous day’s action. On Mondays, I also
update the weekly pivots, and on the first trading day of a new month, I update the monthly pivots.
2. The first pivot play is done in conjunction with the gap, if there is one. If there is a gap down, then I buy a decline into
the closest pivot level. If there isn’t a playable gap (more than 10 YM points or 1 ES point), then I will wait until
9:45 a.m. eastern to initiate the first play.
3. If the volume on the five-minute ES chart is more than 25,000 contracts, then I’ll wait for the markets to penetrate a
pivot level and move up at least a quarter of the way to the next pivot level. Once this happens, I will then set up a
bid to buy the first retracement back to the violated pivot level.
4. I enter my trades with limit orders only. I place orders “just in front of” the pivot. For the YM, I use 3 points; for the
ES, 0.25 point; for the NQ, 0.50 point; for the TF, 0.20 point; and for individual stocks, 5 cents. For example, if I’m
trading the YM and the pivot level is 10,000, then I would buy a decline to 10,003 and short a rally to 9997
.Sometimes the pivot will be an odd number, such as 1117.38 on the ES. In this case, I always round in the direction of
the trade. So, if I’m bidding for a long, I will round 1117.38 to 1117.50, and my bid will be 1117.75. If I’m offering a
short, I will round 1117.38 down to 1117.25 and place my offer at 1117.00. My stops and targets, then, would be “just
in front of” these appropriate long and short levels.
5. Once filled, I place an order to close the first half at the next pivot level and the second half at the pivot level after
that, using the same “just in front of” parameters.
6. I place a stop at 20 points for the YM, 2 points for the ES, 4 points for the NQ, and 1.50 points for the Russell. For
stocks, I will use a stop based roughly on the price of the stock. If the stock is under $10 a share, I will use a stop of
20 cents. If it is between $10 and $20, I will use a stop of 30 cents; if it is between $20 and $30, I will use a stop of
40 cents, and so on, adding another 10 cents for each $10 increment in price. (A $75 stock would have an 80-cent
stop, for example.)
7. If the first target is hit, I will then move up the stop to my entry-level pivot, minus the “just in front of” fractions
discussed in rule 3. For example, if I get in a YM long at 10,003 and the pivot is at 10,000, then my new stop would
be 9997 once the first target is hit.
8. If I am in a trade at the market close and neither my stop nor my target has been hit, I will close out my position “at the
market” at 4:10 p.m. eastern for futures, and at 3:58 p.m. eastern for stocks.
9. I don’t initiate any new positions after 3:30 p.m. eastern, but I will manage existing positions into the close.
10. The markets rarely have a sustained move above R3 or below S3. If I trade to those levels, I will always fade the
move.
11. After two losers in a row, I’m done with pivots for the day.
What Are the Trading Rules for Pivot Buys on Choppy Days?
Once again, sells are the same, just reversed. The rules for choppy days are identical except for the targets. On choppy days, I
just focus on the YM and the ES. My first target is mechanical: 10 points for the YM and 1 point for the ES on half of my
position. Once this is hit, I will trail up my stop in the same way I would for a trending trade. The second target becomes the
“just in front of” level for the actual next pivot level
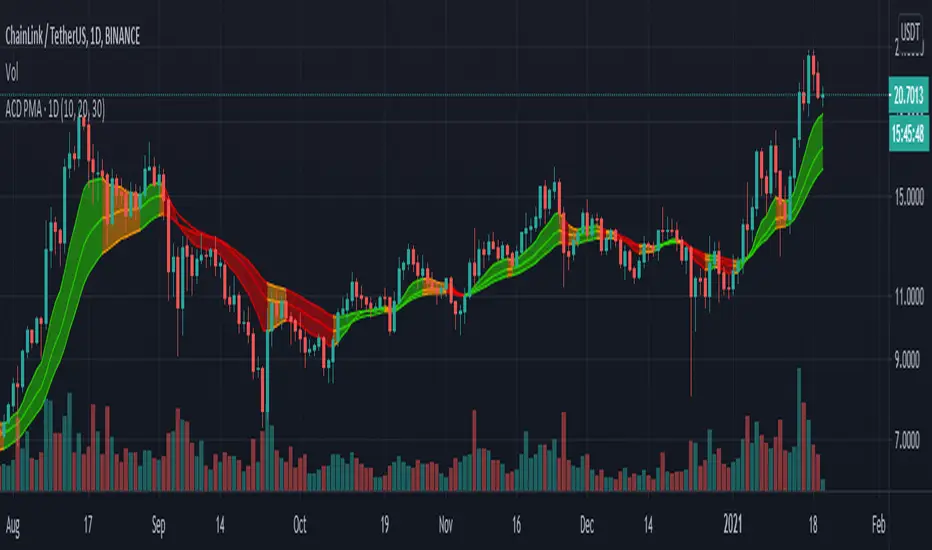
ACD PMAPMA (Pivot Moving average) is a set of 3 EMAs on HLC3 data.
When all PMAs are rising, market is considered bullish and the color of PMA becomes green. When all PMAs are falling, market is considered bearish and the color of the PMA becomes red. Otherwise, market is considered ranging and the color becomes orange.
It's also possible to set the resolution of PMAs. For example, you can see daily PMA of 15min charts. This way, if resolution of PMA is greater than resolution of chart, a vertical line shows the beginning of the PMA's resolution candles.
These PMAs are important components of Mark Fisher's ACD strategy.
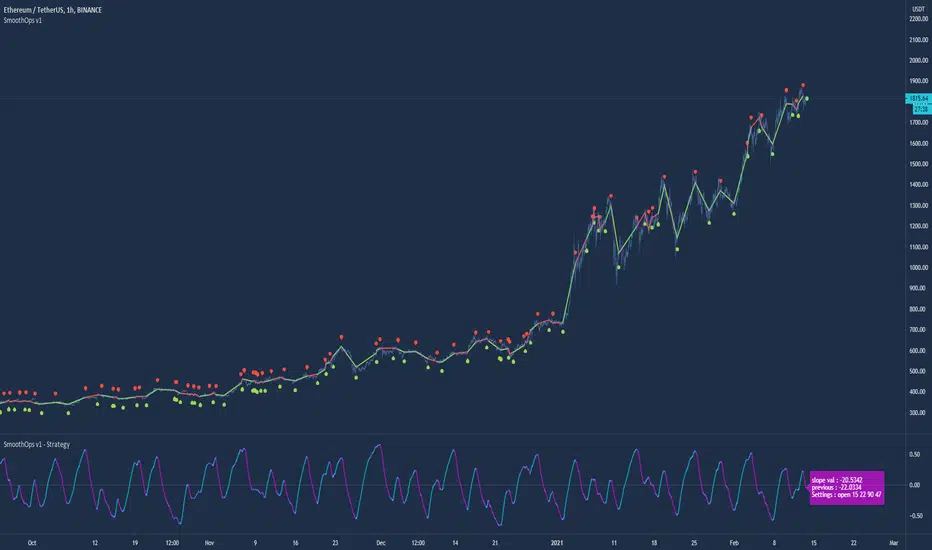
SmoothOps v1 - StudyThe purpose of this script was to fine tune an indicator on BTCUSDT . I think the results speak for themselves in the study version.
This is a script that uses the MACD to predict future price movement. The original MACD signal lags too much for my taste so I went searching for something that could give signals sooner. I decided a smooth macd would help filter out noise and grabbing the highest values and lowest values over the past number of bars. I spent several days backtesting different settings and combinations of signals to arrive at what you see now. This strategy has been fine tuned for BTC /USDT on Binance, so I suggest you only use it for that. Any other coin/pair and exchange will need a new backtest since the data will be different. This is not a generalized indicator like everything else. It's specifically good at one thing: prediction BTCUSDT on Binance.
I wanted to also add the histogram from the study version but there wasn't a good way to do that, so I came up with a visual solution using color transitions on the 168sma. When the color changes from blue to red it means the histogram is reversing.
I added forecasting to the moving averages to help people predict future movement so they can make decisions by something other than just a sign of when to buy/sell.
There is a transition prediction feature that blurs the macd signal to show when a reversal may occur before it happens.
I also added precitions into the indicator that show when there may be a possible bounce or major move because of a current squeeze in the moving averages.
And finally...
My biggest issue with indicators that other people sell is that they become visually deceptive when using supports and buy/sell signs. I came up with a solution that shows you exactly if you made profits during the trade or not. Hopefully this will inspire others to do something similar.
How to use:
Use only on BTCUSDT Binance.
Set the preset to the timeframe you want. I HIGHLY suggest only using the 1h timeframe. It gives the best profit over time.
Set the preset to custom if you want to try using your own settings.
You can change the source input if you want. ohlc4 usually works best for 1h.
Adjust the moving averages to your liking. You can also toggle the checkbox to completely remove them.
Turn on/off the forecasting of the moving averages.
Turn on/off the additional signals with the checkbox.
Transition prediction uses a blur variable to signal when the macd might be slowing down and reversing.
Bounce prediction and sensitivity tries to find possible reversal areas when price falls too fast or hits a specific moving average.
Macro signals just tries to show when price is above the 168moving average to get the macro trend.
Squeeze prediction indicates when a possible strong move may occur. Could go up or down though.
Show profit is my favorite part because it shows if you made profit during the last trade visually and non deceptively.
3 Weeks Tight - Price Consolidation [LevelUp]3 Weeks Tight - Introduction
3 weeks tight is a bullish continuation pattern discovered by IBD's founder, William O'Neil.
The pattern can used as an opportunity to add to an existing position as it often occurs after a breakout above a cup with handle or other technical pattern.
The 3 weeks tight pattern forms when a stock closes within approximately 1% to 1.5% of the prior week's close for at least two weeks. The reason for the bullishness is that it indciates that investors who moved the stock upward in price since the breakout are not taking profits, the price is holding steady.
The buy point is just above the area of resistance formed at the highs of the three weeks plus 10 cents. The ten cent addition to the price is to ensure a push through the resistance at the high of the range.
Key Points:
It's preferred that closes for each week are in the upper half of the stock's range.
Ideally, volume will increase significantly as the stocks moves past the buy point.
This pattern generally performs best when the market is in an uptrend.
Features:
A configurable horizontal bar that spans the 3 week period.
A vertical band that highlights the tightness pattern.
A label to show the buy price after 3 week tight pattern.
Optional alert when the 3 weeks tight pattern is recognized.

Kviateq - Session Pivots for CryptoPretty much the exact same indicator as my other Session Pivots, however this one also shows the weekends and the session times are set to Bitmex exchange (note: I'm in a GMT+7 timezone myself).
CPR Width + MTF, Offset and BarcolorsDue to the request of some users and inspired by "5 Day ADR ICT Intraday Tracker" I updated "CPR Width" and added extra functionality for your convenience.