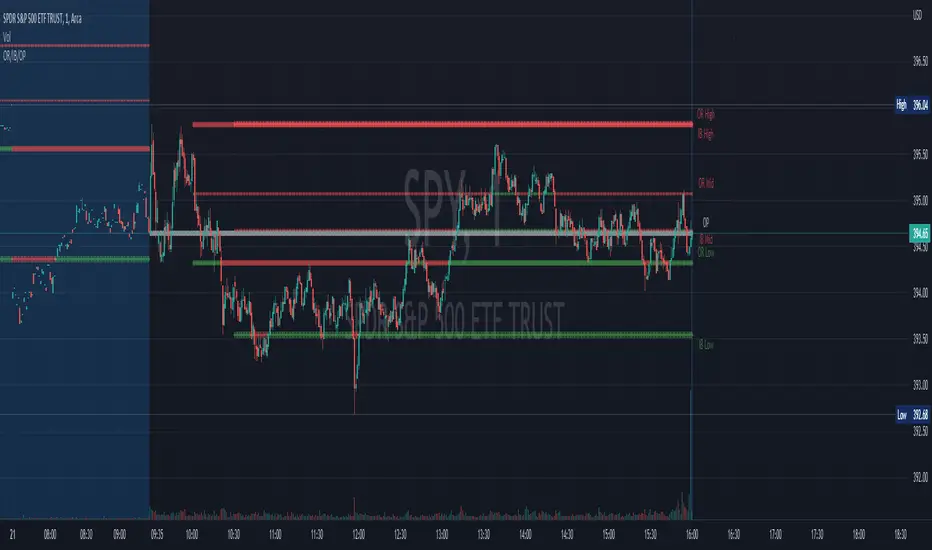
Opening Range, Initial Balance, Opening PriceThis script draws Opening Range, Initial Balance and Opening Price with options to show mid levels.
By default, lines changes color depending on whether closing price is above or below the lines. Red if price is below, green if price is above.
Colors and line styles are all configurable.
Options to change label positions.
Some definitions:
Opening Range - The opening range is high and low for a given period after the market opens. This period is generally the first 30 or 60 minutes of trading
Initial Balance - WRT to TPO profile chart, the Initial Balance is the price range resulting from the market’s trade during the first two 30 minute periods of the regular trading hours session.
Why is this useful?
The first hour of the trading day is the most active and dynamic period. The price range defined by this period of trading creates some key support / resistance levels for the rest of the day. Example below:
Openingrange
Opening Range with Infinite Price TargetsOpening Range with Infinite Price Targets is an ORB indicator that automatically generates price targets into infinity based on a user-defined % of range.
This indicator includes many nice-to-have features missing from other indicators. Such as:
Price Target Labels with Price tooltip, want to know exactly what price pt3 is at? Hover over it and see.
Custom Defined Range time, Set your Range Start and end time to whatever you need, Doesn't have to be pinned to opening range!. Note: Time is in chart time.
Historical View (Default off), Tired of your chart looking messy with a ton of lines from historical data? No problem! You can choose to view or not view historical data.
Alerts for Range Breaks, First Range Breaks, and Discovery Price Target hits. As well as Exported Values for Range High, Low, and Mean to set your own alerts from custom sources.
Custom Price Targets, set your price targets to a % of the range based on your own strategy.
Last but not Least, Infinitely Generating Price Targets. They just keep building. New Targets will be generated when the price closes above/below the current farthest target.
Enjoy!

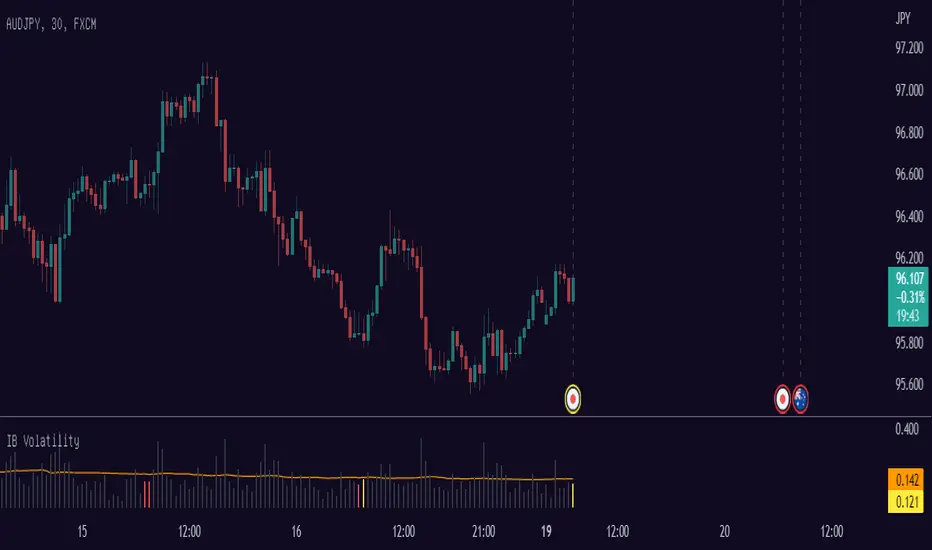
Opening Session High LowThis script shows the change from high price and low price of 1 bar in percent especially when you can highlight the distance from high and low in Sydney/Tokyo/London/Chicago opening.
With this you can quickly get an overview of historical distance from high price and low price.
Works good at 1 period of TPO = 30M
Examples of this script calculated distance of high price and low price when Tokyo Opening:
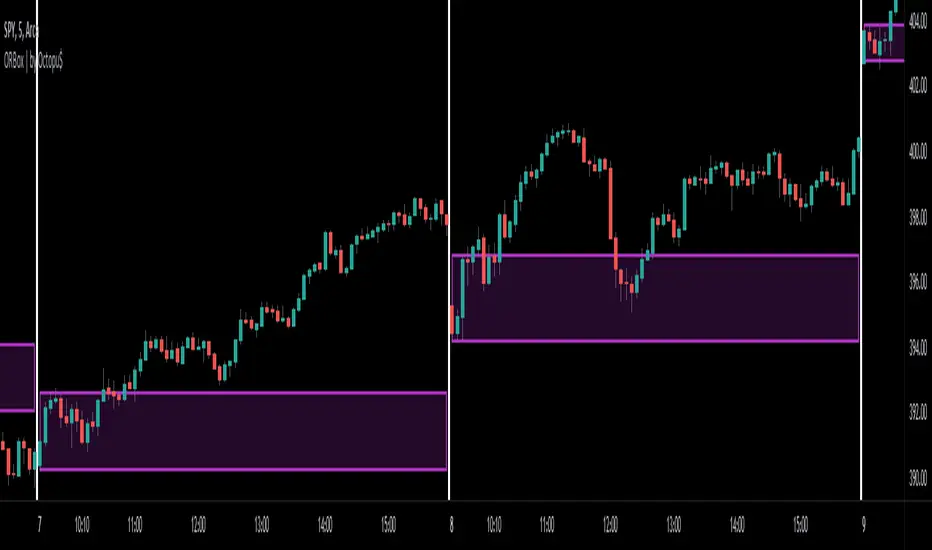
ORBox | by Octopu$📈 ORBox | by Octopu$
ORBox is a Box for the Opening Range Breakout
The Box is added automatically according to the User preferences through GUI
This Indicator includes a Dropdown selection for which Range for the Breakout you want to use
ORBox has built-in Alerts for when the Breakout happens according to your preferences
Works in any Timeframe with any Ticker
(Using SPY 5m just as an example:)
www.tradingview.com
SPY
Features:
• Opening Breakout Range (ORB)
• Dropdown menu selection to choose which TF to watch
• Built-in Alerts for Momentum Awareness
Options:
• Customization for Box Colors and Sizes
• Display ORB for Current Day or Previous
Notes:
v1.0
ORBox Indicator release
Changes and updates can come in the future for additional functionalities or per requests.
Did you like it? Shoot me a message! I'd appreciate if you dropped by to say thanks.
- Octopu$
🐙
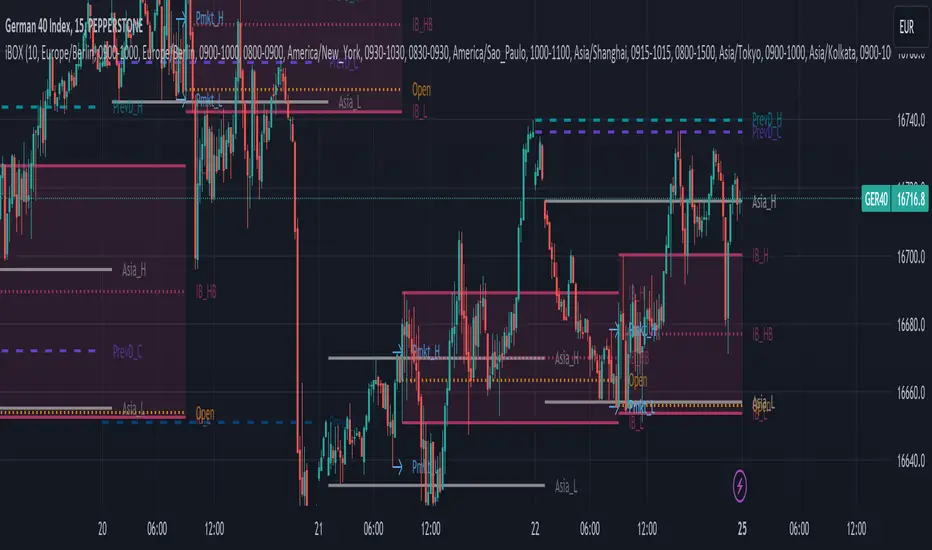
iBox, Initial Balance | IB High, Low, Midpoint | OpeningThis Indicator will print basically 4 lines.
You have to understand the importance of the "Initial Balance" the first trading hour of Cash session is very important in trading stocks and indizes.
So you will get 4 lines:
Opening
Initial Balance High
Initial Balance Low
Initial Balance Midpoint/Halfback
Most indicators for Range Box, Opening Trade, Opening Range, Initial Balance, iBOX and "Ultimate Lines" will only use the timezone of the exchange or your own timezone. I'm living in europe and we have this daylight saving time change in Summer/Winter - which will cause problems with most of the existing indicators or at least will push you to change the times regularly.
Another important point: I really like to switch the indizes when trading on my mobile. So what will happen when you set up opening range for DAX at 09:00 and then switch to S&P500? All indicators I tried failed here - they will just draw a wrong line for SPX, NDX, DJI, FTSE, ASX etc. I fixed that and hard coded stock exchanges and ticker symbols into 3 main groups Initial Balance EU/US/Asia
For example we take DAX - XETRA DAX is opening at 09:00 MEZ (Europe/Berlin)
The Initial Balance is set during the H1 Candle from 09:00 - 09:59
Please be aware, that some cash indizes only deliver data to TradingView after the "opening auction" - so for Xetra DAX you have to book live data and often you will only see data at 09:02/09:03 after the opening auction.
So you will get different opening lines compared from cash to future or your CFD provider. Future and CFD should fit for 99%
The Opening Line will be drawn at exactly 09:00
IB High on the highest price during the H1 candle
IB Low on the lowest price during the H1 candle
IB Halfback is simple: (IB High + IB Low) / 2
The lines will be drawn from cash start until next day and will end 2 minutes before the next cash session will start again. Please make your own experience! Activate the indicator for a CFD or Future switch to M15 and watch the wicks around the 4 lines. Even in the night or the next morning before the next Initial Balance will be set.
For me the lines are valid for around 24 hours and often longer. That's why it's good to have the old lines on the chart too.
To-do:
Yesterday high / low / close / halfback (also for last week and month)
Labels for the lines - sometimes only the colors will confuse you - a simple label should be a benefit (IB_h, IB_l, IB_1/2, 1D_o)
Range Lines for Asia Range and Premarket Range - additionaly a parameter to disable premarket lines when premarket is trading in asia range.
Add Alert condition to get alerts after IB is set
If you have and thoughts, ideas or improvements, please send me an message or leave an comment!
Like i said, the stock exchanges and ticker symbols are hard coded and can be extended for all relevant assets.
Have fun and i really hope this indicator will help improving your trading experience!
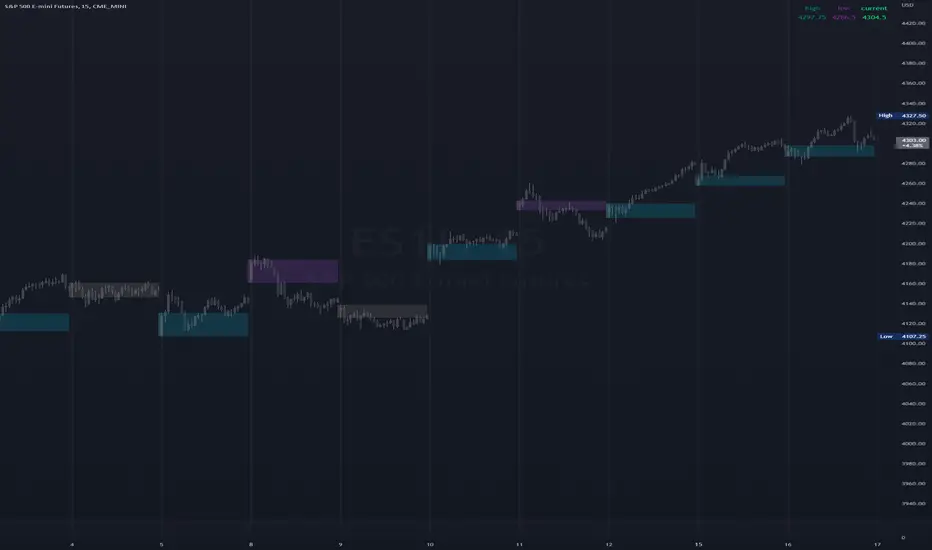
High & Low Of Custom SessionThis script boxes a custom session and sets the box at the high and low of the session and draws that box to the next session.
Box color is determined by price in relation to the box position. Box color is set at the start of the next session. This allows
user to lookback at multiple box sets to see how each day closed in relation to the session highlighted.
I have written this for backtesting purposes and intend to expand it to use with volume analysis and gradient color to change the box color based on how many times price tests
the box.
Pre Market \ Opening Range High LowGreen vertical lines are showing pre market open and then the opening range as the first hour of market NYSE market open
Pre market high and low are blue lines | intraday opening range high low are in white
Trades are taken in the current direction above | below range breaks with the direction of price action using the moving averages
Price breaking through moving averages and a range is the optimal trade to enter - exit at next range for target - stop loss below the lower | higher moving average depending on short or long
A break above or below the intraday high or low and pre market high or low can give massive profits trailing your stop loss as price runs
Using MA 5 and 12 to filter out entries and exits above or below the ranges short or long is also another strategy to implement
BEST TIME FRAME TO USE IS 5 MINUTE

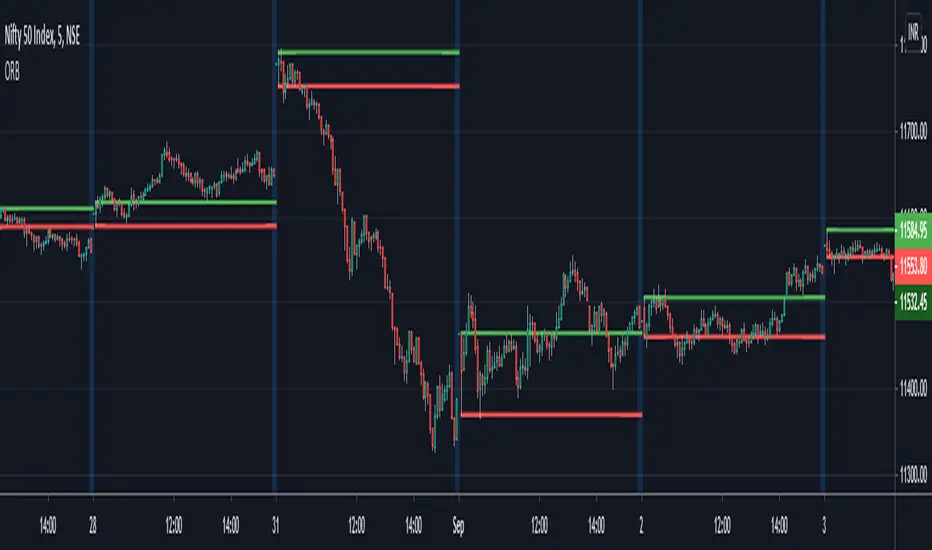
Litt Opening Range BreakoutThe Litt ORB, Opening Range Breakout, is a tool used by many intraday traders to take advantage of short-term momentum. This script plots extensions based on the opening range and then color candles depending on where the closing price of that candle is. The opening range is defined by either the first 30 or 60 minutes of a new trading day. During that time the opening ranges are set. If the opening range time has passed and we start to break above the Opening Range High that is a good indication that a Trend Day to the upside could be forming. When a stock takes out the range high from the first 30 or 60 minutes this is called an Opening Range Breakout.
OR = Opening Range
ORH = Opening Range High
ORL = Opening Range Low
ORM = Opening Range Mid (Half-way between ORH and ORL)
You can see the ORH and ORL (Opening Range) lines on the chart. The other lines are extension lines from the Opening Range. These are used as price targets for the end of Opening Range breakouts.
The candles are colored as follows.
If we are above the ORH then we use Bull Color 1.
If we are below the ORL then we use Bull Color 2.
If we are above the ORM, Opening Range Mid or the halfway point between the ORH and the ORL, we color Bull Color 2.
If we are below the ORM then we color Bear Color 2.
If the current time is still within the Opening Range then we color the Opening Range Color.
OR = Opening Range
ORH = Opening Range High
ORL = Opening Range Low
ORM = Opening Range Mid (Half-way between ORH and ORL)

TPRC - Time-based Price Range Channel [Free]You define a time range (hours and minutes) and based on this, the indicator draws the price range (high / low) as a channel in your chart - projected into the future and, if desired, also for past days. You are completely free to choose the time range and NOT limited to trading sessions.
In addition, further lines are drawn below / above the price range channel at a distance that you can define (based on the price range).
These lines can serve as target levels, support and resistance lines.
What functions does this free version of the indicator offer?
Selection of the time range for which a price range is to be determined and based on this a price range channel is to be created
Display of 3 additional lines above / below the price range channel
Distance between the lines: height of the price range
Display of the price range channels for the past 3 days as well as for the current day.
Lines are shown in gray
For the past days, only those lines are displayed that are required due to the distance to the price. This will make your chart cleaner.
(Details about the premium version can be found on TradingView: )
How can this indicator be used?
The time-based price range channel and the additional lines can serve as support and resistance lines.
Whether you are enthusiastic about scalping, swing trading or another type of trading,… “TPRC - Time-based Price Range Channel” could therefore support you. Try it out. I want to invite you to experiment and thereby adapt “TPRC” to your own way of trading.
Due to the free choice with regard to the time span, for example “opening range (break-out)” strategies and the like are conceivable. Much has been written or published as a video on the subjects of "Price Range Trading", "Range Trading", "Opening Range Breakout Trading" and the like. Research on this is recommended to every interested trader. I would be happy to provide a list of interesting articles on this topic - just send me a short message.
Due to the implementation and the functions, the focus is definitely on intraday trading strategies.
For which timeframe is this indicator intended?
This indicator was developed for Chart Time Intervals between 1 and 120 minutes, whereby the following Chart Time Intervals have proven themselves and successfully withstand tests: 1, 2, 5, 10, 15, 30, 60, 90
What do I need to consider?
It may be advisable to add further indicators and an analysis of the market structure in order to confirm the signals issued by the indicator. Please note that when you make adjustments to any strategy, you always carry out particularly detailed tests.
Will this indicator be further developed and will I receive free updates?
All my indicators are of course constantly updated and, if possible and with the aim of the indicator justifiable, supplemented by user requests.
An example of the use of this indicator (here with the premium version)
#revision: dv699

Opening Range FibonaccisThis indicator uses the concept of the "Opening Range" to create a Fibonacci zone from the high and low set during a specific time period after open (Defaults to 9:30 - 10:05 AM, EST)
The Opening Range is a popular tool for intraday technical analysis. Price frequently uses these levels as support/resistance, and a breakout from within the range can be a sign of further movement.
The Fibonacci levels are set such that the opening range high/low fall on the +/-0.5 fib. This creates an "extended range" outside of the opening range that may be useful during breakouts.

Michigandolf's 30min Opening RangeThis script plots the 30min Opening Range as well as the previous day's high & low.
Description:
Blue Line = Top of the 30min Opening Range for the session
Pink Line = Bottom of the 30min Opening Range for the session
White Line = Mid-Point of the 30min Opening Range for the session
White Transparent Area = The full range of the 30min Opening Range
Green Line = Yesterday's High for the session
Red Line = Yesterday's Low for the session
Use:
The Opening Range will continue to expand until the first 30minutes of trading has passed, at which point the range will lock in place for the remainder of the trading session. Many traders use these important levels to gauge trade entries and exits (e.g. Mark Fisher's ACD strategy).
This script does not work currently work for futures (e.g. ES, NQ, RTY) due to the session start time. Will configure for futures trading in a future update.

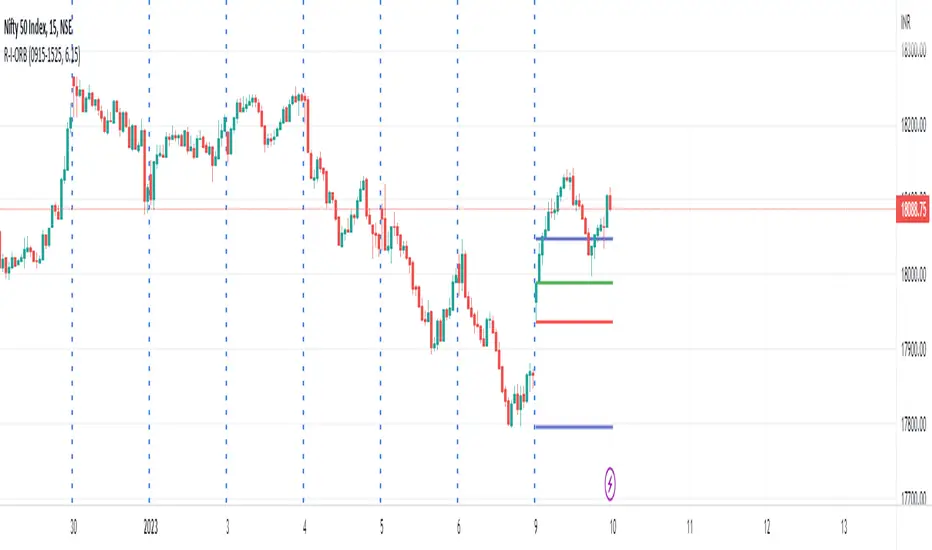
R-I-ORBThis is an intraday indicator which plots high and low of timeframe's first bar.
Top line - High of the first session bar
Bottom line - low of the first session bar
Requires session timing and total trading hours to plot the lines appropriately.
We can use the indicator to trade intraday opening range breakouts.
Thanks!
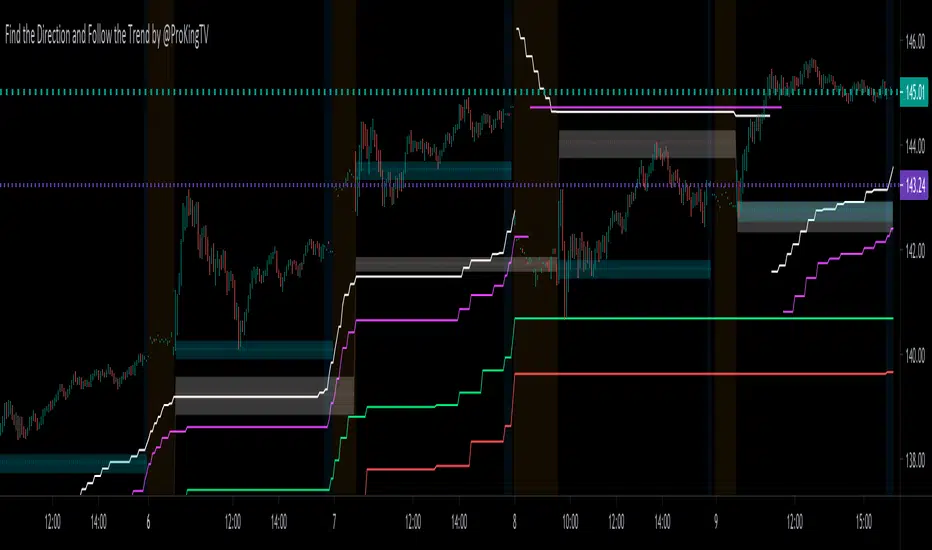
Pro Algo: Find the Direction and Follow the Trend
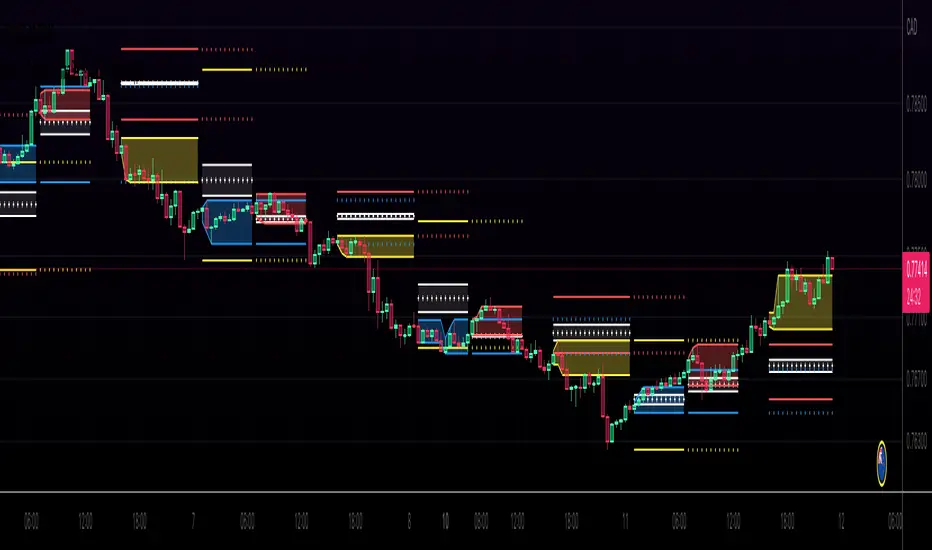
Find direction is the key to success for all traders. This script can find the direction and Opening Range. All you need to do is follow the direction and the trend generated from this script. It can be used for day trading and swing trading on all time frames. It generates short-trend, medium-trend and long-trend lines with no repaint and no lagging. It also generates Support/Resistance (S/R) area for Day-time and 24 hours time-frame.
How does it work?
* Defines all support/resistance (S/R) levels based on floor trader’s pivot points and my own S/R levels.
* Calculates the trend/reversal signals, price reactions close to all above S/R levels.
* Generates short-trend, middle-trend and long-trend line based on all combined factors and directions.
What are the signals?
* Pink line are short-trend line
* Green line are short-trend line
* Red line are short-trend
* Deep green area is S/R Opening Range for day-time, which can be used as Open Range Breakout
*
How to use?
* Find the Opening Range(green area)
* Follow the direction of Pink/Green/Red lines
* Trade in the same direction of opening range breakout and the direction of trend(Pink/Green/Red lines)
* It works on all time-frames from 1 min, 2 min, 3 min to 4 hours chart.
* The trend lines will not change, i.e trend lines will be same for all time frames
* There is no way to filter all noises even with higher time frame, all the trades must have a stop Or Reversal the direction once the trend is changed.
* These trend lines provide excellent support and resistances levels.
How to access?
* PM me (ProKingTV) to obtain access
* 10 days Free Trial is available
CBG Opening Range and Initial BalanceThis is a total re-write of my previous Opening Range indicator. All the same functionality with better code
Features
Opening Range and Initial Balance ranges (30 minutes and 1 hour defaults)
Overnight Range
Daily Open Price
Can select which midpoint: OR or IB
4 separate extensions (up and down) based on either OR or IB
Shaded range area
All lines and shading can be turned on and off in the Style menu
Initial Balance Markets Time ZonesThe below script is based on Initial Balance.
Initial Balance is based on the highest and lowest points of Price Action (PA) within the first 60 minutes of trading. There is so much information available online, reference Initial Balance, that I have not provided a reference.
Most indicators I have seen have been solely based on UTC 0000 Initial Balance. My aim with this indicator was to be able to visualize how other time zones market openings Initial Balance affect PA.
The three market openings I chose to code in are:
London 0800 to 0900
New York 1430 to 1530
Asia 0000 to 0100
Within the script I have given the user the option to select to see with a green or red background when PA is above all zones Initial Balance high (green) or PA is below all zones Initial Balance low (red).
Alerts are also coded in, to prompt the user that PA has gone above or below as per above.
The Initial Balance high and lows also offer another form of areas of confluence.
Below are some examples of IB in action:
LTC
NULS
UNFI
DEXE

Kviateq - Session Pivots for CryptoPretty much the exact same indicator as my other Session Pivots, however this one also shows the weekends and the session times are set to Bitmex exchange (note: I'm in a GMT+7 timezone myself).
[co.n.g] LeathermanThis is a modest approach of assembling my most favorite strategies into a single indicator script!
I extended the functionality of the ART to the maximum in this piece of price action and volume analysis.
The original "Average Range Targets" - though by default turned off t due to heavily re-scaling the chart -
and the previous day's high and low.
What I've added:
high and low of the actual week
high and low of the previous week
open of the day
close of the previous day
VWAP of the daily session - adjustable to any length
VWAP of the weekly session
opening range / inital balance of the session -fixed to 15 Minutes
I've decluttered the chart as good as possible.
KNOWN BUGS:
Sometimes the plotting is incorrect due to rescaling or zooming in and out of the chart.
How to use - a quick price action guide:
The breakout of the open range is often indicating the trend of the day, a false breakout is often seen as a reversal sign.
A price below the VWAP is seen as cheap, a price above as expensive. In contrary to others, I personally prefer to see a rising price on a rising VWAP ;
additionally, I like bounces off or spikes and reversals through the VWAP , either the daily or the weekly.
The highs and lows of the days and weeks are seen as support and resistance . Trade preferably long above and short below those levels.
The ADR is an indication not working perfectly, especially with stocks.
!!! WARNING !!!
Don't rely solely on a single script nor a single indicator!
Always consider the price action, the trend, the overall market and especially the volume.
There is no "Get-Rich-Quick"-scheme, learn to read the chart and trade accordingly.
Enjoy and make money!
Yours,
Constantine
p.s.:
If you like to show your gratitude for my work:
CHEER!

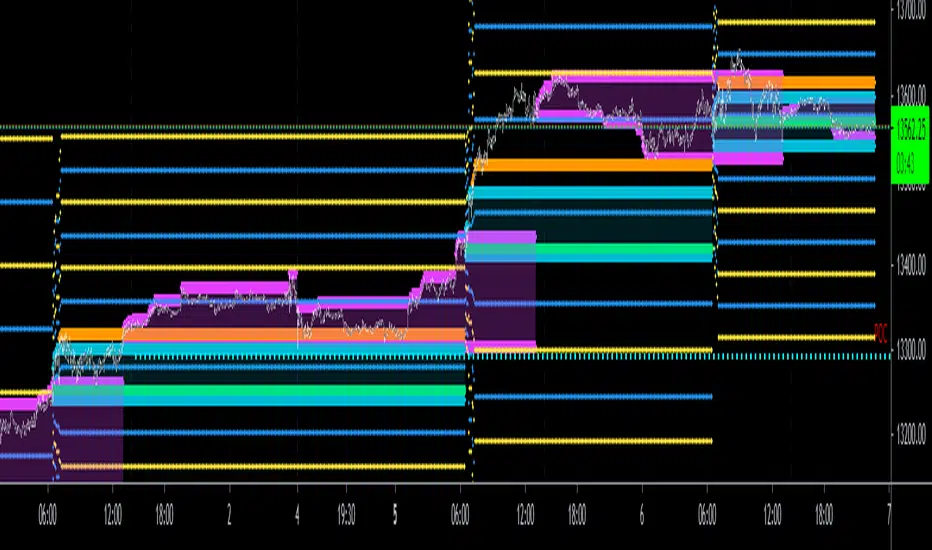
Kviateq - Session PivotsFirst of all, I must say that this script wouldn't be possible without the help of one of the best script developers on TradingView - @ahancock (thanks a bunch for your help)
This script draws opening ranges for each of the sessions - Tokyo, London and New York and plots session high, low and pivot range of the previous session.
So if you trade London session - you would only take longs if we're above the Tokyo pivot range and vice versa for shorts.
Often times previous session's highs act as resistance and lows act as support, so careful trading around those levels.
It is obviously meant for lower timeframes, since each of the sessions only lasts a few hours.
Default settings are set to the exchange that I use and my timezone (GMT +7), so you might need to adjust the settings accordingly.
Tokyo - 12am GMT
London - 7am GMT
New York - 12pm GMT

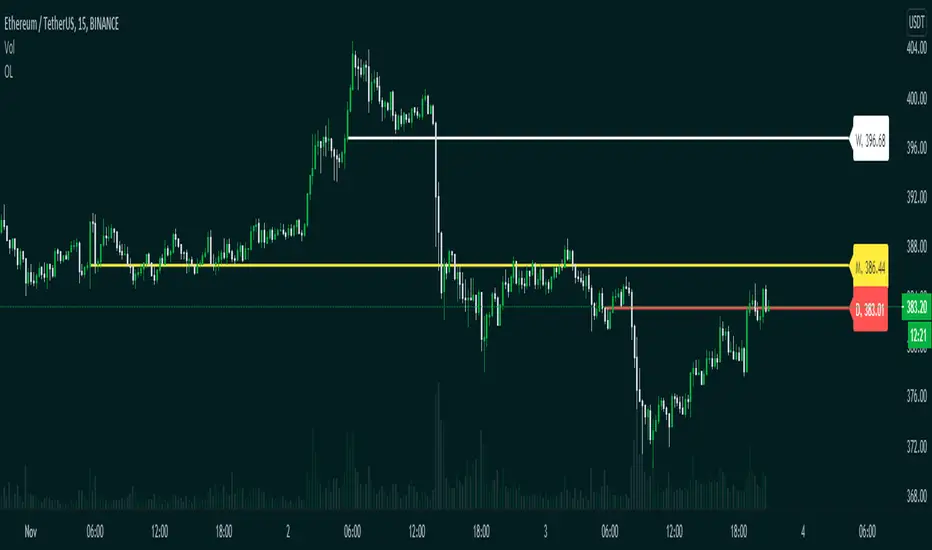
Opening LevelsOpening Levels is an indicator to draw lines on the opening prices of the current day, week, and month.
Inputs:
1. Line Width :- Opening Levels Line width, from 1 to 10
2. Right Offset :- Right offset from current bar, from 0 to 50
3. Line Style :- Select line styles from
4. Show Label :- Show or hide price labels
5. Day Level Color :- Current day opening level color
6. Week Level Color :- Current week opening level color
7. Month Level Color :- Current month opening level color
8. Day Label Text Color :- Current day label text color
9. Week Label Text Color :- Current Week label text color
10. Month Label Text Color :- Current month label text color
Happy trading.
London Open Range Breakout by KviateqThis script is what I currently use to day trade forex on a 5-minute timeframe.
The script features Multi-timeframe EMA20 that uses timeframe multipliers and is smoother by the factor by which you're multiplying your current timeframe.
Default settings are set to display EMA20 on the current (M5) timeframe, as well as M15, H1, H4 and D1 timeframes.
The background color changes intensity based on how many conditions are met - are all EMAs in the right order, is the current close above/below all the EMAs.
Featured is also a range set to 1 hour since the London breakout (can be changed to M15, or however long you'd like - my current setting is 30 minute).
Also featured are levels that I find to be of most importance - such as Daily and Weekly Open, Previous Day's and Week's Highs.
The idea is to only take trades when all stars align - EMAs, break above/below the Opening Range and not to long/short into an important level.

ORB - Opening Range BreakoutThis script plots the high/low of any custom session and extends it until the daily close. It does not show on the timeframe higher than the length of custom opening session by default.
The time period of opening range & the max timeframe to display it on can be adjusted from the settings.
So for eg. if want to use 5m ORB to trade, then set "ORB total time" as 5min & "Session Time" as whatever is the opening 5mins time period of ticker that are trading.
NSDT ES USA Open TargetsThis indicator provides potential entries and targets (both long and short) for the ES/MES USA session. It creates potential target lines on the chart as well as a gray box with the potential levels in text format. Both options can be turned on or off at the discretion of the trader. You may need to adjust the chart width so the box shows on the screen. It's position is adjustable.
The lines and the text box are updated after the first 1 MINUTE bar closes for USA session. The USA session open is defined as 9:30AM - 9:31AM, Eastern time.
Place the chart on a 1 MIN time interval for best results. You can change the chart timeframe after the 1st min bar closes and the data is updated.
To get access to this indicator, use the link in the profile signature or private message us here in Tradingview.

NSDT NQ USA Open TargetsThis indicator provides potential entries and targets (both long and short) for the NQ/MNQ USA session. It creates potential target lines on the chart as well as a gray box with the potential levels in text format. Both options can be turned on or off at the discretion of the trader. You may need to adjust the chart width so the box shows on the screen. It's position is adjustable.
The lines and the text box are updated after the first 1 MINUTE bar closes for USA session. The USA session open is defined as 9:30AM - 9:31AM, Eastern time.
Place the chart on a 1 MIN time interval for best results. You can change the chart timeframe after the 1st min bar closes and the data is updated.
To get access to this indicator, use the link in the profile signature or private message us here in Tradingview.
