MTF Triple Kagi Indicator v1.0Introduction
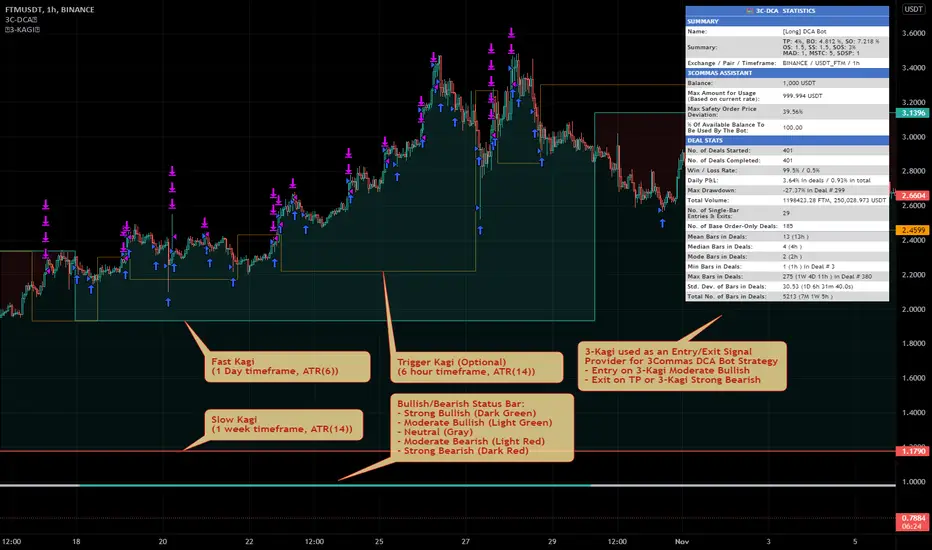
The indicator attempts to implement three (3) time-based, multi-timeframe, non-repainting Kagi lines as an overlay to your chart and applying a trend bullish/bearish trend strength evaluation based on the position of the Kagi close prices between the Fast Kagi and Slow Kagi.
How is it original and useful?
This indicator is unique in that it combines a Fast and Slow Kagi timeframes and applies the following trend analysis to determine bullish/bearish strength:
Strong Bullish = when both Fast and Slow Kagi are below the current price and Slow is less than or equal to Fast Kagi.
Moderate Bullish = when both Fast and Slow Kagi are below the current price and Slow is greater than Fast Kagi.
Neutral = when current price is between the Fast and Slow Kagi.
Moderate Bearish = when both Fast and Slow Kagi are above the current price and Slow is less than Fast Kagi.
Strong Bearish = when both Fast and Slow Kagi are above the current price and Slow greater than or equal to Fast Kagi.
In addition, the indicator adds a Trigger Kagi that you can optionally use as a faster Kagi to see more confirmation of trend within the Fast/Slow Kagi combination. It is not used in the bullish/bearish comparison analysis but is simply informative in confirming the trend with a smaller timeframe than the Fast Kagi.
How does it compare to other scripts in the Public Library?
This indicator makes use of the security() function and applies the best-practices as provided by the PineCoders' script called `security()` revisited so that the indicator will not repaint when you refresh the chart or re-open it at a later date. In addition, at the time of initial publishing, this indicator is the only publicly available indicator that combines multiple time-based Kagi lines to offer a simple trend analysis status for short-term or long-term traders.
What does it do and how does it do it?
When applied to the chart for the first time, the default settings will work to produce Kagi lines from the beginning of the chart history up to the real-time bar. All three Kagi lines will default to the current chart's timeframe, therefore it is expected that you open the settings and adjust the Fast and Slow Kagi settings to provide the full effects of the indicator's features. The example chart above is using a 1-Hour chart with a Fast Kagi of 1 day (ATR(6)), a Slow Kagi of 1-Week (ATR(6)) and a Trigger Kagi of 6-Hours (ATR(14)). These settings are not universal for all markets; thus, it will require trial and error adjustments to tune the indicator to the specific market you are evaluating.
Lastly, the example chart above is illustrating how this indicator could be used with the 3Commas DCA Bot Strategy to provide entry and exit signals to simulate a bot's performance using the powerful Strategy Tester within TradingView to further evaluate the indicators influence on hypothetical trading conditions. The indicator provides a plot data point called "Kagi Bullish/Bearish Signal" that can be used in other chart strategies as a signal provider. The following is the meaning of the numeric signal value for this data point:
Strong Bullish = 2
Moderate Bullish = 1
Neutral = 0
Moderate Bearish = -1
Strong Bearish = -2
Enjoy! 😊👍
Multi-timeframe
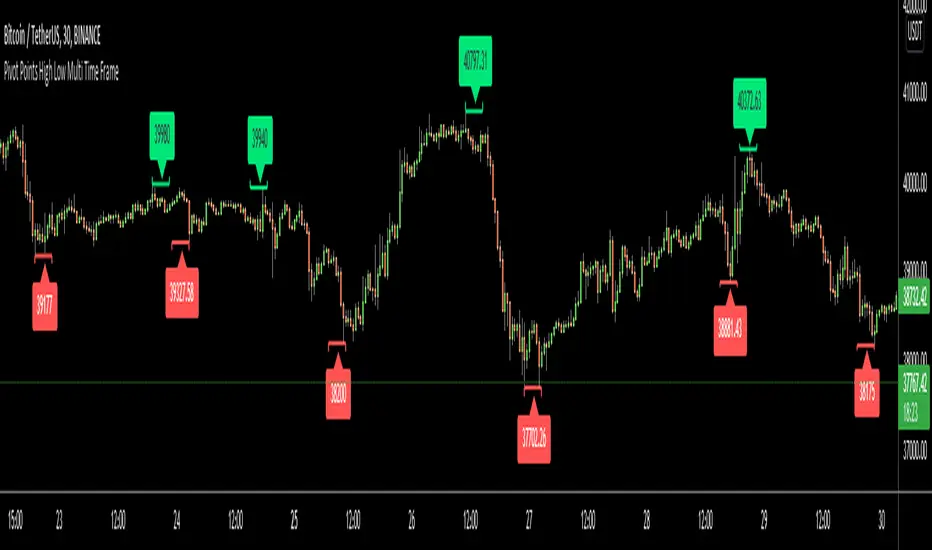
Pivot Points High Low Multi Time FrameHello All,
There are built-in and published Pivot Point High Low indicators in Public Library but as far as I see none of them is for Higher Time frames. so I decided to write & publish this script. I hope it would be useful while trading or developing your own scripts. I also did this to use in one of my future projects (we will see it in a few weeks/months ;) ).
I tried to make all settings optional, so you can play with them as you wish.
P.S. There is no control mechanism if the chart time frame is lower than the time frame in the options. So you better set higher time frame in the options than the chart time frame.
Enjoy!
MTF RSI & STOCH Strategy by kziThis script is a teaml job with Indicator-Johns.
First he used my script, then i transform his code.
The origine:
The first transformation:
www.tradingview.com
Funny moment together, thanks for that. :)
This sharing is an indicator where you can see the average of different time frames.
The RSI is the blue line
The Stock is the yellow line
You can manage the timeframe in the parameters.
The strategy is to take position when the two lines get overbought or oversold and close when the stoch and RSI goes to the middle.

MTF Kagi Indicator v1.0Introduction
The indicator attempts to implement a time-based, multi-timeframe, non-repainting Kagi lines as an overlay to your chart using traditional candlesticks.
How is it original and useful?
This indicator is unique in that it allows you to choose from among three different methods to define the reversal amount. They are:
ATR (Average True Range): After each Kagi line is drawn, the latest ATR value from the selected timeframe will be used until a new vertical Kagi line is drawn. At this point, the latest ATR value will be used for the reversal amount until it changes again. This means that the reversal amount will adjust as price action volatility changes.
Fixed Amount: This method will be useful if you desire to fix the reversal amount, like the normal Kagi Chart. Thus, use this option if you desire to mimic the same Kagi Chart on TradingView.
Percent of Price: This method, like the ATR, will produce the reversal amount using the latest close price against the given percentage value.
In addition, the indicator will allow you to define the Up and Down line colors and width. You can even elect to have a Kagi line drawn on the real-time bar or not.
How does it compare to other scripts in the Public Library?
This indicator makes use of the security() function and applies the best-practices as provided by the PineCoders' script called " `security()` revisited " so that the indicator will not repaint when you refresh the chart or re-open it at a later date. In addition, the indicator provides three possible alerts for Alert Conditions or Any Alert() Function Call. They are:
"Break Shoulder" - this alert will trigger (Once Per Bar) when the close price crosses above the shoulder (higher) of the previous Kagi line.
"Break Waist" - this alert will trigger (Once Per Bar) when the close price crosses below the waist (lower) of the previous Kagi line.
"New Kagi Line" - this alert will trigger (Once Per Bar) when the indicator draws a new vertical Kagi line and continues to monitor the next trend change.
When using the "Any alert() function call" option in creating alerts, the following placeholders are supported in the alert message: {{shoulder_price}}, {{waist_price}}, and {{kagi_close_price}}
What does it do and how does it do it?
When applied to the chart for the first time, the default settings will work to produce Kagi lines from the beginning of the chart history up to the real-time bar. The Kagi line width will have a width of 1 pixel and the colors will match the normal color schemes that TradingView charts have for rising and falling colors. The reversal method will default to ATR with a period length of 14 so that it can provide a visually appealing Kagi lines where the reversal amount will be adaptive for all price charts. The default timeframe will be the chart's timeframe, but it can be changed to any higher timeframe. Using a timeframe that is lower than the current chart will not disable the indicator, but the lines will not be accurate since lower timeframe prices are being grouped to fit the current timeframe.
Enjoy! 😊👍

DiNapoli Oscillator Predictor TableThis indicator displays a table containing the Oscillator Predictor Overbought (OB) and Oversold Levels (OS) from Higher Timeframes: a green background denotes a market above OB in that particular timeframe, and a red one denotes an OS market.
It allows displaying current and future Predictor values.
Only Higher Timeframes states do appear in the table. Lower Timeframes are grayed out, due to inability to get reliable results for such behaviour in current Tradingview environment.
The position of the table can be customized through the input panel.
Note: This indicator is quite demanding in terms of resources, and it might take some seconds to fully populate the table.

super SSL [ALZ]This script is designed and optimized for MULTI TIME
by Ali Zebardast (ALZ)
1.in part of ssl
Original Version credits to Mihkel00
Actual Version i just set alerts and change the parameters for BTCUSDT 1min Chart.
He designed for daily time. I tried to optimize 1 min time-frame .
And fix the errors with OTT
"This script has a SSL / Baseline (you can choose between the SSL or MA), a secondary SSL for continiuation trades and a third SSL for exit trades.
Alerts added for Baseline entries, SSL2 continuations, Exits.
Baseline has a Keltner Channel setting for "in zone" Gray Candles
Added "Candle Size > 1 ATR" Diamonds from my old script with the criteria of being within Baseline ATR range."
2.in part of Range
two Filter Buy and Sell for 3min
Wait For Bar close
ssl2 :Be under the candle for buy
and The bar color must confirm the order of purchase (Blue)
3.in part of OTT
when candles close over HOTT, means an UPTREND SIGNAL
and to Fuchia when candles begin closing under LOTT line to indicate a DOWNTREND SIGNAL.
FLAT ZONE is highlighted also to have the maximum concentration on sideways market conditions.
There are three quantitative parameters in this indicator:
The first parameter in the OTT indicator set by the two parameters is the period/length.
OTT lines will be much sensitive to trend movements if it is smaller.
And vice versa, will be less sensitive when it is longer.
As the period increases it will become less sensitive to little trends and price actions.
In this way, your choice of period, will be closely related to which of the sort of trends you are interested in.
The OTT percent parameter in OTT is an optimization coefficient. Just like in the period
small values are better at capturing short term fluctuations, while large values
will be more suitable for long-term trends.
The final adjustable quantitative parameter is HIGHEST and LOWEST length which is the source of calculations.
Credits go to:
SSL Hybrid www.tradingview.com
HIGH and LOW OTT : www.tradingview.com
Range Filter www.tradingview.com

DiNapoli MACD Predictor TableThis indicator displays a table containing the MACD Predictor states from Higher Timeframes: a green background denotes a bullish predictor in that particular timeframe, and a red one denotes a bearish predictor.
Only Higher Timeframes states do appear in the table. Lower Timeframes are grayed out, due to inability to get reliable results for such behaviour in current Tradingview environment.
The position of the table can be customized through the input panel.
Note: The indicator is resource hungry, and sometimes it might need some seconds to fully populate the table.

MTF Ichimoku Analysis[tanayroy]Ichimoku can state market conditions better than any indicator or group of indicators(My own perspective). Ichimoku works seamlessly in different timeframes. Analysis of Ichimoku in different timeframes can give you the bigger picture of the market.
This indicator analyzes six different timeframes with Ichimoku in depth. Default timeframes are 5M, 30M, 60M, D, W, and M. You can change the default timeframes from the setting.
As we are dealing with many relations, we can define the relationship with a simple score to get the trend strength.
Ichimoku Analysis:
Relationship of Price(P) with Ichimoku indicators: Here we are analyzing the current price and Ichimoku indicators. The position of price with respect to Ichimoku indicators states the market condition clearly.
Price(P) and Kumo(C): P > C = Bullish (↑). P < C = Bearish (↓). P <> C = consolidation or no trend(↔). Score: ±2
Price(P) and Tenkan Sen(T): P >= T = Bullish (↑). P < T = Bearish (↓). Score: ±0.5
Price(P) and Kijun Sen(K): P >= K = Bullish (↑). P < T = Bearish (↓). Score: ±0.5
Price(26 bars ago) and Chiku(L): L >= P(26) = Bullish (↑). L < P(26) = Bearish (↓). Score: ±0.5
Tenkan Sen and Kijun Sen Relation. Tenkan Sen depicts short-term trends and Kijun depicts mid-term trends. So this relationship is important for analyzing the current trend of the market.
Tenkan Sen(T) and Kijun Sen(K): T >= K = Bullish (↑). T < K = Bearish (↓). Score: ±2
Direction of Ichimoku indicators.
The direction of Ichimoku indicators helps us to understand the trend strength.
Tenkan Sen's(T) direction: Upward slope = Bullish (↑). Downward slope = Bearish (↓). Flat=consolidation or no trend(↔). Score: ±0.5
Kijun Sen's(K) direction: Upward slope = Bullish (↑). Downward slope = Bearish (↓). Flat=consolidation or no trend(↔). Score: ±0.5
Senkou A(A) direction: Upward slope = Bullish (↑). Downward slope = Bearish (↓). Flat=consolidation or no trend(↔). Score: ±0.5
Senkou B(A) direction: Upward slope = Bullish (↑). Downward slope = Bearish (↓). Flat=consolidation or no trend(↔). Score: ±0.5
Cloud and other Ichimoku indicators:
Kumo or Cloud is very important in the Ichimoku system. Analyzing its relation with other indicators is important to detect the overall market condition.
Kumo(C) and Tenkan Sen(T): T >= C = Bullish (↑). T < C = Bearish (↓). T <> C = consolidation or no trend(↔). Score: ±0.5
Kumo(C) and Kijun Sen(K): K >= C = Bullish (↑). K < C = Bearish (↓). K <> C = consolidation or no trend(↔). Score: ±0.5
Kumo(C) and Chiku(L): L >= C = Bullish (↑). L < C = Bearish (↓). L <> C = consolidation or no trend(↔). Score: ±0.5
Kumo(C) Shadow: By analyzing the last 252 bars(you can change this option) we are analyzing the Kumo shadow behind the current price. If Kumo shadow is present behind the price, trend strength will be weakened. Score: ±0.5
Kumo(C) Future (Senkou A(A) and Senkou B(B)): A >= B = Bullish (↑). A < B = Bearish (↓). Score: ±0.5
Chiku(L) Analysis:
Vertical and Horizontal Chiku analysis will tell us about the possible consolidation of the price.
Chiku Vertical: if the price consolidates for the next 5 bars(You can change this option) will it run into the price. Please remember we are placing the current price 26 bars ago and we are interested to see the current price in open space for a clear trend. Score: ±0.5
Chikou Horizontal: If Chiku is in open space (Not running into the price), we want to review Chiku vertically i.e how much percentage of fall or rise of the current price can cause Chiku to run into the price.
So, the maximum trend score is ±10.5.
Ichimoku signals:
We know, that the crossover of Ichimoku indicators provides important signals. In this section, you can see all the crossover i.e when they happened (Bars ago)
Distance between price and Tenkan Sen and Kijun Sen: We know, the price come back to Tenkan/Kijun if it goes far away from Tenkan/Kijun. So it is important to note the distance between Tenkan and Price.
Please note that this indicator is not a strategy or buy/sell signal. It just shows you the picture of Ichimoku in multiple timeframes. I am working on some strategies of Ichimoku and will publish the same when my research is complete.
If you want to analyze Ichimoku in a single timeframe, please review the following indicator.
To maintain the table size you can use the shorthand notation from the setting.
Table with detailed analysis:
Table with shorthand notation:
Please comment if you want any clarification or found any bugs to report.

Dash System with RSI/MFI/Stoch MTFHere I am providing you Improved single system to get all components to take better and smarter trading decisions and improve your trading with
a) Dashboard - to gauge market sentiment across all TF.
b) VWAP – to get idea about trend and fair value of market.
c) BB – to get idea about volatility and contraction/expansion in price.
1.Gauge Sentiment across timeframe for various indicators in single dashboard.
RSI - to get the idea about relative price strength across all TFs.
MFI- gives idea whether trend is supported by volume or not across all TFs.
STOCH – IT is a range bound momentum oscillator. It is designed to display the location of the close compared to the high/low range over a user defined number of periods. You can use STOCH for Identifying overbought and oversold levels and also for identifying bull and bear set ups or signals across all TFs.
with this dashboard , you will get complete sentiment of market on your screen whether you use lower to upper TF or upper to lower TF approach. you can see market behavior and sentiment with these all in one dashboard across all TFs.
2.Dashboard better be used with MA or vwap to get trend direction and just for that this system has
a) VWAP- a technical analysis tool used to measure the average price weighted by volume . It's similar to a moving average in that when price is above VWAP , prices are rising and when price is below VWAP , prices are falling. VWAP is primarily used by technical analysts to identify market trend.
b) Bollinger Band - This is an oscillator meaning that it operates between or within a set range of numbers or parameters. the standard parameters for Bollinger Bands are a 20 day period with standard deviations 2 steps away from price above and below the SMA line. Essentially Bollinger Bands are a way to measure and visualize volatility . As volatility increases, the wider the bands become. Likewise, as volatility decreases, the gap between bands narrows.
Volatility can generally be seen as a cycle. Typically periods of time with low volatility and steady or sideways prices (known as contraction) are followed by period of expansion. Expansion is a period of time characterized by high volatility and moving prices. Periods of expansion are then generally followed by periods of contraction. It is a cycle in which traders can be better prepared to navigate by using Bollinger Bands because of the indicators ability to monitor ever changing volatility .
Read more about it on Bollinger Bands (BB).
And as a bonus added ability for BB to use SMA or EMA line as basis as per your comfort.
2. Added feature to change location of dashboard on chart, now you can place it on top left, top right, bottom left, bottom right corner of chart as per your comfort.
3. ability to hide/show for all TFs.
Now you can on/off 5min, 15 min, 30 min, 60 min, 4 hour, daily ,weekly and monthly TF column if you do not use it. you can keep and work with TFs as per your comfort and liking.
4. Added feature to hide/show indicators, MFI , Stoch , VWAP and BB Bands
Now you can on/off indicator s MFI , Stoch , VWAP and BB bands if you don't need them on dashboard as per your need.
Hope IT helps to take better trading decisions and improve your trading experience.

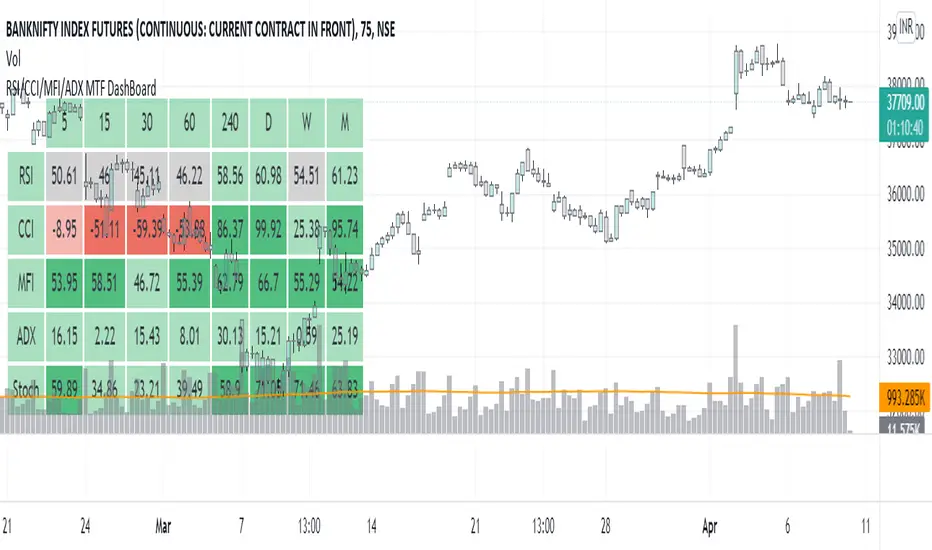
RSI/CCI/MFI/ADX/Stoch MTF DashBoardGauge Sentiment across timeframe for various indicators in single dashboard.
RSI - to get the idea about relative price strength across all TFs.
CCI /ADX- to get idea about power and strength in trend across all TFs.
MFI- gives idea whether trend is supported by volume or not across all TFs.
with this dashboard , you will get complete sentiment of market on your screen whether you use lower to upper TF or upper to lower TF approach. you can see market behavior and sentiment with these all in one dashboard across all TFs.
Better use this with MA or vwap to get trend direction.
Added feature to change location of dashboard on chart, now you can place it on top left, top right, bottom left, bottom right corner of chart as per your comfort.
2. Added ability to hide/show for all TFs.
Now you can on/off , 5min, 15 min, 30 min, 60 min, 4 hour, daily ,weekly and monthly TF column if you do not use it. you can keep and work with TFs as per your comfort and liking.
3. Added feature to hide/show indicators, MFI, CCI, ADX.
Now you can on/off indicator s MFI, CCI and ADX if you don't need them on dashboard as per your need.
Made dashboard cell width and height auto adjusted, so that it values can be visible fully on TV app on mobile too.
Hope it provides a better visual experience to read data on dashboard.
4. Added Stochastic as indicator to dashboard. STOCH is a range bound momentum oscillator. It is designed to display the location of the close compared to the high/low range over a user defined number of periods. You can use STOCH for Identifying overbought and oversold levels and also for identifying bull and bear set ups or signals across all TFs.
Hope IT helps to take better trading decisions.
SuperJump QQE MOD MTFThis is a QQE MOD MTF version.
Mihkel00 modified Glaz's script, I modified Mihkel00 's script again.
This is a QQE Mod original version by Mihkel00 :
I simply changed the above script to update pine script 5.0 and extracted two functions.
Thank you to the two authors for sharing such a great script.

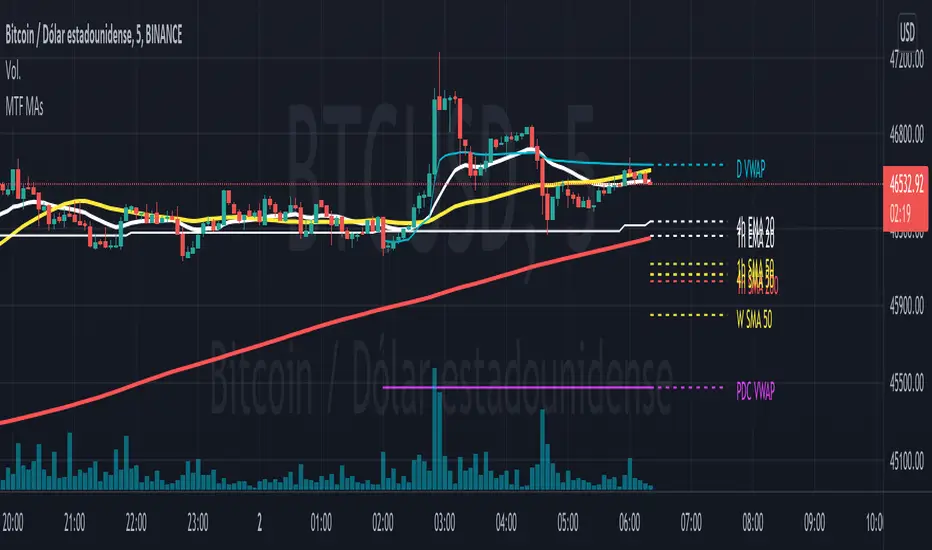
Multi Timeframe Moving AveragesI made this script to keep an eye on most important timeframes (1h, 4h, D, W, M)) moving averages while watching another timeframe. You can select what Ma's you want to be shown for each timeframe and some options to help your analysis (show history, show prices on mouse over label, etc...)
It includes 3 MA's:
- Fast (EMA)
- Middle (SMA)
- Slow (SMA)
You can configure length, source and color for each one.
Also includes a daily VWAP and an option to show the previous day close.
This script includes code from user Frien_dd-DisDev. I am very grateful to him
Thank you for interest.
Pablo.
ATR Report & Tool█ OVERVIEW
This indicator reports the historical probabilities of the price trading past its Average True Range (ATR).
█ CONCEPTS
It is common knowledge that the market is not likely to trade past 1x ATR. Is this true? How much unlikely exactly? The indicator reports the data in a table and tells you precisely how often the price made it past x times ATR.
You have identified two plausible entries at different price structures or two targets at significant projections; which one should you choose? While is it possible to reach them, is this indeed probable? The indicator complements your analysis for making sounds trading decisions.
█ FEATURES
Price Selection Tool
The indicator has a price selection tool embedded. You can select a price on the chart and it will show the distance relative to the ATR so you can easily refer to the historical probability table.
Multi-Timeframe
By default, the indicator uses the daily timeframe for analyzing how much price moves compared to its average volatility during a day. To the same extent, you can set it to any other timeframe.
Configurable ATR
• Pick your preferred smoothing between the Simple Moving Average (SMA) or the Relative Moving Average (RMA).
• Set the length for getting the average price movement. For example, you can set it to 20 for the daily ATR (20 trading days in a month), 12 for the weekly ATR (3 months), or 6 for the monthly ATR.
• Select the reference between “previous” or “current” ATR value (default set on previous).
Data Window
The indicator provides additional volatility-related values and reporting data.
Others
Automatically hides the indicator when the chart’s timeframe is higher than the indicator’s one.
█ NOTES
Calculation
The volatility is calculated from the selected period's low to high. It may use the previous close when the market gaps up/down.

Multi-Timeframe ATR Levels█ OVERVIEW
This indicator plots the upside and downside ATR levels popularized by Trader Dante.
█ CONCEPTS
Beyond a level's boundary, a market is trading over its average volatility. The indicator adds confirmation to "reversal" setups located at likely mean reversion. Oppositely, it highlights trades with an increased risk where the price is over-extended and when the market is possibly exhausted.
Inside the levels’ boundaries, a market is trading within its average range. The indicator adds confluence to your target selection. Indeed, a target set at or nearby a level is at reasonable reach for the selected period. In addition, it can improve your stop placement. Tucking your stop-loss outside the boundary of a level adds an extra assurance that your stop is beyond reach.
█ FEATURES
Multi-Timeframe
By default, the indicator sets the timeframe to the daily for tracking how much price moves compared to its average volatility during a day. To the same extent, you can set it to any other timeframe. For example, you can use the weekly or the monthly timeframe for adjusting your trading during the week or when approaching the end of the month.
Configurable ATR
• Pick your preferred smoothing between the Simple Moving Average (SMA) or the Relative Moving Average (RMA). The SMA is used in the original MT4 indicator, and the RMA is the default in TradingView.
• Set the length for getting the average price movement. For example, you can set it to 20 for the daily ATR (20 trading days in a month), 12 for the weekly ATR (3 months), or 6 for the monthly ATR. Also, you may set a shorter length when you want to emphasize the recent price volatility.
• Apply a custom multiplier on the ATR when you want to focus on a particular price movement.
• Select the reference between “previous” or “current” ATR value (default set on previous).
Customizable Labels
• Personalize what info to show in the labels located on the right side of the levels. You can compose the data for showing the price, the ATR, both the price and the ATR or none.
• On hovering a label, a smart tooltip displays the complementary data. The less info a label displays, the more its tooltip shows.
• Choose how to display the values. In addition to the labels, the indicator can display the last values on the price scale, the status line, and the data window.
Enhanced Coloring
At a glance, see which level the price is approaching with the "Cold & Warm" coloring or quickly glimpse when the price has reached or exceeded the ATR with the "Overflow" coloring.
Others
• Automatically hides levels when the chart’s timeframe is higher than the indicator’s one.
• Alerts setting.
█ NOTES
Calculation
Upper band = low* + ATR
Lower band = high* - ATR
*The previous close is used when a gap up/down occurs.
This is a PREMIUM indicator. I also have a free version of the Daily ATR Levels .

Higher Timeframe Candle OverlayHi all, this script helps you to see candle of any timeframe at the same time. It is possible to find the regions of dying trend by peeking into the higher timeframe candles. For example, on a 1-min chart, a 1439 min ( (24*60) - 1 ) candle is a day candle refernce to that 1-min. If huge bodied candles starts to grow larger wicks and smaller bodies, it means that the trend is dying.
Multi-Timeframe (MTF) Dashboard by RiTzMulti-Timeframe Dashboard
Shows values of different Indiactors on Multiple-Timeframes for the selected script/symbol
VWAP : if LTP is trading above VWAP then Bullish else if LTP is trading below VWAP then Bearish.
ST(21,1) : if LTP is trading above Supertrend (21,1) then Bullish , else if LTP is trading below Supertrend (21,1) then Bearish.
ST(14,2) : if LTP is trading above Supertrend (14,2) then Bullish , else if LTP is trading below Supertrend (14,2) then Bearish.
ST(10,3) : if LTP is trading above Supertrend (10,3) then Bullish , else if LTP is trading below Supertrend (10,3) then Bearish.
RSI(14) : Shows value of RSI (14) for the current timeframe.
ADX : if ADX is > 75 and DI+ > DI- then "Bullish ++".
if ADX is < 75 but >50 and DI+ > DI- then "Bullish +".
if ADX is < 50 but > 25 and DI+ > DI- then "Bullish".
if ADX is above 75 and DI- > DI+ then "Bearish ++".
if ADX is < 75 but > 50 and DI- > DI+ then "Bearish+".
if ADX is < 50 but > 25 and DI- > DI+ then "Bearish".
if ADX is < 25 then "Neutral".
MACD : if MACD line is above Signal Line then "Bullish", else if MACD line is below Signal Line then "Bearish".
PH-PL : "< PH > PL" means LTP is trading between Previous Timeframes High(PH) & Previous Timeframes Low(PL) which indicates Rangebound-ness.
"> PH" means LTP is trading above Previous Timeframes High(PH) which indicates Bullish-ness.
"< PL" means LTP is trading below Previous Timeframes Low(PL) which indicates Bearish-ness.
Alligator : If Lips > Teeth > Jaw then Bullish.
If Lips < Teeth < Jaw then Bearish.
If Lips > Teeth and Teeth < Jaw then Neutral/Sleeping.
If Lips < Teeth and Teeth > Jaw then Neutral/Sleeping.
Settings :
Style settings :-
Dashboard Location: Location of the dashboard on the chart
Dashboard Size: Size of the dashboard on the chart
Bullish Cell Color: Select the color of cell whose value is showing Bullish-ness.
Bearish Cell Color: Select the color of cell whose value is showing Bearish-ness.
Neutral Cell Color: Select the color of cell whose value is showing Rangebound-ness.
Cell Transparency: Select Transparency of cell.
Column Settings :-
You can select which Indicators values should be displayed/hidden.
Timeframe Settings :-
You can select which timeframes values should be displayed/hidden.
Note :- I'm not a pro Developer/Coder , so if there are any mistakes or any suggestions for improvements in the code then do let me know!
Note :- Use in Live market , might show wrong values for timeframes other than current timeframe in closed market!!

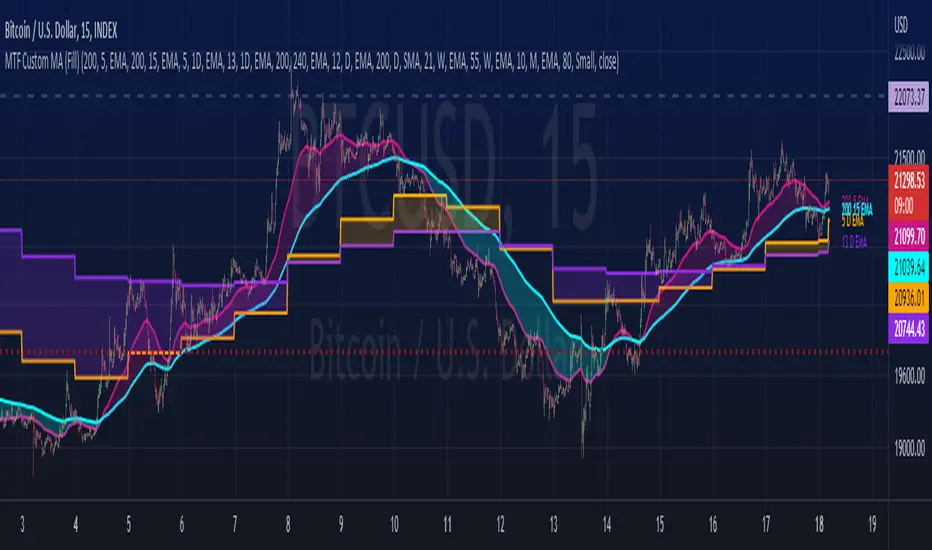
MTF Custom Moving AveragesThis user-friendly indicator allows up to 8 moving averages ( EMA or SMA ) from any timeframe, on any time frame. There are plenty of other MTF MA indicators, each with their own pros and cons. I wanted to make one without the cons:
- Independently set each MA to Exponential or Simple
- No preset lengths
- No preset timeframes
- Optional labels to help keep track of the period/length/type of each plot
- Clean, intuitive input layout
- More than enough MAs available to use one indicator for several use cases... just check/uncheck the ones that are relevant to each chart
Watch for death crosses on the 4hr while monitoring the "Bull Market Support band" (Weekly 21 EMA and 20 SMA ) and checking the Monthly 10 EMA for major support or resistance. Toggle between half of the available MAs for long term BTC trends and use the others for your alts. Use this one indicator to support multiple strategies.
Please leave a comment if you find it useful or have suggestions!
Inspired by the first MTF indicator I found: Weekly Moving Average by TommyTompsen.
Multi-Timeframe 10XIMPORTANT NOTE:
-> The timeframe for this indicator must be set at 1 minute;
-> If the chart timeframe is higher than 1 minute, the results shown in the table for timeframes lower than the chart will not be correct;
-> Tradingview's own documentation explains this as follows: " It is not recommended to request data of a timeframe lower that the current chart timeframe, for example 1 minute data from a 5 minutes chart. The main problem with such a case is that some part of a 1 minute data will be inevitably lost, as it’s impossible to display it on a 5 minutes chart and not to break the time axis. In such cases the behavior of security can be rather unexpected "; and
-> It is therefore recommended that this indicator is placed in a standalone 1min chart window, and the window resized to only show the table to avoid any issues.
Credits:
-> J. Welles Wilder creating the Directional Movement System (DMS) (1978); and
-> John Carter applying the DMS to create the popular Simpler Trading 10X Bars indicator.
Introduction:
Quickly see the quality and strength of a trend based on Directional Movement Index (DMI).
The Average Directional Index (ADX), Minus Directional Indicator (-DI) and Plus Directional Indicator (+DI) represent a group of directional movement indicators that form a trading system developed by Welles Wilder. Although Wilder designed his Directional Movement System with commodities and daily prices in mind, these indicators can also be applied to stocks. Wilder determined directional movement by comparing the difference between two consecutive lows with the difference between their respective highs.
+DI and -DI are derived from smoothed averages of these differences and measure trend direction over time. These two indicators are often collectively referred to as the DMI. ADX is in turn derived from the smoothed averages of the difference between +DI and -DI; it measures the strength of the trend (regardless of direction) over time.
Trade Signals:
-> Green indicates an uptrend i.e. when +DI is above -DI and ADX is greater than 20 - there is more upward pressure than downward pressure in the price;
-> Red indicates a downtrend i.e. when -DI is above +DI and ADX is greater than 20 - there is more downward pressure on the price; and
-> Yellow indicates no strong directional trend and potential for a reversal.
Standalone Indicator:
The 10X Bars version of the indicator can be found here:

Multi-Timeframe TTM Squeeze Pro
IMPORTANT NOTE:
-> The timeframe for this indicator must be set at 1 minute;
-> If the chart timeframe is higher than 1 minute, the results shown in the table for timeframes lower than the chart will not be correct;
-> Tradingview's own documentation explains this as follows: " It is not recommended to request data of a timeframe lower that the current chart timeframe, for example 1 minute data from a 5 minutes chart. The main problem with such a case is that some part of a 1 minute data will be inevitably lost, as it’s impossible to display it on a 5 minutes chart and not to break the time axis. In such cases the behavior of security can be rather unexpected "; and
-> It is therefore recommended that this indicator is placed in a standalone 1min chart window, and the window resized to only show the table to avoid any issues.
Credits:
-> John Carter creating the TTM Squeeze and TTM Squeeze Pro
-> Lazybear's original interpretation of the TTM Squeeze: Squeeze Momentum Indicator
-> Makit0's evolution of Lazybear's script to factor in the TTM Squeeze Pro upgrades - Squeeze PRO Arrows
This is my version of their collective works, with amendments primarily to the Squeeze Conditions to more accurately reflect the color coding used by the official TMM Squeeze Pro indicator.
TTM Squeeze Guide
For those unfamiliar with the TTM Squeeze, it is simply a visual way of seeing how Bollinger Bands (standard deviations from a simple moving average ) relate to Keltner Channels ( average true range bands) compared with the momentum of the price action. The concept is that as Bollinger Bands compress within Keltner Channels , price volatility decreases, giving way for a potential explosive price movement up or down.
Differences between the original TTM Squeeze and TTM Squeeze Pro:
-> Both use a 2 standard deviation Bollinger Band ;
-> The original squeeze only used a 1.5 ATR Keltner Channel; and
-> The pro version uses 1.0, 1.5 and 2.0 ATR Keltner Channels .
The pro version therefore helps differentiate between levels of squeeze (compression) as the Bollinger Bands moves through the Keltner Channels i.e. the greater the compression, the more potential for explosive moves - less compression means more squeezing.
The Histogram shows price momentum whereas the colored dots (along the zeroline) show where the Bollinger Bands are in relation to the Keltner Channels:
-> Cyan Bars = positive, increasing momentum;
-> Blue Bars = positive, decreasing momentum (indication of a reversal in price direction);
-> Red Bars = negative, increasing momentum;
-> Yellow Bars = negative, decreasing momentum (indication of a reversal in price direction);
-> Orange Dots = High Compression / large squeeze (One or both of the Bollinger Bands is inside the 1st (1.0 ATR) Keltner Channel);
-> Red Dots = Medium Squeeze (One or both of the Bollinger Bands is inside the 2nd (1.5 ATR) Keltner Channel);
-> Black Dots = Low compression / wide squeeze (One or both of the Bollinger Bands is inside the 3rd (2.0 ATR) Keltner Channels );
-> Green Dots = No Squeeze / Squeeze Fired (One or both of the Bollinger Bands is outside of the 3rd (2.0 ATR) Keltner Channel).
Ideal Scenario:
As the ticker enters the squeeze, black dots would warn of the beginning of a low compression squeeze. As the Bollinger bands continue to constrict within the Keltner Channels , red dots would highlight a medium compression. As the price action and momentum continues to compress an orange dot shows warning of high compression. As price action leaves the squeeze, the coloring would reverse e.g. orange to red to black to green. Any compression squeeze is considered fired at the first green dot that appears.
Note: This is an ideal progression of the different types of squeezes, however any type of squeeze (and color sequence) may appear at anytime, therefore the focus is primarily on the green dots after any type of compression.
Entry and Exit Guide:
-> John Carter recommends entering a position after at least 5 black dots or wait for 1st green dot ; and
-> Exit on second blue or yellow bar or, alternatively, remain in the position after confirming a continuing trend through a separate indicator.
Standalone Indicator:
The indicator (which can be used on any timeframe) can be found here:

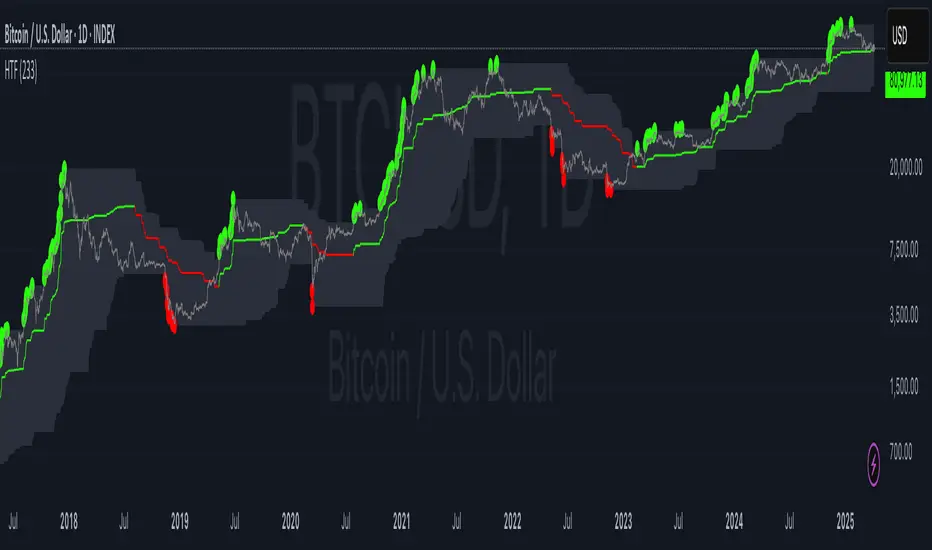
HTF Candles & PivotsThis indicator displays HTF candles and pivot points.
The candles are displayed in a box and you can select Open-Close, High-Low or both.
You can show all of the past, or just "today only" or "previous day only".
You can also shift one previous candle to the current one.
The pivot point is the normal one.
There is an option to display CPR (Central pivot range).
Example: Shift previous to current

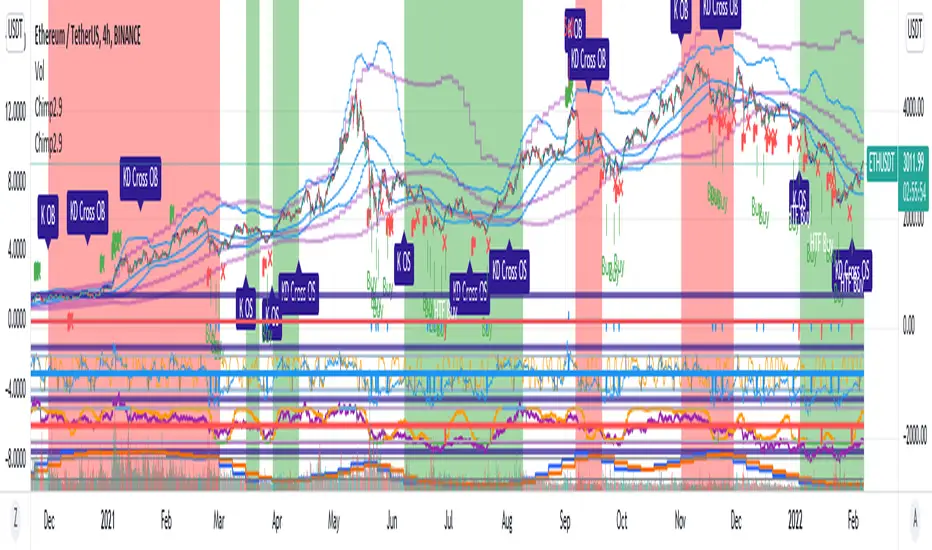
Chimpanzee V2.5 part A by joylay83Hi everyone, I am an amateur pinecoder. I would like to share my script which is coded with the intention of generating signals to send to 3commas webhook. It is still in development and revision.
This collection of indicators use:
Chart: 15m.
Inverse Fisher Transformation of the RSI to detect dips in the 15m timeframe.
Bollinger band (4H) to filter out false signals.
Triple EMA 21: to mimic price action for easier coding alerts. Currently not involved in generating signals. will be incorporated in the future.
StochRSI: As a visual filter. Currently not involved in generating signals. will be incorporated in the future.
Background will be green if stochRSI is low and red if stockRSI is high.
Candlesticks will be marked with a flag is TEMA breached BB.
One would need to play around with timeframes, BB settings and IFTRSI threshold for different signals.
There are 2 Signal Modes (with regards to IFTRSI):
Threshold: When price action falls below BB and IFTRSI hits buy threshold, a buy/sell signal is generated. Eg if IFTRSI buy threshold is set to -0.9, the buy signal will remain continuously positive as long as IFTRSI is < 0.9.
Cross: When price action falls below BB and IFTRSI hits threshold, nothing happens. It will wait until the IFTRSI cross back over the threshold before firing a signal.
There is another identical set of indicators running on a higher time frame (IFTRSI: 4H, BB: D or 3D, TEMA 21 4H) but on the same chart. This tend to generate less signals but are more reliable. A usage example would be to send a larger buy order if the signal comes from this higher time frame, or execute a sell order after multiple buys from the lower time frame.
It comes in 2 parts:
Part A: Contains overlay display. This displays BB, Triple EMA, buy/sell and StochRSI in labels. the labels are self explanatory.
Part B (please search for it): which is actually the same code but contain non-overlay display. You may also put part B overlay=true but scale to LEFT. The advantage of using overlay=true is that you can move the signal right over the candlesticks (mainly for troubleshooting/debugging). This part contains Inverse Fisher RSI, %B, Signal Line. %B is supposedly idential to Bollinger Bands in Part A.
By default, when there is a buy/sell signal:
lower time frame 15m: Signal Line in Part B will turn blue with a value 1 or -1 which corresponds to a buy or sell label in Part A
higher time frame 4H: Signal Line in Part B will turn red with a value 2 or -2 which corresponds to a HTF buy or sell label in Part A
Part A or B may be used to send signal to the webhook. You have to make sure that the settings of Part A and B are identical.
You may choose to un-display some items to reduce clutter.
Current problems:
1. Still too many buy signals
Although many times it will generate excellent buy signal at many swing lows, but there are many buy signals prior to a major swing low. This can be observed in the picture above. It also generate a couple of buy signals prior to the swing lows. I am currently experimenting with 20m and hourly timeframe to address this issue. More filters are needed eg an oscillator or detecting candlestick patterns.
2. Premature sell signals.
The sell signal is often generated at the beginning of a major bull run. My idea to solve this problem is to move to a higher timeframe and sell only when TEMA crossunder the upper bollinger band.
3. Lack of a backtester that can test multiple concurrent deals.
Buy -> Buy (average down) -> Buy (average down) -> Buy (average down) -> Sell
4. Lack of the ability to calculate average purchase price
Probably have to code it as a strategy
5. Display lag
As the browser is running 2 copies of the idential script, it tends to lag when you drag your chart around. So far there are no timeouts or delay in firing alerts to 3commas.
I do welcome any suggestion for improvement and constructive criticism. tqvm.
Credits : Thank you for doing an awesome job. I learnt a lot from your codes and tutorials.
Credits not listed in any order. If your code is used here and did not receive due credit, kindly drop me a note. tq.
Blessing 3 by JTA Today
@ZenAndTheArtOfTrading (extremely-easy-to-understand tutorials eg fixing repainting)
@LazyBear (various codes)
@Galactus-B Argo I
@TheTradingParrot (Inverse Fisher RSI and Gavin's backtester)
@zendog123 (backtester and various codes)
@ydeniz2000 (Bollinger Bands)
TradingView built-in scripts
Volume-based Support & Resistance ZonesThe new and improved Support & Resistance Zones indicator is here. This indicator is based on high volume at fractal lows or fractal highs with the zones based on the size of the wick for that timeframe’s candle.
This helps traders visualize which price levels are of the most significance for either reversals or continuation of the trend when zones are broken and then re-tested.
Original script is thanks to synapticex and additional modifications is thanks to Lij_MC. Credit to both of them for most of the logic behind this script.
Since then I have made many changes to this script as noted below:
Changed default S/R lines from plots to lines, and gave option to user to change between solid line, dashed line, or dotted line for both S/R lines.
Added additional time frame and gave more TF options for TF1 other than current TF. Now you will have 4 time frames to plot S/R zones from.
Gave user option to easily change line thickness for all S/R lines.
Made it easier to change colors of S/R lines and zones by consolidating the options under settings (rather than under style).
Added extensions to active SR Zones to extend all the way right.
Added option to extend or not extend the previous S/R zones up to next S/R zone.
Added optional time frame labels to active S/R zones, with left and right options as well as option to adjust how far to the right label is set.
Fixed issue where the higher time frame S/R zone was not properly starting from the high/low of fractal. Now any higher time frame S/R will begin exactly at the High/Low points. Note that this may not work perfectly on stocks and if a fractal high/low is too many bars in the past, it will revert to a default max bars back to avoid script errors.
Added to script a function that will prevent S/R zones from lower time frames displaying while on a higher time frame. This helps clean up the chart quite a bit.
Created arrays for each time frame's boxes and lines so that the number of S/R zones can be controlled for each time frame and limit memory consumption.
New alert options added and customized alert messages.
- The way this indicator works is it looks for fractal highs or fractal lows with volume that pierces above the volume's Moving Average. This moving average value can be modified in the settings for each time frame.
- The fractal highs will be confirmed with 3 successive higher highs followed by 2 successive lower highs and vice versa for the fractal lows.
- The zone is created from the fractal high/low and the close of the candle for whatever time frame you selected. The bigger the zone, the more significant that zone is.
- You can disable any zone, change the zones to show lines only, and modify all the colors, transparencies, and thickness of lines for all the zones.
- To create alerts, you first want to enable the types of alerts you want for each time frame in the indicator's settings. Then after you apply changes, right click on one of the zones on the chart, and click "Add Alert on Vol S/R Zones". You do not need to add a title as the correct alert messages are already built-in.
- More changes will be coming in the future!
I hope you find this indicator useful, if so please give it a thumbs up!
If you have any suggestions or features you would like to see, just let me know in the comment section. Thanks and enjoy!

MTF RSI + Average (Multi-Timeframe) [TH]Multi-Timeframe Relative Strength Index --- MTF RSI
Eliminates having to change time intervals to view a different Time Interval's RSI value (up to 5 time intervals possible through the settings).
The RSI values from Multiple Time Frames can be averaged together to show one single RSI.
A table overlay (info box) makes it easy to quickly identify RSI values on the multiple different time frames.
