KK_MA_MTFThis is multitimeframe Hull moving average
you can change offset to 0 if you want realtime data
Multi-timeframe

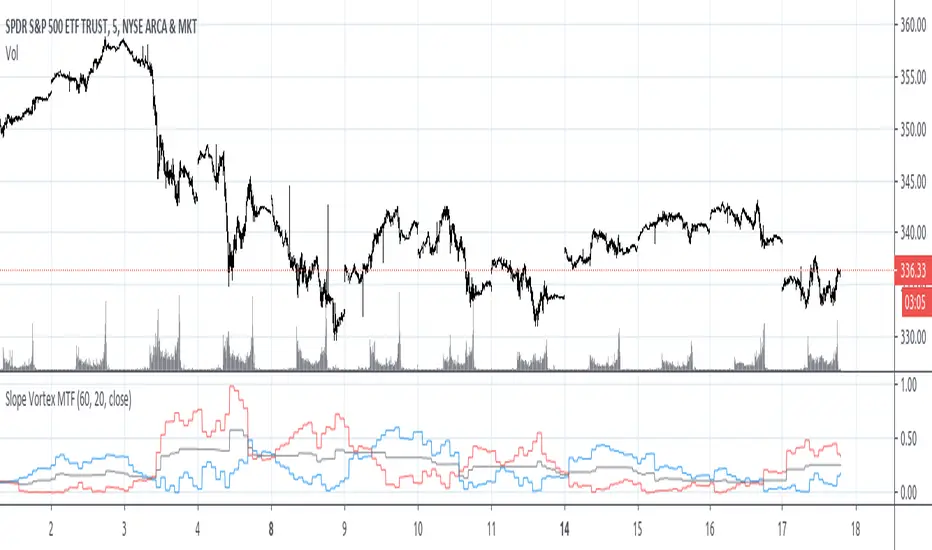
Slope Vortex MTFA request was made to make this script into a mult-time frame version. :)
I'm not fond of the outcome using a really high time frame like the 1 Day when you're looking at a 5 minute intraday chart, but I think it looks pretty decent on something like a 5 min chart with 1 hour higher time frame.
Please checkout the original Slope Vortex script for more information on how it can potentially be used as a trading signal.
Higher Timeframe Trend Indicator V3.0What is it?
An indicator that depicts the trend of up to 5 higher timeframes on the same chart without needing to context-switch between charts.
Features
- Supports up to 5 timeframes
- Trends indicated by 5 colored buttons: one for each timeframe
- Varying shades of green: uptrend
- Varying shades of red: downtrend
- White/silver: sideways/neutral
- Configurable length (time period) for each timeframe
- Increase length to capture long term trends; decrease it to capture only short term ones
- Configurable sensitivity for each timeframe
- Sensitivity determines what angle is considered trending and what is not
- Increase sensitivity to capture weak trends
- Decrease sensitivity to filter out weak trends and capture only strong/steep ones
- Sensitivity ranges from 1 (least sensitive) to 3 (most sensitive)
- Move the labels around vertically for better visibility by changing the "Location" and "Offset" parameters
How should one use it?
Use it to quickly browse through charts to understand the context across timeframes, and zero in on only those that have trends aligning on the higher and lower timeframes as per your strategy. For e.g., a chart that is trending up strongly on the 15min and 60min (indicated by dark green colored buttons), and trending down on the 1 and/or 5 min (indicated by red-colored buttons), can be shortlisted for a potential pullback trade. Use your favorite pullback strategy (Supply/Demand, Support/Resistance, Moving Averages, etc.) to hop in on the trend.
How are trends determined?
The indicator uses normalized %change in price of the linear regression line segment of the chosen price sources (close, high, low, MA, etc.) over a specified length to determine trend direction and intensity
Known Issues
Will indicate the trend correctly only for timeframes *higher* than the current (visible) resolution/timeframe of the chart. Might not indicate it correctly for lower timeframes ( i.e., lower than the current (visible) resolution/timeframe of the chart). For this reason, all timeframes lower than the current resolution will be hidden in the present release.
Future releases
- I am still experimenting with various sensitivity levels and the corresponding trend shades to make the tool as accurate and intuitive as possible. These modifications might come in
- Sensitivity levels might be increased.
- Bug fixes, if any

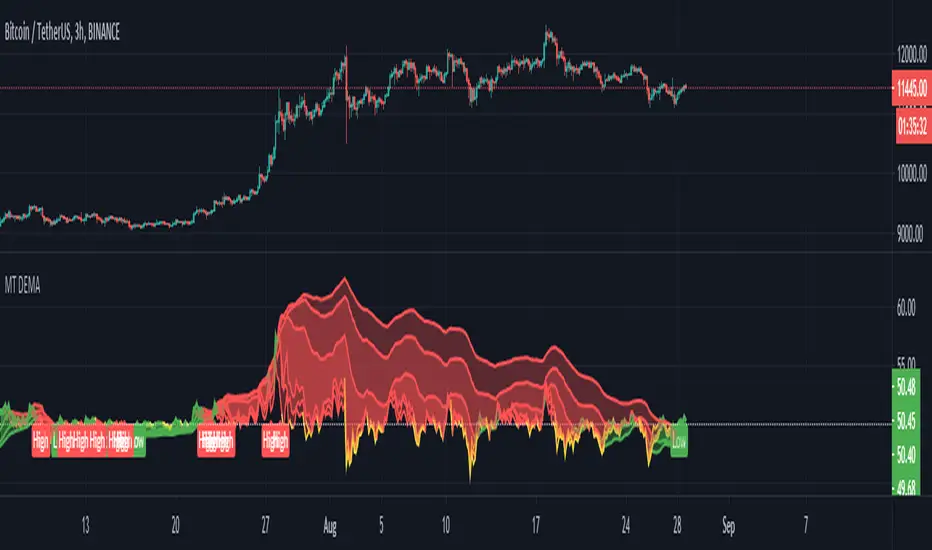
MT DEMA
In this example I'm using 3H 2H 1H as inputs with 200 50 20 lengths.
DEMA is a indicators based on 3 EMAs on 3 time frames.
It measures the distances from its exponential moving averages.
Really great in swing trading.
HISTOR
In this chart I used the 3H 2H and 1H
HISTOR, short histogram RSI is based on 3 time frames of RSI and MF averages and SMAs.
The script also plots a normilized volume.
The script has 3 alert conditions. Overbought, oversold and "potential trade" when overbought or oversold.

[CP]3 RSI Multi Timeframe InceptionTriple RSI indicator where you can set the timeframe for each RSI.
Take confirmation from different timeframes to make high probability trades!
Typical settings would be,
1 Day, 1 Week, 1 Month or
1 hr, 4hr, 1 Day or
3 min, 15 min, 1 hr or.........your imagination is the only limit here!

VWAP x5 [Higher]MTF Refactored by IzocelMultiple VWAP
What is the Volume Weighted Average Price (VWAP)?
The volume weighted average price (VWAP) is a trading benchmark used by traders that gives the average price a security has traded at throughout the day, based on both volume and price. It is important because it provides traders with insight into both the trend and value of a security. <---- Source Investopedia 2020 : By CORY MITCHELL Reviewed By GORDON SCOTT
There's nothing much to explain, possibility to use fills between the VWAP and it's associated previous close.
Be sure to use it with higher Timeframe than your chart T.F.
-Raphaël V.D.
Efficient Support & Resistance LevelsThis script is a mixture of my two previous scripts "True Strong Classical Support/Resistance Levels" and "Hidden Supports & Resistances + Round Levels". This combination brings on better identification of the most efficient support/resistance levels.
Note that "Hidden SnR Levels" part of the code is only expected to work on Forex charts, but apart from that, the other parts could be applied to any chart.
The script may:
- Draw classical support/resistance levels which retraced the price previously, aided by multi-timeframe analysis
- Draw hidden support/resistance levels based on psychological patterns of the price
- Adjust to wicks better than Pine Script built-in pivot functions
- Differ the levels color based on chart reactions
- Merge nearby classical levels to avoid congestion on the chart
Feel free to use it and send me your thoughts.

Profit Accumulator Moving Average SlopeMoving Average Slope Indicator
This is a support indicator to the Main Indicator which has also been published.
This indicator makes use of custom and adjustable moving averages. There are two options for this centred oscillator:
Average of Three Moving Averages on Current Time Frame
Average of Three Moving Average Time Frames for One Length (i.e. if I'm using a 1hr time frame I would take the average of 30min, 1hr and 4hr moving averages with a 12 length).
When the trend line crosses above zero it is an indication for a long trade and when the trend line crosses below zero it is an indication for a short trade.
Whilst an actual alert function is not set for the indicator, the TradingView alert function can be used to trigger a message when the trendline crosses above or below zero.
I've been using this successfully on the one hour FX charts, but seems to work equally as well on higher or lower time frames (not less than 15min).
The other indicators which are part of the suite are shown on the website which is highlighted in my signature at the bottom of the page. Purchase of the main indicator gives access to the full suite of eight indicators. I use the other indicators to confirm the direction of the trade and to determine if I want to trade or not. I use it along with the 2min, 15min and 4hr timeframes to identify the best entry window and how long I'm likely to be in the trade.
Support can be provided via private message or in the comments below.
The links are provided below for access to the indicator.

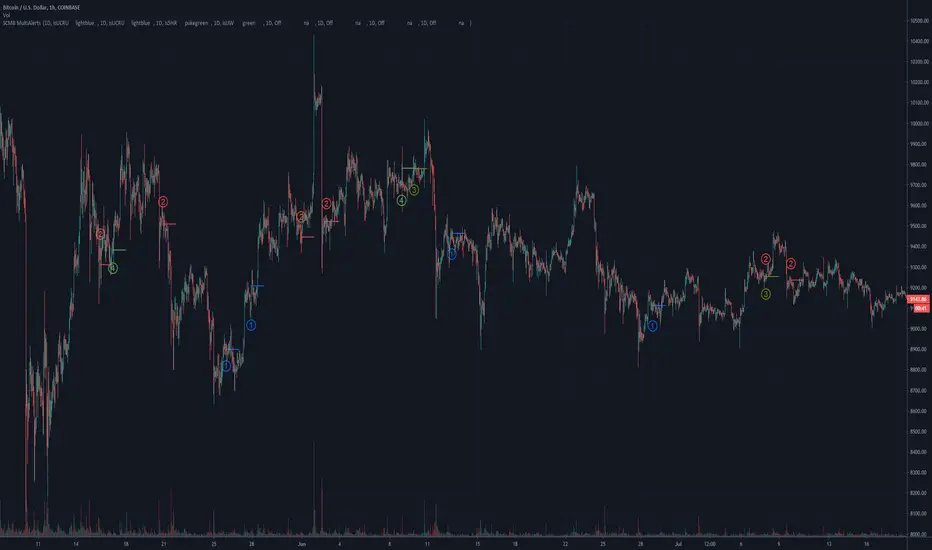
SCMB MultiAlerts - Candle Structure Alert ScriptSCMB Multialerts is a tool for candle structure alert automation.
The input screen allows you to input the timeframe, choose candle structure condition, toggle inverse condition, and toggle Heiken-Ashi for that candle structure trigger condition.
Input the timeframe with the # first and use H - Hour, D - Day, W - Week, and M - Month after the number; example - "1H" - "3D" - "4H" - "1W"
There are 8 total alert conditions that are programmable. You may use any combination of timeframes, inverse/HA, and candle-structure unique to each trigger available at the same time.
When you have set the conditions you want for alerts with the input settings, the color and the position of on-screen alerts is automatically populated.
You can then visually back-test to make sure these settings are desirable
Customize the colors individually, or choose to use "Color0" for all alert conditions by default by "user colors" toggle at the bottom of settings window, then you only need to change "Color0" for each alert condition.
Use the "Indicator Templates" to save your configuration, save several presets with settings for different situations, you can link the settings to a particular symbol as well.
Finally, use the "add alert" feature within tradingview to select the SCMB alert conditions as triggers. TV will deploy alerts with your customized message when each condition is met.
Some notes and known bugs:
Timeframe input requires capital letters for H,D,W,M.
Selecting "Close" Open" or "HL/2" from the drop down will do nothing at the moment. Future release plans to make use of these options.
If there is a feature you would like, question answered, or a bug to report, visit the TradingView SNOW_CITY public chat-room; link in my signature
Use the pastebin link below for indicator access information
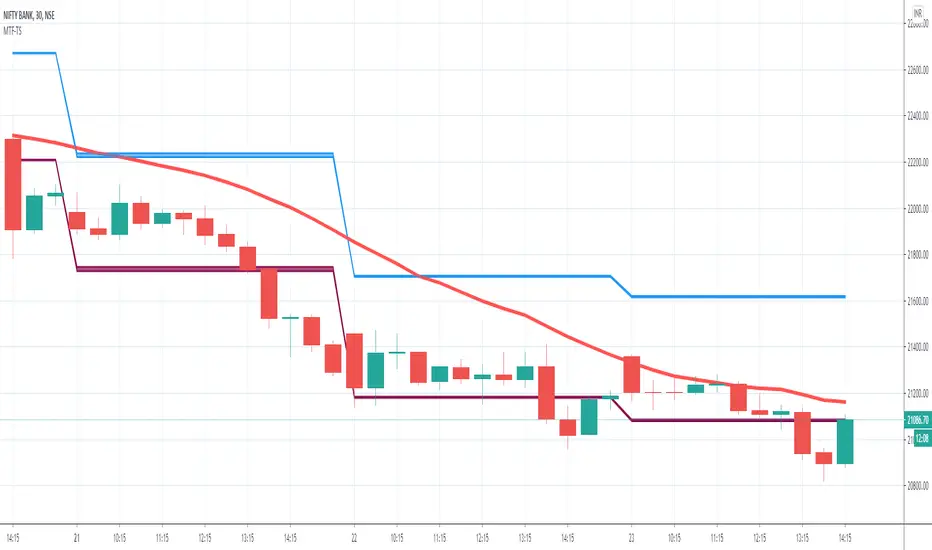
Multi Time Frame - Trade Setup ( MTF-TS )This is Beta version of the Indicator and works on Multi Time Frame Analysis with Hybrid Moving Averages and RSI
Applicability : Index Trading / Equities and on proper analysis you may use it for Option Trading also.
As part of the Indicator there are 4 Choices that the user can opt for
Show Intraday Trades - This works for Intraday Trades - when the resolution is kept to less than 1 hour ( Say 3 , 5 , 10 , 15 Mins)
Show Short Term Trades - This works well when the resolution is kept to 1 Day - Good for Swing Trades spanning over a few days
Show Long Term Trades - This works well when the resolution is kept to 1 Day or Week - Good for Investments
Show Trend Line - Will show the user the Simple Moving Average 20 based on the resolution selected , The Trend Line Is a repainted based on the hybrid RSI Logic
The Trend Line would show in three colours
Green : The Setup is in Up Trend- Try to take the trade as closer to the band as possible and when it continues to be in green ( and recommended when it would have just crossed from Red/Yellow to Green )
Red : The Setup is in Down Trend - Try to take the trade as closer to the band as possible and when it continues to be in red ( and recommended when it would have just crossed from Green/Yellow to Red )
Yellow : The Setup in sideways Trend
Visual Checks - It is always recommended to enter/exit the trade it it touches crosses over the Trend Line from one side to the other
When closer to the support resistance bands , wait for a confirmation candle to determine if you are getting resistance breakout / support or breakdown
Stop Loss - That should be done by following ones risk appetite , Ideally the open/close of the previous candle should be the stop loss for the buy/sell
but everyone has their own Risk Management Strategies based on the capital deployed.
Disclaimer : There could be scenarios when the breakout/breakdown candle is rejected , especially when it is long one
so it is always recommended to have a confirmation candle that open-closes above the breakout candle / open-closes below the breakdown candle
If you like it and find it useful or if you find a defect or bug , Please let us know in the comments .. that would encouraging !! for us to develop it further
Thank you and have a beautiful trading session !
SIDD-Master-Moving-AverageSIDD-Master-Moving-Average is based on RSI average calculation Moving average plotted on chart.
This Moving Average is giving 2 signals Bullish and Bearish .
Whenever Bullish signals is coming price is doing crossover with moving average on upside and this indicate price will go up from current market price.
Whenever Bearish signals is coming price is doing cross-under with moving average on downside and this indicate price will go down from current market price.
Moving average color is changing based on upside movement or downside movement , for upside its green and for downside its orange color.
This indicator i have created with stop loss line means any price close below cross line for bullish position then that trade should be closed and take the stop loss. similarly for Bearish trade and candle close above stop loss line means trade should be closed and take the stop loss.
Stop loss i have taken care with ATR and Super trend you can see the settings.
I have defined setting for general use of indicator if any modification on setting then result may vary.
Its multi time frame moving average. And I have given time frame for indicator as well so if any trending move need to capture then that setting need to be increased with respect to chart time frame else keep it same.
I have added commission and slippages as well in indicator.
Ping me or DM me to subscribe this indicator.
I have given all my indicator details below link (Signature URL). You can check indicators and call me on given number or email me on given email to access the scripts and indicators. Telegram link is also given you can ping me there.
--------------------------------------------------------------------------------------------------------------------------------------
Disclaimer : Past performance of the indicator is not giving guarantee for future performance as well, it may change as per market condition.
-------------------------------------------------------------------------------------------------------------------------------------

Hybrid Overbought/Oversold Detector + Put/Call SignalsThere are many indicators of overbought/oversold conditions out there. Some of more common ones are:
- Bollinger Bands %B
- Money Flow Index (MFI)
- Relative Strength Index (RSI)
- Stochastic
This script uses a combination of these 4 oscillators to confirm overbought/oversold and filter the signals of market reverse which could be used for trading binary options.
You may select which oscillators you want to apply and of course change the source, the length of the calculations and the overbought/oversold levels.
Also the script will draw a combined graph which is the average of the selected oscillators in the options.
Send me your ideas!

MTF TZ-CXThis is a Beta version of Trend Indicator using Multi Time Frame Analysis to suggest a long or a short
the main use of this indicator is quick scalping and Intra-day trading.
The Indicator shows the option to show the Trend Zone and Buy/Sell Signals which the use can on or off
Also to avoid false positives we have introduced a double check using RSI,
it is defaulted to 60/30 - the users are free to change it as per their preferences
The system will not suggest a trade when the the counter in inside the RSI limits
Stop Loss - That should be done by following ones risk appetite , Ideally the open/close of the previous candle should be the stop loss for the buy/sell
but everyone has their own Risk Management Strategies based on the capital deployed.
Disclaimer : There could be scenarios when the candle is shown as a long or short and then the candle turns into opposite direction red/green .
In such scenarios , Please refer to the just preceding candle and if this candle is moving into positive direction (forming green candle) only then buy ,
Similarly Sell/Short only if this candle is forming a red candle

Multi Timeframe VWAPsThis is a Multi Timeframe VWAP indicator.
All timeframes are customizable.
Thanks to volume weighting you can get a clear view of some important levels that may not be easily identifiable otherwise.
Multi timeframe VWAP breaks and bounces can help identify higher timeframe reversals/rejections.
You can apply this study to virtually any market with available volume data and it will give you meaningful insights as to where price is in relation to various timeframe VWAPs.
Default timeframes are set to:
30min
60min
1 day
1 week
1 month
Quarterly (3 month)
Yearly (12 month)
Generally these settings will suffice most market conditions, however you may like to set the shorter timeframes (30min, 60min) to 2 or 3 day timeframes.
Enjoy

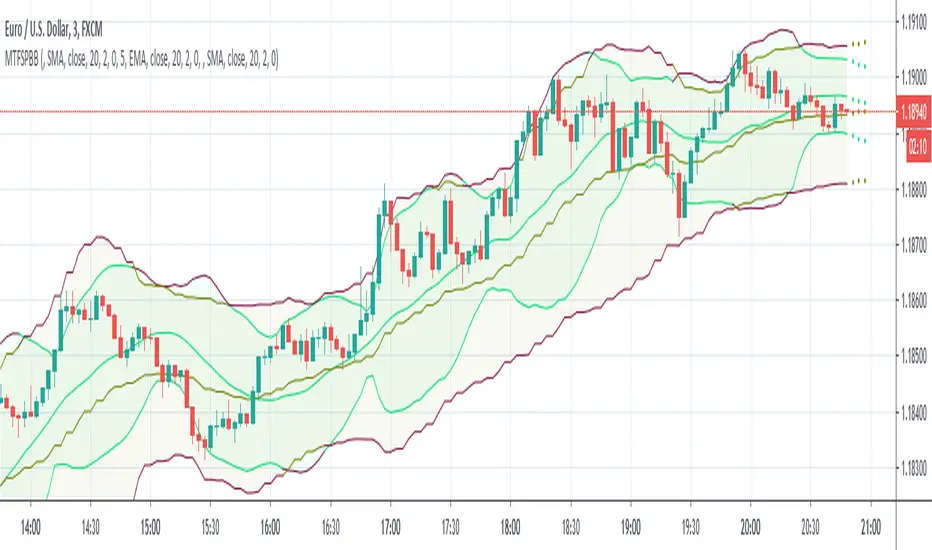
MultiTimeFrame Shifting Predictive Bollinger BandsThis is the optimized version of my MTFSBB indicator with capability of possible bands prediction in case of negative shifting (to the left).
Make me happy by using it and sending me your ideas about the prediction.
Multi Time Frame - Trade Entry PointsThis is Beta version of the Indicator and works on Multi Time Frame Analysis
As part of the Indicator there are 5 Choices that the user can set up
Show Intraday Trades - This works for Intraday Trades - when the resolution is kept to less than 1 hour
Show Short Team Trades - This works well when the resolution is kept to 1 Day - Good for swing Trades spanning over a few days
Show Long Term Trades - This works well when the resolution is kept to 1 Day or Week - Good for Investments
Show SMA20 - Will show the user the Simple Moving Average 20 based on the resolution selected
Show DMA20 - Will show the user the Daily Moving Average 20 based on the resolution selected
Buy Entry Points - Would be shown as a Green Arrow below the bar
Sell/Short Entry Points - Would be shown as a Red Arrow Above the bar
Visual Checks - It is always recommended to exit the trade it it touches SMA20
Stop Loss - That should be done by following ones risk appetite , Ideally the open/close of the previous candle should be the stop loss for the buy/sell
but everyone has their own Risk Management Strategies based on the capital deployed.
Disclaimer : There could be scenarios when the candle is shown as a buy or sell and then the candle turns into opposite direction red/green .
In such scenarios , Please refer to the just preceding candle and if this candle is moving into positive direction (forming green candle) only then buy ,
Similarly Sell/Short only if this candle is forming a red candle

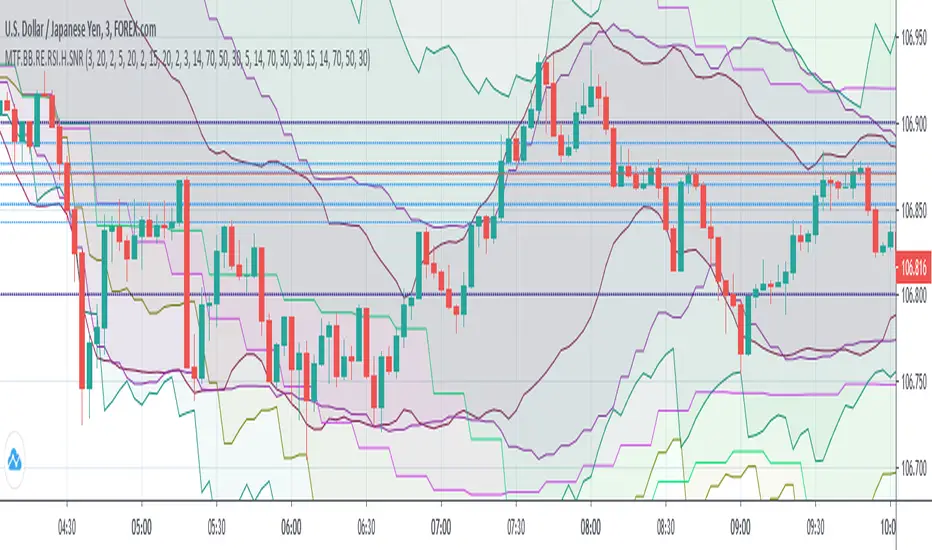
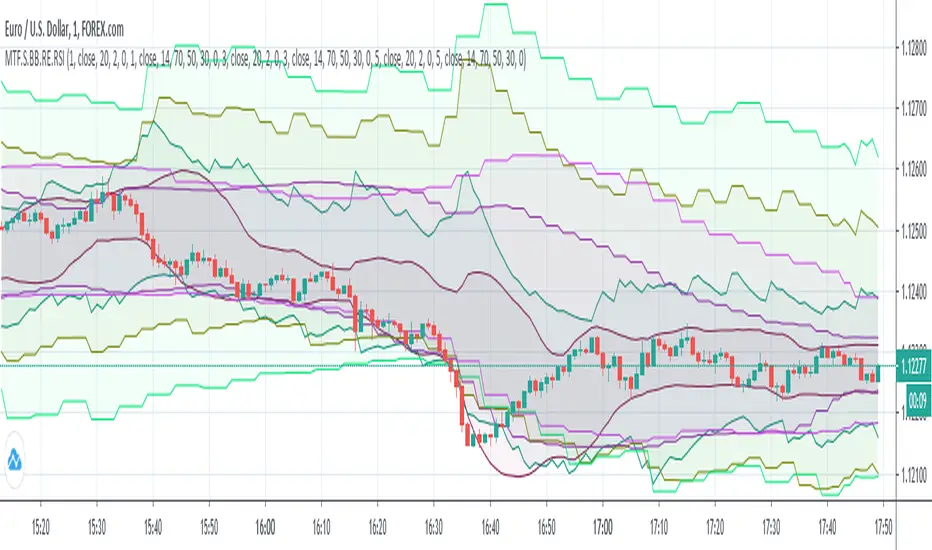
(MTF) Bollinger Bands + RE RSIs + Hidden Supports & ResistancesI merged some of my previous written indicators, because a combination of multi-timeframe Bollinger Bands, RE RSI and Resistance/Support levels could help a lot.
Don't forget to add my other useful indicator (Classical SnR) to the chart to maximize your profit!
Volume Multi Time FrameHi All,
This script shows total volume info of Higher Time Frame. it checks open/close prices of higher time frame and sets the color. it also show a dynamic line on last volume , so you can see when HTF candle started and ended. by looking at the color of volume columns you can see HTF candle is green or red. it's something like weis wave volume that is using HTF candles.
Higher time frame is set automatically, you can set it manually by choosing "User-defined" in the indicator options and choose higher time frame as you want
Here some examples:
Current time freame is 1min and htf is 1hour
Current time freame is 1min and htf is 1day
Enjoy!

Combination Parabolic MA/IIR/ALMA Strategy, with other goodiesOkay, so this is a lot. It started mostly with me combining indicators and looking for ideal entry criteria.
It is also a collection of conditions, whether used or unused, for my current chosen "best" strategy. It is currently set how I like it, but it has changed with time, and will continue to do so. Within, there are variables that are unused, but offer some insight into the overall odds of a trade. They were, in fact, once used but fell out of favor. And all details for this strategy are within the comment header of the script.
As this evolves, I most certainly wont keep any future findings and hope for profit from my peers (yinz). Also, I'd like to give a sincere thanks to the people of TV for what I learned in a few month's time and their flexible membership plans. Basically, I'm just a mad scientist, but this monster's a masterpiece and folks here before me made many indirect contributions to it.
--------------------------
Okay guys, lastly and most importantly,
Each smack of the like button is a vote of your confidence in me, to my beautiful landladies, Celeste and Adele, that my rent will be caught up and that it won't always be a problem. Which, in my mind, makes me a graph. And they've got strong hands and don't sell the low. I more than respect that. Seriously. And I'm very grateful for their willingness to work with me, but the thing is that I didn't ask first; life just happens. But few are tolerant of others. And quite importantly, I truly believe that I will be successful one day, and that "thumbs-up" button is your vote of confidence. If you're not sure, then don't hit it yet. Maybe my scripts will boost your confidence in me :)
-------------------------
PS: And you know what? I'ma give a shout-out to Philakone for teaching me everything that I know about Elliot Wave . Absolutely. Two years ago, I would keep telling myself that one day I will put something in his gratuity wallet or pursue the paid courses. And, I still plan on it, because I'm grateful. And so also, to everybody else, I'm recommending him to learn from. because as a trader who might not know everything for free, you can certainly fill in the gaps with his altruistic offerings. And I'm betting that you will then feel more than inclined to buy the Udemy course.
"If wave 2 retraces a lot; number 4 will not". Repetition. Philakone didn't fix my memory but he sure did find a workaround, haha
Okay, everyone, Thanks!

MTF Shifting BBs + Reverse Engineering RSIs Overlay on ChartAnother multi-timeframe indicator presents 3 MTF (each) Bollinger Bands and 3 MTF (each) Reverse Engineering RSI and of course with shifting (left/right) capability.
RERSI in a simple term is the RSI but on the main chart alongside with candles.
There are many adjustable options like:
- Show/Hide each BB
- Show/Hide each MA
- Non-integer BB deviation values
- Positive/Negative shifting values
- Show/Hide each RSI
- Show/Hide each RSI Mid Level
- Adjustable Overbought, Oversold and Mid Levels values
I wrote this after my first script MTFSBB, because it's very useful to have BBs and RSIs together on a chart.
Calculating RERSIs will take some time, so be patient with it and feel free to use it.
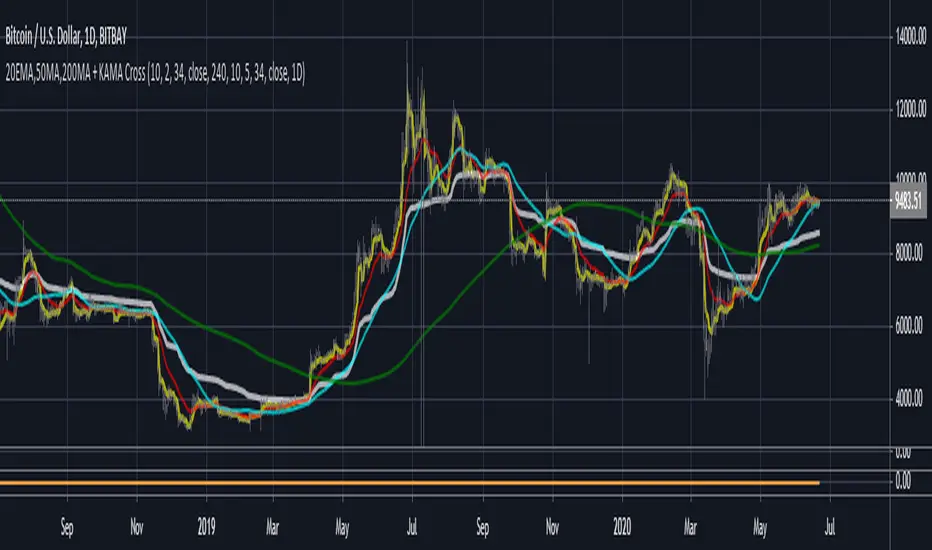
3MA'S + KAMA Trend (20EMA,50MA,200MA + KAMA Trend)This indicator, combines the traditional FOREX moving averages (20EMA, 50ma, 200ma) into a single indicator with
an adaptive moving average (AMA) taken from a user defined timeframe to show trend direction (by default, it plots
the daily 10/2/34 KAMA overlayed on any timeframe chart.
An AMA moves slowly when markets are sideways but swiftly during periods of volatility as a result it reacts much fast than
traditional options for moving average trends.
If the price is above the KAMA, trend is up. Below the KAMA, trend is down.
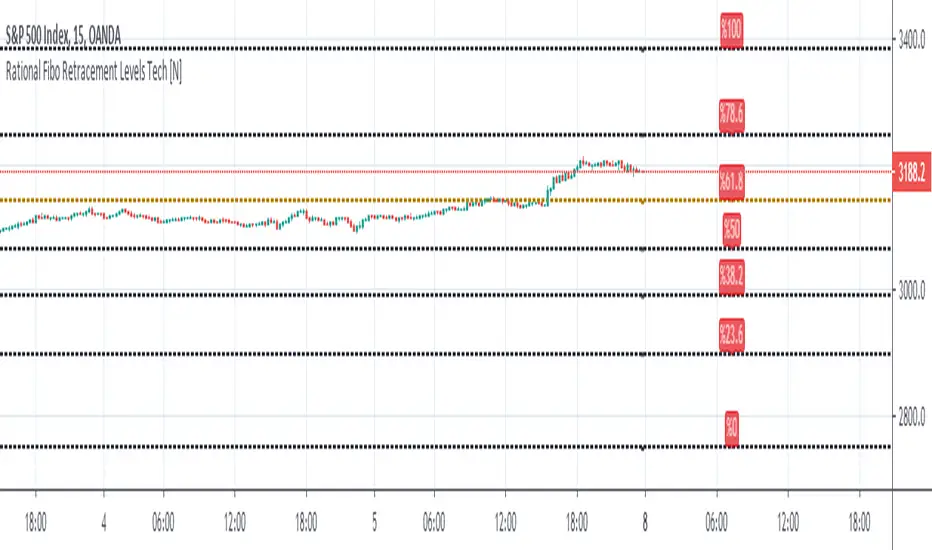
Rational MTF Auto - Fibonacci Retracement Levels Hello, this script automatically draws rational Support - Resistance Levels as multi time frame. (MTF)
In this way, we see reasonable levels ahead of us.
As of the date of birth: The first year after Lehmann Brother's fall was determined after January 1, 2009.
One feature of this script (which I deliberately left this way) :
If the security and support-resistance levels are equal, it will show you NA value and say wait.
Because it is based on a weekly basis for region selection, I think that it should enter a region and support-resistance levels should be drawn accordingly.
That's why I left it this way.
NOTE :
This script was inspired by the following publication :
Regards.