XRP Non-Stop Strategy (TP 25% / SL 15%)XRP Non-Stop Strategy (TP 25% / SL 15%) is a continuous long-side trading system designed specifically for XRP. The strategy uses an EMA-based trend filter (EMA20/EMA50) to confirm bullish conditions before entering a long position. Each trade applies a fixed +25% Take Profit target and a −15% Stop Loss, calculated dynamically from the entry price.
When a trade closes—whether by TP or SL—the strategy automatically re-enters on the next qualifying signal, enabling uninterrupted position cycling.
Features include:
• EMA-based trend confirmation
• Dynamic TP/SL visualization on the chart
• Clear BUY and EXIT markers
• Dedicated alert conditions for automation
Médias Móveis

XRP Non-Stop Strategy (TP 25% / SL 15%)This strategy performs continuous automated trading exclusively on XRP. It opens long positions during favorable trend conditions, using a fixed Take Profit target of 25% above the entry price and a fixed Stop Loss of 15% below the entry. Once a trade is closed (either TP or SL), the strategy automatically re-enters on the next valid signal, enabling uninterrupted trading.
The script includes:
Dynamic Take Profit & Stop Loss lines
Optional EMA trend filter
Visual BUY and EXIT markers
TradingView alerts for automation or notifications
This strategy is built for traders who want a simple, price-action-driven system without fixed price levels, relying only on percentage-based movement from each entry.

Long Only EMA Strategy (9/20 with 200 EMA Filter)Details:
This strategy is built around a very simple idea: follow the primary trend and enter only when momentum supports it.
It uses three EMAs on a standard candlestick chart:
1. 9‑period EMA – short‑term momentum
2. 20‑period EMA – medium‑term structure
3. 200‑period EMA – long‑term trend filter
The strategy is ** long‑only ** and is mainly designed for swing trading and positional trading.
It avoids counter‑trend trades by taking entries only when price is trading ** above the 200 EMA **, which is commonly used as a long‑term trend reference.
The rules are deliberately kept simple so that they are easy to understand, modify, and test on different markets and timeframes.
---
Key Features
1. **Trend‑Filtered Entries**
- Fresh long positions are considered only when:
- The 9 EMA crosses above the 20 EMA
- The closing price is **above** the 200 EMA
- This attempts to combine short‑term momentum with a higher‑timeframe trend filter.
2. **Clean Exit Logic**
- The long position is exited when the closing price crosses **below** the 20 EMA.
- This creates an objective, rule‑based way to trail the trade as long as the medium‑term structure remains intact.
3. **Long‑Only, No Short Selling**
- The script intentionally ignores short setups.
- This makes it suitable for markets or accounts where short selling is restricted, or for traders who prefer to participate only on the long side of the market.
4. **Simple Visuals**
- All three EMAs are plotted directly on the chart:
- 9 EMA (fast)
- 20 EMA (medium)
- 200 EMA (trend)
- Trade entries and exits are handled by TradingView’s strategy engine, so users can see results in the Strategy Tester as well as directly on the chart.
5. **Backtest‑Friendly Structure**
- Uses TradingView’s built‑in `strategy()` framework.
- Can be applied to different symbols, timeframes, and markets (equities, indices, crypto, etc.).
- Works on standard candlestick charts, which are supported by TradingView’s backtesting engine.
6. **Configurable in Code**
- The EMA periods are defined in the code and can be easily adjusted.
- Users can tailor the parameters to fit their own style (for example, faster EMAs for intraday trading, slower EMAs for positional trades).
---
How to Use
1. **Add the Strategy to Your Chart**
1. Open any symbol and select a **standard candlestick chart**.
2. Apply the strategy from your “My Scripts” section.
3. Make sure it is enabled so that the trades and results appear.
2. **Select Timeframe**
- The logic can be tested on various timeframes:
- Higher timeframes (1H, 4H, 1D) for swing and positional setups.
- Lower timeframes (5m, 15m) for more active trading, if desired.
- Users should experiment and see where the strategy behaves more consistently for their chosen market.
3. **Read the Signals**
- **Entry:**
- A long trade is opened when the 9 EMA crosses above the 20 EMA while the closing price is above the 200 EMA.
- **Exit:**
- The open long position is closed when the closing price crosses below the 20 EMA.
- All orders are generated automatically once the strategy is attached to the chart.
4. **Use the Strategy Tester**
- Go to the **Strategy Tester** tab in TradingView.
- Check:
- Net profit / drawdown
- Win rate and average trade
- List of trades and the equity curve
- Change the date range and timeframe to see how stable the results are over different periods.
5. **Adjust Parameters if Needed**
- Advanced users can open the code and experiment with:
- EMA lengths (for example 8/21 with 200, or 10/30 with 200)
- Risk sizing and capital settings within the `strategy()` call
- Any changes should be thoroughly re‑tested before considering real‑world application.
---
Practical Applications
1. **Swing Trading on Daily Charts**
- Can be applied to stocks, indices, or ETFs on the daily timeframe.
- The 200 EMA acts as a trend filter to stay aligned with the broad direction, while the 9/20 crossover helps catch medium‑term swings inside that trend.
2. **Positional Trades on Higher Timeframes**
- On 4H or 1D charts, this approach can help in holding trades for several days to weeks.
- The exit rule based on the 20 EMA crossing helps avoid emotional decisions and provides a rules‑based way to trail the trend.
3. **Trend‑Following Filter**
- Even if used purely as a filter, the 200 EMA condition can help traders:
- Avoid taking long trades when the market is in a clear downtrend.
- Focus only on instruments that are trading above their long‑term average.
4. **Educational Use**
- The script is intentionally kept straightforward so that newer users can:
- Learn how a moving average crossover strategy works.
- See how to combine a short‑term signal with a long‑term filter.
- Understand how TradingView’s strategy engine handles entries and exits.
5. **Basis for Further Development**
- This can serve as a starting point for more advanced systems.
- Traders can extend it by adding:
- Additional filters (RSI, volume, volatility filters, time‑of‑day filters, etc.)
- Risk management rules (fixed stop loss, take profit, trailing stops).
- The current version is kept minimal on purpose, so modifications are easy to implement and test.
---
Important Notes & Disclaimer
1. This strategy is provided **for testing, research, and educational purposes only**.
2. It is ** not ** a recommendation to buy or sell any financial instrument.
3. Past performance on historical data does not guarantee similar results in live markets.
4. Markets are risky and trading can lead to financial loss; users should always do their own research, manage risk appropriately, and consult a qualified financial professional if needed.
5. Before using any strategy with real capital, it is strongly advised to:
- Forward test it on a demo / paper trading account.
- Check how it behaves during different market phases (trending, sideways, high‑volatility conditions).
You are free to modify the parameters and logic to better align it with your own trading style and risk tolerance.

Strategy: HMA 50 + Supertrend SniperHMA 50 + Supertrend Confluence Strategy (Trend Following with Noise Filtering)
Description:
Introduction and Concept This strategy is designed to solve a common problem in trend-following trading: Lag vs. False Signals. Standard Moving Averages often lag too much, while price action indicators can generate false signals during choppy markets. This script combines the speed of the Hull Moving Average (HMA) with the volatility-based filtering of the Supertrend indicator to create a robust "Confluence System."
The primary goal of this script is not just to overlay two indicators, but to enforce a strict rule where a trade is only taken when Momentum (HMA) and Volatility Direction (Supertrend) are in perfect agreement.
Why this combination? (The Logic Behind the Mashup)
Hull Moving Average (HMA 50): We use the HMA because it significantly reduces lag compared to SMA or EMA by using weighted calculations. It acts as our primary Trend Direction detector. However, HMA can be too sensitive and "whipsaw" during sideways markets.
Supertrend (ATR-based): We use the Supertrend (Factor 3.0, Period 10) as our Volatility Filter. It uses Average True Range (ATR) to determine the significant trend boundary.
How it Works (Methodology) The strategy uses a boolean logic system to filter out low-quality trades:
Bullish Confluence: The HMA must be rising (Slope > 0) AND the Close Price must be above the Supertrend line (Uptrend).
Bearish Confluence: The HMA must be falling (Slope < 0) AND the Close Price must be below the Supertrend line (Downtrend).
The "Choppy Zone" (Noise Filter): This is a unique feature of this script. If the HMA indicates one direction (e.g., Rising) but the Supertrend indicates the opposite (e.g., Downtrend), the market is considered "Choppy" or indecisive. In this state, the script paints the candles or HMA line Gray and exits all positions (optional setting) to preserve capital.
Visual Guide & Signals To make the script easy to interpret for traders who do not read Pine Script, I have implemented specific visual cues:
Green Cross (+): Indicates a LONG entry signal. Both HMA and Supertrend align bullishly.
Red Cross (X): Indicates a SHORT entry signal. Both HMA and Supertrend align bearishly.
Thick Line (HMA): The main line changes color based on the trend.
Green: Bullish Confluence.
Red: Bearish Confluence.
Gray: Divergence/Choppy (No Trade Zone).
Thin Step Line: This is the Supertrend line, serving as your dynamic Trailing Stop Loss.
Strategy Settings
HMA Length: Default is 50 (Mid-term trend).
ATR Factor/Period: Default is 3.0/10 (Standard for trend catching).
Exit on Choppy: A toggle switch allowing users to decide whether to hold through noise or exit immediately when indicators disagree.
Risk Warning This strategy performs best in trending markets (Forex, Crypto, Indices). Like all trend-following systems, it may experience drawdown during prolonged accumulation/distribution phases. Please backtest with your specific asset before using it with real capital.


The Oracle: Dip & Top Adaptive Sniper [Hakan Yorganci]█ OVERVIEW
The Oracle: Dip & Top Adaptive Sniper is a precision-focused trend trading strategy designed to solve the biggest problem in swing trading: Timing.
Most trend-following strategies chase price ("FOMO"), buying when the asset is already overextended. The Oracle takes a different approach. It adopts a "Sniper" mentality: it identifies a strong macro trend but patiently waits for a Mean Reversion (pullback) to execute an entry at a discounted price.
By combining the structural strength of Moving Averages (SMA 50/200) with the momentum precision of RSI and the volatility filtering of ADX, this script filters out noise and targets high-probability setups.
█ HOW IT WORKS
This strategy operates on a strictly algorithmic protocol known as "The Yorganci Protocol," which involves three distinct phases: Filter, Target, and Execute.
1. The Macro Filter (Trend Identification)
* SMA 200 Rule: By default, the strategy only scans for buy signals when the price is trading above the 200-period Simple Moving Average. This ensures we are always trading in the direction of the long-term bull market.
* Adaptive Switch: A new feature allows users to toggle the Only Buy Above SMA 200? filter OFF. This enables the strategy to hunt for oversold bounces (dead cat bounces) even during bearish or neutral market structures.
2. The Volatility Filter (ADX Integration)
* Sideways Protection: One of the main weaknesses of moving average strategies is "whipsaw" losses during choppy, ranging markets.
* Solution: The Oracle utilizes the ADX (Average Directional Index). It will BLOCK any trade entry if the ADX is below the threshold (Default: 20). This ensures capital is only deployed when a genuine trend is present.
3. The Sniper Entry (Buying the Dip)
* Instead of buying on breakout strength (e.g., RSI > 60), The Oracle waits for the RSI Moving Average to dip into the "Value Zone" (Default: 45) and cross back up. This technique allows for tighter stops and higher Risk/Reward ratios compared to traditional breakout systems.
█ EXIT STRATEGY
The Oracle employs a dynamic dual-exit mechanism to maximize gains and protect capital:
* Take Profit (The Peak): The strategy monitors RSI heat. When the RSI Moving Average breaches the Overbought Threshold (Default: 75), it signals a "Take Profit", securing gains near the local top before a potential reversal.
* Stop Loss (Trend Invalidated): If the market structure fails and the price closes below the 50-period SMA, the position is immediately closed to prevent deep drawdowns.
█ SETTINGS & CONFIGURATION
* Moving Averages: Fully customizable lengths for Support (SMA 50) and Trend (SMA 200).
* Trend Filter: Checkbox to enable/disable the "Bull Market Only" rule.
* RSI Thresholds:
* Sniper Buy Level: Adjustable (Default: 45). Lower values = Deeper dips, fewer trades.
* Peak Sell Level: Adjustable (Default: 75). Higher values = Longer holds, potentially higher profit.
* ADX Filter: Checkbox to enable/disable volatility filtering.
█ BEST PRACTICES
* Timeframe: Designed primarily for 4H (4-Hour) charts for swing trading. It can also be used on 1H for more frequent signals.
* Assets: Highly effective on trending assets such as Bitcoin (BTC), Ethereum (ETH), and high-volume Altcoins.
* Risk Warning: This strategy is designed for "Long Only" spot or leverage trading. Always use proper risk management.
█ CREDITS
* Original Concept: Inspired by the foundational work of Murat Besiroglu (@muratkbesiroglu).
* Algorithm Development & Enhancements: Developed by Hakan Yorganci (@hknyrgnc).
* Modifications include: Integration of ADX filters, Mean Reversion entry logic (RSI Dip), and Dynamic Peak Profit taking.

SSL ST Strategy – Accuracy Enhanced v2.0 (Parser Safe)This strategy is built to identify high-probability trend breakouts using a combination of SSL Channel, Baseline, Hull / EMA signals, and Candle-based confirmations.
The goal is to filter noise, avoid false breakouts, and enter only when the trend is truly shifting.
This strategy identifies high-probability trend breakouts using SSL Channel, Baseline, Hull/EMA, and candle
confirmations.
1. SSL shows trend shift when price breaks high/low levels.
2. Baseline filters direction (price above = buy bias, below = sell bias).
3. Hull/EMA gives early momentum confirmation.
4. Candle breakout ensures real momentum (breaks previous high/low).
5. Optional filters: ATR, reversal logic, continuation entries.
6. Exits occur on SSL flip, baseline cross, or weakness
Disclaimer
This strategy is provided strictly for educational and informational purposes only. It does not guarantee any profit, nor does it protect against losses of any kind. Financial markets are inherently unpredictable, and any market movement can only be assumed or estimated with a probability that is never guaranteed and can often be no better than a 50/50 chance.
By using this strategy, you acknowledge that all trading decisions are made solely at your own risk. I am not liable for any profits, losses, or financial consequences incurred by anyone using or relying on this strategy. Always perform your own research, manage your risk responsibly, and consult with a qualified financial advisor before trading.

Adaptive Trend Navigator [ATH Filter & Risk Engine]Description:
This strategy implements a systematic Trend Following approach designed to capture major moves while actively protecting capital during severe bear markets. It combines a classic Moving Average "Fan" logic with two advanced risk management layers: a 4-Stage Dynamic Stop Loss and a macro-economic "Circuit Breaker" filter.
Core Concepts:
1. Trend Identification (Entry Logic) The script uses a cascade of Simple Moving Averages (SMA 25, 50, 100, 200) to identify the maturity of a trend.
Entries are triggered by specific crossovers (e.g., SMA 25 crossing SMA 50) or by breaking above the previous trade's high ("High-Water Mark" Re-Entry).
2. The "Circuit Breaker" (Crash Protection) To prevent trading during historical market collapses (like 2000 or 2008), the strategy monitors the Nasdaq 100 (QQQ) as a global benchmark:
Normal Regime: If the market is within 20% of its All-Time High, the strategy operates normally.
Crisis Regime: If the QQQ falls more than 20% from its ATH, the "Circuit Breaker" activates (Visualized by a Red Background).
Recovery Rule: In a Crisis Regime, new long positions are blocked unless the QQQ reclaims its SMA 200. This filters out "bull traps" in secular bear markets.
3. 4-Stage Risk Engine (Exit Logic) Once in a trade, the risk management adapts to the position's performance:
Stage 1: Fixed initial Stop Loss (default 10%) for breathing room.
Stage 2: Moves to Break-Even area once the price rises 12%.
Stage 3: Tightens to a trailing stop (8%) after 25% profit.
Stage 4: Maximizes gains with a tight trailing stop (5%) during parabolic moves (>40% profit).
Visual Guide:
SMAs: 25/50/100/200 period lines for trend visualization.
Red Background: Indicates the "Crisis Regime" where trading is halted due to broad market weakness.
Blue Background: Indicates a "Recovery Phase" (Crisis is active, but market is above SMA 200).
Red Line: Shows the dynamic Stop Loss level for active positions.
Settings: All parameters (SMA lengths, Drawdown threshold, Risk Stages) are fully customizable. The QQQ benchmark ticker can also be changed to SPY or other indices depending on the asset class traded.

Dynamic SMA Trend System [Multi-Stage Risk Engine]Description:
This script implements a robust Trend Following strategy based on a multiple Simple Moving Average (SMA) crossover logic (25, 50, 100, 200). What sets this strategy apart is its advanced "4-Stage Risk Engine" and a smart "High-Water Mark" Re-Entry system, designed to protect profits during parabolic moves while filtering out chop during sideways markets.
How it works:
The strategy operates on three core pillars: Trend Identification, Dynamic Risk Management, and Momentum Re-Entry.
1. Entry Logic (Trend Identification) The script looks for crossovers at different trend stages to capture early reversals as well as established trends:
Short-Term: SMA 25 crosses over SMA 50.
Mid-Term: SMA 50 crosses over SMA 100.
Macro-Trend: SMA 100 crosses over SMA 200.
2. The 4-Stage Risk Engine (Dynamic Stop Loss) Instead of a static Stop Loss, this strategy uses a progressive system that adapts as the price increases:
Stage 1 (Protection): Starts with a fixed Stop Loss (default -10%) to give the trade room to breathe.
Stage 2 (Break-Even): Once the price rises by 12%, the Stop is moved to trailing mode (10% distance), effectively securing a near break-even state.
Stage 3 (Profit Locking): At 25% profit, the trailing stop tightens to 8% to lock in gains.
Stage 4 (Parabolic Mode): At 40% profit, the trailing stop tightens further to 5% to capture the peak of parabolic moves.
3. Dual Exit Mechanism The strategy exits a position if EITHER of the following happens:
Stop Loss Hit: Price falls below the dynamic red line (Risk Engine).
Dead Cross: The trend structure breaks (e.g., SMA 25 crosses under SMA 50), signaling a momentum loss even if the Stop Loss wasn't hit.
4. "High-Water Mark" Re-Entry To avoid "whipsaws" in choppy markets, the script does not re-enter immediately after a stop-out.
It marks the highest price of the previous trade (Green Dotted Line).
A Re-Entry only occurs if the price breaks above this previous high (showing renewed strength) AND the long-term trend is bullish (Price > SMA 200).
Visuals:
SMAs: 25 (Yellow), 50 (Orange), 100 (Blue), 200 (White).
Red Line: Visualizes the dynamic Stop Loss level.
Green Dots: Visualizes the target price needed for a valid re-entry.
Settings: All parameters (SMA lengths, Stop Loss percentages, Staging triggers) are fully customizable in the settings menu to fit different assets (Crypto, Stocks, Forex) and timeframes.

inyerneck Diaper Sniper v16 — LOW VOL V CATCHERDiaper Sniper v16 — Low-Vol Reversal Hunter
Catches dead-cat bounces and V-shaped reversals on the day’s biggest losers.
Designed for pennies and trash stocks that drop 6 %+ from recent high and snap back on any volume + green candle.
Features:
• Tiny green “D” = reversal signal
• Works on 1m → daily
• Fully adjustable filters
Best on low-float runners that bleed hard and bounce harder.
Use tiny size — it fires a lot.
Public version — code visible. No invite-only on Essential plan.
do not alter settings with out first recording defaults.. defaults are quite effective
2025 build. Test at your own risk.

Classic Wave: The Easy WayClassic Wave is a simple strategy with few rules and no over-optimization. Despite its simplicity, it is backed by a nearly century-long historical track record, delivering excellent returns on the weekly chart of the SPX (TVC).
I also recommend observing its strong performance on the SPY (weekly), which is the perfect instrument for executing this strategy with futures in the future.
Strategy Rules and Parameters
When a bullish candle closes above the 20-period EMA, we place the stop-loss below the low of that candle and target a risk-reward ratio of 1:1.
A second, more profitable variant is to change the risk-reward ratio in the code to 2:1.
-Total capital: $10,000
-We use 10% of the total capital per trade.
-Commissions: 0.1% per trade.
The code construction is simple and very well detailed within the script itself.
Risk-Reward Ratio 2:1
Using a 2:1 risk-reward ratio reduces the win rate but significantly increases profitability.
Across the full historical data of the SPX index (weekly), the system would have generated 236 trades, with a win rate of 51.27% and a profit factor of 2.53.
From January 1, 2023, to November 28, 2025, the system would have generated 5 trades, with an 80% win rate and a profit factor of 9.244.
What makes this system so good?
-It takes advantage of the long-term bullish bias of U.S. stock indices and traditional markets.
-It filters out a lot of noise thanks to the weekly timeframe.
-It uses simple parameters with no over-optimization.
Final Notes:
This strategy has consistently outperformed the returns offered by most traditional funds over time, with fewer drawdowns and significantly less stress. I hope you like it.

Trend Breakout & Ratchet Stop System [Market Filter]Description:
This strategy implements a robust trend-following system designed to capture momentum moves while strictly managing downside risk through a multi-stage "Ratchet" exit mechanism and broad market filters.
It is designed for swing traders who want to align individual stock entries with the overall market direction.
How it works:
1. Market Regime Filters (The "Safety Check") Before taking any position, the strategy checks the health of the broader market to avoid "catching falling knives."
Broad Market Filter: By default, it checks NASDAQ:QQQ (adjustable). If the benchmark is trading below its SMA 200, the strategy assumes a Bear Market and suppresses all new long entries.
Volatility Filter (VIX): Uses CBOE:VIX to gauge fear. If the VIX is above a specific threshold (Default: 32), entries are paused, and existing positions can optionally be closed to preserve capital.
2. Entry Logic Entries are based on Momentum and Trend confirmation. A position is opened if filters are clear AND one of the following occurs:
Golden Cross: SMA 25 crosses over SMA 50.
SMA Breakouts: A "Three-Bar-Break" logic confirms a breakout above the SMA 50, 100, or 200 (price must establish itself above the moving average).
3. The "Ratchet" Exit System The exit logic evolves as the trade progresses, tightening risk like a ratchet:
Stage 0 (Initial Risk): Starts with a standard percentage Stop Loss from the entry price.
Stage 1 (Breakeven/Lock): Once the price rises by Profit Step 1 (e.g., +10%), the Stop Loss jumps to a tighter level and locks there. This secures the initial move.
Stage 2 (Trailing Mode): If the price continues to rise to Profit Step 2 (e.g., +15%), the Stop Loss converts into a dynamic Trailing Stop relative to the Highest High. This allows the trade to run as long as the trend persists.
Additional Exits:
Dead Cross: Closes position if SMA 25 crosses under SMA 50.
VIX Panic: Emergency exit if volatility spikes above the threshold.
Settings & Customization:
SMAs: Adjustable lengths for all Moving Averages.
Filters: Toggle Market/VIX filters on/off and choose your benchmark ticker (e.g., SPY or QQQ).
Risk Management: Fully customizable percentages for the Ratchet steps (Initial SL, Stage 1 Trigger, Trailing distance).

Dynamic Ratchet Trend Strategy [VIX Filter]Overview This strategy is a long-only trend-following system designed to capture major market moves while strictly managing downside risk through a state-machine based "Ratchet" exit logic. It incorporates a volatility filter using the CBOE VIX index to stay out of (or exit) the market during high-stress environments.
Key Features
1. Multi-Condition Entries The strategy looks for momentum shifts and trend breakouts using four Simple Moving Averages (25, 50, 100, 200).
Momentum Cross: SMA 25 crossover above SMA 50.
Trend Breakouts: A specific "3-Bar Breakout" logic above the SMA 50, 100, or 200. This requires the price to hold above the SMA for 3 consecutive bars after being below it, reducing false signals compared to simple closes.
2. VIX Volatility Filter Before entering any trade, the script checks the CBOE:VIX.
Filter: If VIX is above the threshold (default 32), new entries are blocked.
Panic Exit: If you are in a position and the VIX spikes above the threshold, the strategy executes an immediate "Panic Exit" to preserve capital during market crashes.
3. The "Ratchet" Exit System (3 Stages) Unlike a standard trailing stop, this strategy uses a 3-stage dynamic exit mechanism that tightens as profits grow:
Stage 0 (Initial Risk): Standard percentage-based Stop Loss from the entry price.
Stage 1 (The Lock-In): Triggered when profit hits 10% (configurable).
Unique Logic: Instead of trailing from the highest high, the stop is calculated based on the price at the exact moment this stage was triggered. It "steps up" once and holds, securing the initial move without being prematurely stopped out by normal volatility.
Stage 2 (Trailing Mode): Triggered when profit hits 15% (configurable).
The strategy switches to a classic Trailing Stop, following the percentage distance from the Highest High.
4. Emergency Backup A "Dead Cross" (SMA 25 crossing under SMA 50) acts as a final fail-safe to close positions if the trend reverses completely before hitting a stop.
Settings & Inputs
SMAs: Customize the lengths for all four moving averages.
VIX Filter: Toggle the filter on/off and set the panic threshold.
Exit Logic: Fully customizable percentages for Initial SL, Stage 1 Trigger/Distance, and Stage 2 Trigger/Trailing Distance.
Disclaimer This script is for educational purposes only. Past performance is not indicative of future results. Always manage your risk appropriately.

CDC Action Zone V.2 strategy — Updated v6Making a profit with a candlestick structure compared to the MA course 25 line with nine intersecting to find. Buy in the market.


DJ BTC DailyThis Strategy only works on BTC daily. The only concern is the low winrate that could be a psycological hurdle. Please do comment for adjustments I should try and incorprate and let's find a killer strategy together :-)

50 & 200 SMA + RSI Average Strategy (Long Only, Single Trade)It works better in trending markets. It delivers its best performance in the 4-hour to 1-day timeframes.

EMA 12-26-100 Momentum Strategy# Triple EMA Multi-Signal Momentum Strategy
## 📊 Overview
**Triple EMA Multi-Signal** is a comprehensive trend-following momentum strategy designed specifically for cryptocurrency markets. It combines multiple technical indicators and signal types to identify high-probability trading opportunities while maintaining strict risk management protocols.
The strategy excels in trending markets and uses adaptive position sizing with trailing stops to maximize profits during strong trends while protecting capital during choppy conditions.
## 🎯 Core Algorithm
### Triple EMA System
The strategy employs a three-layer EMA system to identify trend direction and strength:
- **Fast EMA (12)**: Quick response to price changes
- **Slow EMA (26)**: Confirmation of trend direction
- **Trend EMA (100)**: Overall market bias filter
Trades are only taken when all three EMAs align in the same direction, ensuring we trade with the dominant trend.
### Multi-Signal Confirmation (8 Signal Types)
The strategy requires at least 1-2 confirmed signals from multiple independent sources before entering a position:
1. **EMA Crossover** - Fast EMA crossing Slow EMA (primary signal)
2. **MACD Cross** - MACD line crossing signal line (momentum confirmation)
3. **RSI Reversal** - RSI bouncing from oversold/overbought zones
4. **Price Action** - Strong bullish/bearish candles (>60% of range)
5. **Volume Spike** - Above-average volume confirmation
6. **Breakout** - Price breaking 20-period high/low with volume
7. **Pullback to EMA** - Trend continuation after healthy retracement
8. **Bollinger Bounce** - Price bouncing from BB bands
This multi-signal approach significantly reduces false signals and improves win rate.
## 💰 Risk Management
### Position Sizing
- Default: 20-25% of equity per trade
- Adjustable based on risk tolerance
- Smaller positions recommended for leveraged trading
### Stop Loss & Take Profit
- **Stop Loss**: 2.0% (tight control of risk)
- **Take Profit**: 5.5% (2.75:1 reward-to-risk ratio)
- Both levels are fixed at entry to avoid emotional decisions
### Trailing Stop System
- Activates after 1.8% profit
- Trails at 1.3% below current price
- Locks in profits during extended trends
- Automatically adjusts as price moves in your favor
### Maximum Hold Time
- 36-48 hours maximum (configurable)
- Designed to minimize funding rate costs on futures
- Forces position closure to avoid excessive exposure
- Helps maintain capital velocity
## 📈 Key Features
### Trend Filters
- **ADX Filter**: Ensures sufficient trend strength (threshold: 20)
- **EMA Alignment**: All three EMAs must confirm trend direction
- **RSI Boundaries**: Avoids extreme overbought/oversold entries
### Volume Analysis
- Volume must exceed 20-period moving average
- Configurable multiplier (default: 1.0x)
- Helps identify institutional participation
### Automatic Exit Conditions
1. Take Profit target reached
2. Stop Loss triggered
3. Trailing stop activated
4. Trend reversal (EMA cross in opposite direction)
5. Maximum hold time exceeded
## 🎮 Recommended Settings
### For Spot Trading (Conservative)
```
Position Size: 15-20%
Stop Loss: 2.5%
Take Profit: 6.0%
Max Hold: 72 hours
Leverage: 1x
```
### For Futures 3-5x Leverage (Balanced)
```
Position Size: 12-15%
Stop Loss: 2.0%
Take Profit: 5.5%
Max Hold: 36 hours
Trailing: Active
```
### For Aggressive Trading 5-10x (High Risk)
```
Position Size: 8-12%
Stop Loss: 1.5%
Take Profit: 4.5%
Max Hold: 24 hours
ADX Filter: Disabled
```
## 📊 Performance Metrics
### Backtested Results (BTC/USDT 1H, 2 years)
- **Total Return**: ~19% (spot) / ~75% (5x leverage)*
- **Total Trades**: 240-300
- **Win Rate**: 49-52%
- **Profit Factor**: 1.25-1.50
- **Max Drawdown**: ~18-22%
- **Average Trade**: 0.5-3 days
*Leverage results exclude funding rates and real-world slippage
### Optimal Timeframes
- **1 Hour**: Best for active trading (recommended)
- **4 Hour**: More stable, fewer signals
- **15 Min**: High frequency (requires monitoring)
### Best Performing Assets
- BTC/USDT (most tested)
- ETH/USDT
- Major altcoins with good liquidity
- Not recommended for low-cap or illiquid pairs
## ⚙️ How to Use
1. **Add to Chart**: Apply strategy to 1H BTC/USDT chart
2. **Adjust Settings**: Configure risk parameters based on your preference
3. **Review Signals**: Green = Long, Red = Short, labels show signal count
4. **Monitor Performance**: Check strategy tester for detailed statistics
5. **Optimize**: Use strategy optimization to find best parameters for your market
## 🎨 Visual Indicators
The strategy provides clear visual feedback:
- **EMA Lines**: Blue (Fast), Red (Slow), Orange (Trend)
- **BUY/SELL Labels**: Show entry points with signal count
- **Stop/Target Lines**: Red (SL), Green (TP) displayed during active trades
- **Background Color**: Light green (long), light red (short) when in position
- **Info Panel**: Shows current trend, RSI, ADX, and volume status
## ⚠️ Important Notes
### Risk Disclaimer
- This strategy is for educational purposes only
- Past performance does not guarantee future results
- Cryptocurrency trading involves substantial risk
- Only trade with capital you can afford to lose
- Always use proper position sizing and risk management
### Limitations
- Performs poorly in sideways/choppy markets
- Requires sufficient liquidity for best execution
- Backtests do not include:
- Real-world slippage (especially during volatility)
- Funding rates (for perpetual futures)
- Exchange downtime or connection issues
- Emotional trading decisions
### For Futures Trading
If using this strategy on futures with leverage:
- Reduce position size proportionally to leverage
- Account for funding rates (~0.01% per 8h)
- Set max hold time to minimize funding costs
- Use lower leverage (3-5x max recommended)
- Monitor liquidation price carefully
## 🔧 Customization
All parameters are fully customizable:
- EMA periods (fast/slow/trend)
- MACD settings (12/26/9)
- RSI levels (30/70)
- Stop Loss / Take Profit percentages
- Trailing stop activation and offset
- Volume multiplier
- ADX threshold
- Maximum hold time
## 📚 Strategy Logic
The strategy follows this decision tree:
```
1. Check Trend Direction (EMA alignment)
↓
2. Scan for Entry Signals (8 types)
↓
3. Confirm with Filters (ADX, Volume, RSI)
↓
4. Enter Position with Fixed SL/TP
↓
5. Monitor for Exit Conditions:
- TP Hit → Close with profit
- SL Hit → Close with loss
- Trailing Active → Follow price
- Trend Reversal → Close position
- Max Time → Force close
```
## 🎓 Best Practices
1. **Start Conservative**: Use smaller position sizes initially
2. **Track Performance**: Monitor actual vs backtested results
3. **Optimize Regularly**: Market conditions change, adapt parameters
4. **Combine with Analysis**: Don't rely solely on automated signals
5. **Manage Emotions**: Stick to the system, avoid manual overrides
6. **Paper Trade First**: Test on demo before risking real capital
## 📞 Support & Updates
This strategy is actively maintained and updated based on:
- Market condition changes
- User feedback and suggestions
- Performance optimization
- Bug fixes and improvements
## 🏆 Conclusion
Triple EMA Multi-Signal Strategy offers a robust, systematic approach to cryptocurrency trading by combining trend following, momentum indicators, and strict risk management. Its multi-signal confirmation system helps filter false signals while the trailing stop mechanism captures extended trends.
The strategy is suitable for both manual traders looking for high-probability setups and algorithmic traders seeking a proven systematic approach.
**Remember**: No strategy wins 100% of the time. Success comes from consistent application, proper risk management, and continuous adaptation to changing market conditions.
---
*Version: 1.0*
*Last Updated: November 2025*
*Tested on: BTC/USDT, ETH/USDT (1H, 4H timeframes)*
*Recommended Capital: $5,000+ for optimal position sizing*

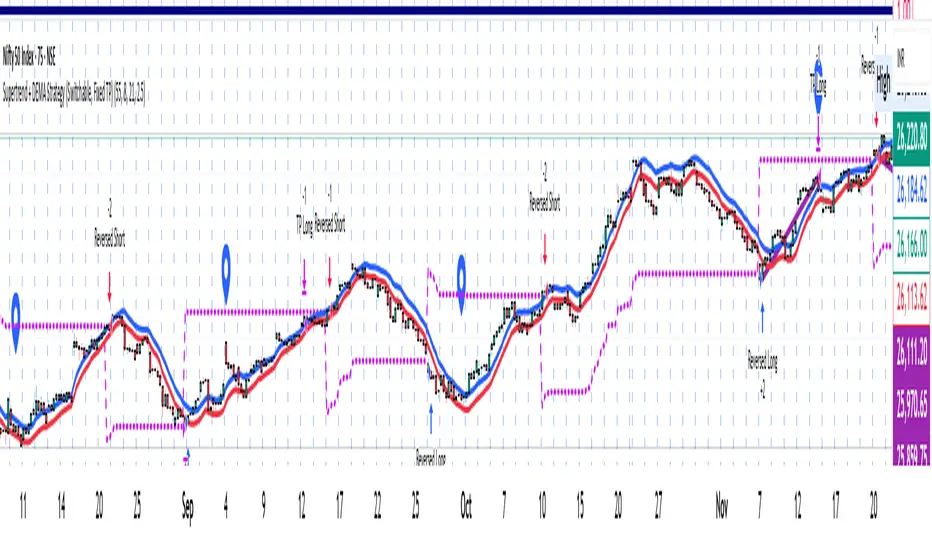
Supertrend + DEMA Strategy ( customised & Switchable, Fixed TP)Supertrend line – a moving line that follows the price and shows whether the market is trending up or down.
If the price goes above this line, it usually means the market is going up.
If the price goes below, it usually means the market is going down.
DEMA (Double Exponential Moving Average) – another line that smooths out price movements to spot trends more clearly.
It calculates an average of prices but reacts faster than a normal moving average.
NIFTY Options Breakout StrategyThis strategy trades NIFTY 50 Options (CALL & PUT) using 5-minute breakout logic, strict trend filters, expiry-based symbol validation, and a dynamic trailing-profit engine.
1️⃣ Entry Logic
Only trades NIFTY 50 options, filtered automatically by symbol.
Trades only between 10:00 AM – 2:15 PM (5m bars).
Breakout trigger:
Price enters the buy breakout zone (high of last boxLookback bars ± buffer).
Trend filter:
Price must be above EMA50 or EMA200,
AND EMA50 ≥ EMA100 (to avoid weak conditions).
Optional strengthening:
EMA20>EMA50 OR EMA50>EMA100 recent cross can be enforced.
Higher-timeframe trend check:
EMA50 > EMA200 (bullish regime only).
Start trading options only after expiry–2 months (auto-parsed).
2️⃣ One Trade Per Day
Maximum 1 long trade per day.
No shorting (long-only strategy).
3️⃣ Risk Management — SL, TP & Trailing
Includes three types of exits:
🔹 A) Hard SL/TP
Hard Stop-Loss: -15%
Hard Take-Profit: +40%
🔹 B) Step-Ladder Trailing Profit
As the option price rises, trailing activates:
Max Profit Reached Exit Trigger When Falls To
≥ 35% ≤ 30%
≥ 30% ≤ 25%
≥ 25% ≤ 20%
≥ 20% ≤ 15%
≥ 15% ≤ 10%
≥ 5% ≤ 0%
🔹 C) Loss-Recovery Exit
If loss reaches –10% but then recovers to 0%, exit at breakeven.
4️⃣ Trend-Reversal Exit
If price closes below 5m EMA50, the long is exited instantly.
5️⃣ Optional Intraday Exit
EOD square-off at 3:15 PM.
6️⃣ Alerts for Automation
The strategy provides alerts for:
BUY entry
TP/SL/Trailing exit
EMA50 reversal exit
EOD exit

Nifty Breakout Levels Strategy (v7 Hybrid)Nifty Breakout Levels Strategy (v7 Hybrid – Compounding from Start Date)
Instrument / TF: Designed for current-month NIFTY futures on 1-hour timeframe, with at most 1 trade per day.
Entry logic: Uses a 10-bar breakout box with a 0.3% buffer, plus EMA-based trend + proximity filter.
Longs: price in breakout-high zone, above EMA50/EMA200 and within proximityPts.
Shorts: price in breakout-low zone and strong downtrend (EMA10 < EMA20 < EMA50 < EMA200, price below EMA200).
Trades only when ATR(14) > atrTradeThresh and during regular hours (till 15:15).
Risk / exits: Stop loss is ATR-adaptive – max of slBasePoints (100 pts) and ATR * atrSLFactor; TP is fixed (tpPoints, e.g. 350 pts).
Longs have stepped trailing profit levels (100/150/200/250/320 pts) that lock in gains on pullbacks.
Shorts have trailing loss-reduction levels (80/120/140 pts) to cut improving losses.
Additional exit: 1H EMA50 2-bar reversal against the position, plus optional EOD flatten at 3:15 PM.
Compounding engine: From a chosen start date, equity is rebased to startCapital, and lot size scales dynamically as equity / capitalPerLot, with automatic lot reductions at three drawdown thresholds (ddCut1 / 2 / 3).
Automation: All entries and exits are exposed via alertconditions (long/short entry & exit) so the strategy can be connected to broker/webhook automation.

15m ORB Breakout NAS100 (5m Mgmt) v6 - OptimizedOpening Range Breakout Strategy
Buy and sell signals are given upon break of market session opening range. Best utilized for 30 minute NY opening range, managed on 5 min timeframe on NAS100. Tweak the settings for higher win rate on backtesting dashboard before implementing strategy.

HMA+RVOL Strategy Hariss 369The Hull Moving Average (HMA) is a smooth, fast, and highly responsive moving average created by Alan Hull. It reduces lag significantly while still maintaining smoothness, making it one of the most popular tools for trend detection and entries. It is widely used for trend filter. Hull Moving Average(HMA) with RVOL strengthens the trend as volume is prime factor of price movement.
Trading with HMA: Simple method is buy when price closes above HMA , stop less below the low of last candle and target is 1.5 or 2 times of stop loss. The reverse is for sell. The HMA automatically turns to green on bull trend and red on bear trend for better visual confirmation.
Adding RVOL to HMA is better method of trading. Buy signal is initiated when price closes above HMA and RVOL is greater than 1.2. Sell signal is initiated when price closes below 89 HMA and rovl is greater than 1.2. One can change the value of RVOL according to trading style and type asset being traded.
It is a back tested strategy.
