[KL] Double Bollinger Bands Strategy (for Crypto/FOREX)This strategy uses a setup consisting of two Bollinger Bands based on the 20 period 20-SMA +/-
(a) upper/lower bands of two standard deviations apart, and
(b) upper/lower bands of one standard deviation apart.
We consider price at +/- one standard deviation apart from 20-SMA as the "Neutral Zone".
If price closes above Neutral Zone after a period of consolidation, then it's an opportunity for entry. Strategy will long, anticipating for breakout.
The illustration below shows price closing above the Neutral Zone after a period of consolidation.
a.c-dn.net
Position is exited when prices closes at Neutral Zone (being lower than prior bars)
Médias Móveis

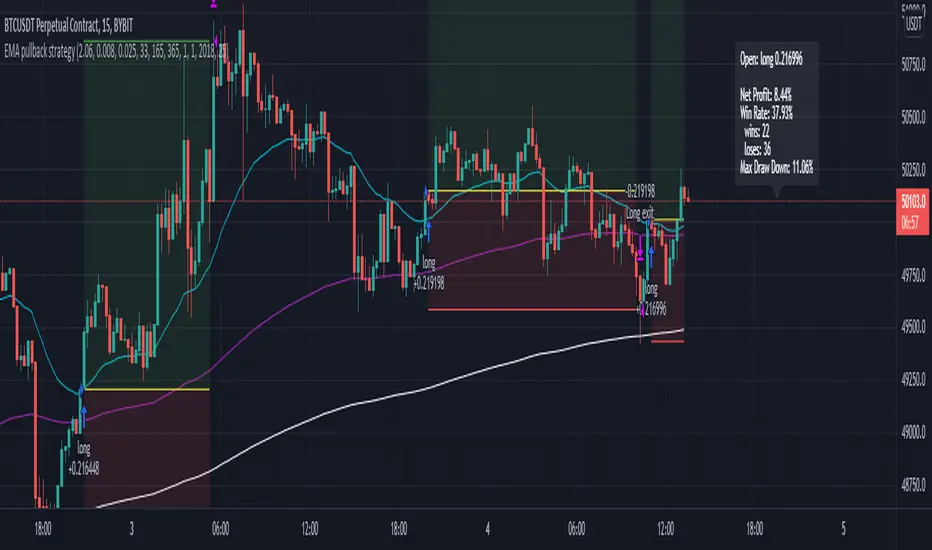
EMA pullback strategyA solid EMA pullback strategy for cryptos 15 min chart that uses EMA crossing as signal and pullback as stop loss.
EMA1: shortest period for finding crossing (I find period = 33 profitable for BTCUSD, you can adjust it for other cryptos)
EMA2: 5x period of EMA1, for filtering out some trend reversals
EMA3: 11x period of EMA1, for determining trend direction
Rules are:
Long:
close price > EMA3
EMA1 > EMA3
close price pullbacks below EMA1 and then crosses up EMA1, enter at the first close price above EMA1
lowest pullback close price < EMA2 at the cross up
Short:
close price < EMA3
EMA1 < EMA3
close price pullbacks above EMA1 and then crosses down EMA1, enter at the first close price below EMA1
highest pullback close price > EMA2 at the cross down
Stop-loss at lowest/highest pullback price for long/short
Take profit = 2x stop-loss
Risk management: risk range can be set in the inspector. If the risk is lower than the range, the trade is not taken. if the risk is higher than the range, the position size is adjusted to keep the risk within range.
Qullamaggie Breakout V2After publishing the Qullamaggie Breakout script and seeing that it had some decent results, I wanted to explore it a bit further. There were a few things I didn't like about that methodology that didn't really jive with the way I like to trade. So what I did was combined the Breakout Trend Follower strategy I had been using for entries with the Qullamaggie strategy for trailing stops once in profit. The results seem pretty good to me and an approach that fits my personality and something I can actually trade. Typically better profit than the Breakout Trend Follower by giving more room for your winners to run, while still protecting your entries by moving up the trailing stop until you are in profit, all while taking less trades, so that's great.
Everything is done with stop orders. So you set your buy stop at the recent swing high point and wait for a breakout. Once in a position you set your sell stop at the recent swing low point. The most recent swing high and low are shown on the chart for easy reference with the blue and orange horizontal lines. Once in a trade, trail your sell stop after a new swing low is registered (shown by the thicker orange stop line). Once you are in profit, leave that hard stop level there (the orange line will stay there helping you). Now, you wait for price to cross a Moving Average of your choosing (default is Daily 10 MA). Once the bar crosses that moving average, you move your stop to the low of that candle (shown by the blue stop line) and trail your stop along every crossing of the moving average until the trend changes and takes out your stop. So managing this trade is pretty easy...just wait for the stop lines to move and move your stop with them. It's a great way to trade when you can't be at your computer all the time because the stop orders take care of execution on both buy and sell side. If you use a daily timeframe for your moving averages (the default), you really only need to move stops around about once a day, so is a good part time trader's strategy in my opinion.
The best opportunities will come by scanning for stocks in the longer term timeframe of your moving averages. Wait for a consolidation on that timeframe so the anticipated breakout has some room to run. Once you've identified a good candidate, zoom in to your lower timeframe where the swing highs/lows will act as your entry and exit points, all while keeping the moving averages consistent between timeframes.
Hope you guys find it useful.
A few options available:
- Choose any timeframe for your moving averages, while using swing high/low points on intraday charts.
- Choose one of two moving averages shown for your trailing stops (default 10 and 20 MA).
- Choose to use the third moving average as a filter for keeping you out of trades that are below it (trading with the trend).
- Use the charts resolution candle or the moving average resolution candle for the moving average trailing stop.
- Only take trades where your buy level minus stop level is below a % of the Average Daily Range (ADR). This allows you to potentially have better risk/reward. I added a little table that shows the ADR of the stock/ticker as well as the range between the recent buy and sell levels (shown by the orange and blue horizontal lines) for easy reference.

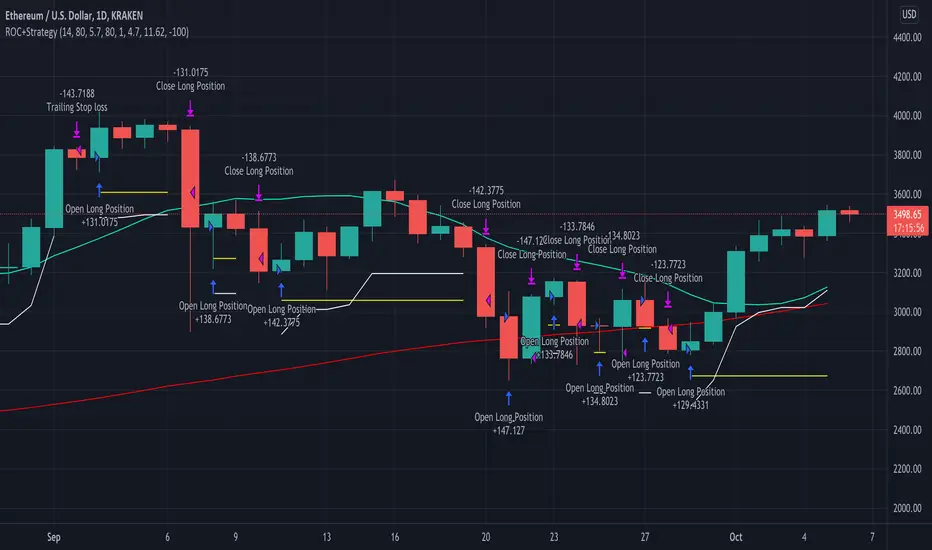
Rate of Change StrategyThis strategy calculates the rate of change over time to determine buy/sell points. This strategy is best run with 1 hour candles .
Configurable values:
SMA Fast (days)
SMA Slow (days)
SMA Reference (days)
ROC Low (%)
ROC High (%)
Order Stake (%)
Look back Candles
Optimized Keltner Channels SL/TP Strategy for BTCThis strategy is optimized for Bitcoin with the Keltner Channel Strategy, which is TradingView's built-in strategy. In the original Keltner Channel Strategy, it was difficult to predict the timing of entry because the Buy and Sell signals floated in the middle of the candle in real time. This strategy is convenient because if the bitcoin price hits the top or bottom of the Keltner Channel and closes the closing price, you can enter Buy or Sell at the next candle start price. In addition, this strategy provides Stop Loss and Take Profit functions to maximize profit.
_________________________________
Recommended settings are below.
- length: 9
- multiplier: 1
- source: close
- (v) Use EMA
- Bands Style: Average True Range
- ATR Length: 19
- Stop Loss (%): 20
- Take Profit (%) : 20
_________________________________
- length: 9
- multiplier: 1
- source: close
- (v) Use EMA
- Bands Style: Average True Range
- ATR Length: 18
- Stop Loss (%): 20
- Take Profit (%) : 5
_________________________________
▶ Usefulness and Originality
- Stop Loss and Take Profit functions are available
- Convenient Buy and Sell entry compared to the original Keltner Channel Strategy
- Optimized for BTCUSD market (maximizing profits)
___________________________________________
이 전략은 TradingView의 Built-in 전략인 Keltner Channel Strategy를 비트코인에 맞게 최적화되었습니다. 기존의 Keltner Channel Strategy는 Buy, Sell 신호가 캔들 중간에 실시간으로 떠서 진입 시점을 예측하기 어려운 불편함이 있었지만 이 전략은 비트코인 가격이 Keltner Channel 상단 혹은 하단을 찍고 종가를 마감하면 그 다음 캔들 시작가에서 Buy 혹은 Sell 진입이 가능하여 편리합니다. 또한, 이 전략은 Keltner Channel을 만나서 캔들을 마감한 가격 (bprice, sprice)을 시각적으로 plot을 제공하여 타점 및 차트를 보기에 편리하며 손절가 및 목표가를 지정한 백테스팅이 가능합니다.

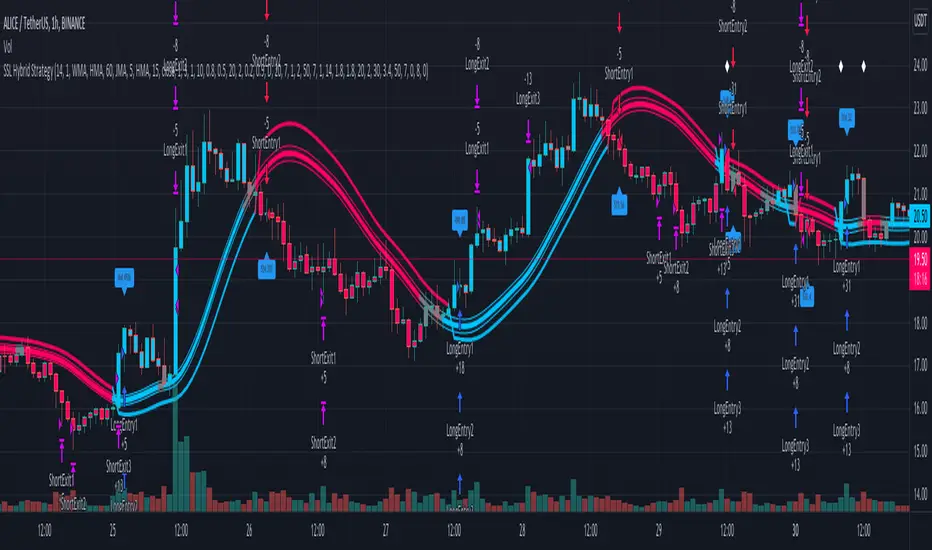
SSL Hybrid Exit Arrow StrategyBasic concept: Use the SSL Hybrid indicator's EXIT ARROWS to determine trade entry and exit points.
Rules:
Enter LONG trades on BLUE exit arrows
Enter SHORT trades on RED exit arrows
Uses up to 3 DCA orders for trade entry
Sets a stop loss
Does not set any take profit. Relies on opposing arrow to exit current position
When filters are set it affects opening of positions, but opposing arrow will always exit trades regardless of filtering options set
Additional filtering configuration:
If the SSL filter checkbox is checked, then LONG positions can only be opened when SSL1 is below the baseline lower and SHORT positions can only be opened when the SSL1 is above the baseline upper
If the QQE MOD checkbox is checked, then LONG positions can only be opened when QQE MOD histogram bars are BLUE and the QQE MOD line is ABOVE 0 and SHORT positions can only be opened when the QQE MOD histogram bars are RED and the QQE MOD line is BELOW 0
Both SSL and QQE MOD filters may be combined to give stricter filtering, however I find it often prevents entry to too many good trades

SMA Offset StrategyThis strategy uses simple moving averages and some math to determine buy/sell points. We keep a SMA 100 day line as our basis for our offset. If the close price is below the line, we choose our open position based on how low below the line it is goes, this value (Low Offset) is a percentage and can be configured by the user. Same for closing your position, when the close is above our SMA 100 line, we determine how high above the line before selling. If we try to sell too early (while the price is still rising), the trailing stop loss will kick in. Backtested with Bitcoin and Ethereum.
Configurable variables:
SMA Fast (default is 14 days)
SMA Slow (default is 100)
SMA Reference (default is 30)
Low Offset % (default is 0.001)
High Offset % (default is 0.0164)
Order Stake % (default is 0.96)
Trailing stop loss % (default is 1.35)

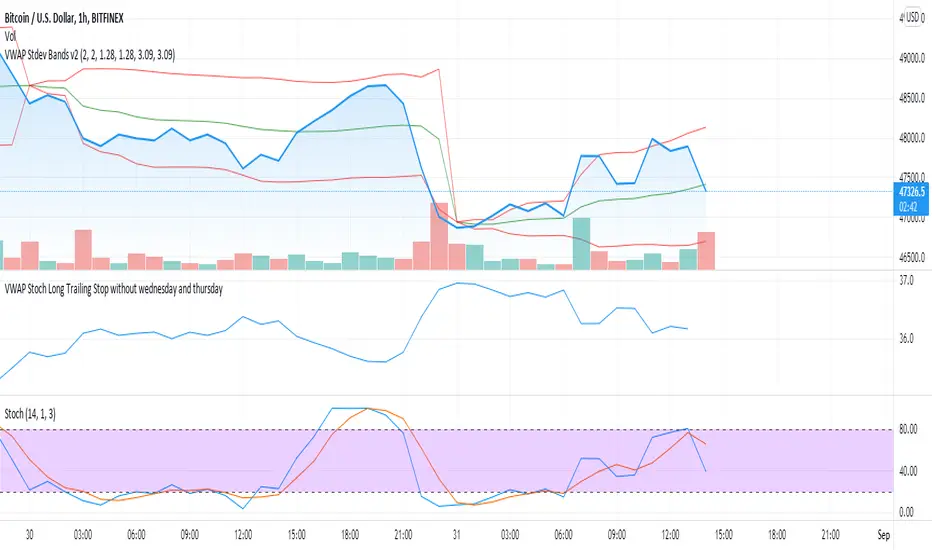
VWAP Stoch Long Trailing Stop without wednesday and thursdaySimple trading strategy based on VWAP and Stochastic indicators and a 3% trailing stop.
After backtesting, wednesdays and thursdays seemed to be bad entry days so they are blacklisted.
Advanced OutSide with HMA and Klinger Forex Swing strategyThis is a swing forex strategy, adapted for big timeframes, such as 4h+.
For this example I adapted the strategy to EUR USD main forex pair.
Its components are:
Outside condition
Klinger Oscillator
Hull moving average
Rules for entry
For long: if current high is bigger than previous high and current is smaller than previous low and klinger is positive, close of the candle is above lsma and we have a bull candle.
For short: if current high is smaller than previous high and current is bigger than previous low and klinger is negative, close of the candle is below lsma and we have a bear candle.
Rules for exit
We exit when we have a reverse condition
We exit in case we hit the tp/sl based on % movement of the price.
If you have any questions, let me know !

SSL Hybrid StrategyStrategy based on the SSL Hybrid indicator by Mihkel00
Designed for the purpose of back testing
Strategy:
Enters both long and short trades based on SSL1 crossing the baseline
Stop Loss calculated based on ATR multiplier
Option to allow moving of Stop Loss to break even on TP1
Option to turn off Stop Loss and Take Profit which will rely on indicator flip to exit from position
Take Profits configurable with up to 5 ATR multipliers and exits percentages (percentages calculated as percentages of original position size, eg. 100 tokens with 3 TPs of 20, 30, 50 would exit the same number of tokens on each TP)
Credits:
SSL Hybrid Mihkel00 www.tradingview.com
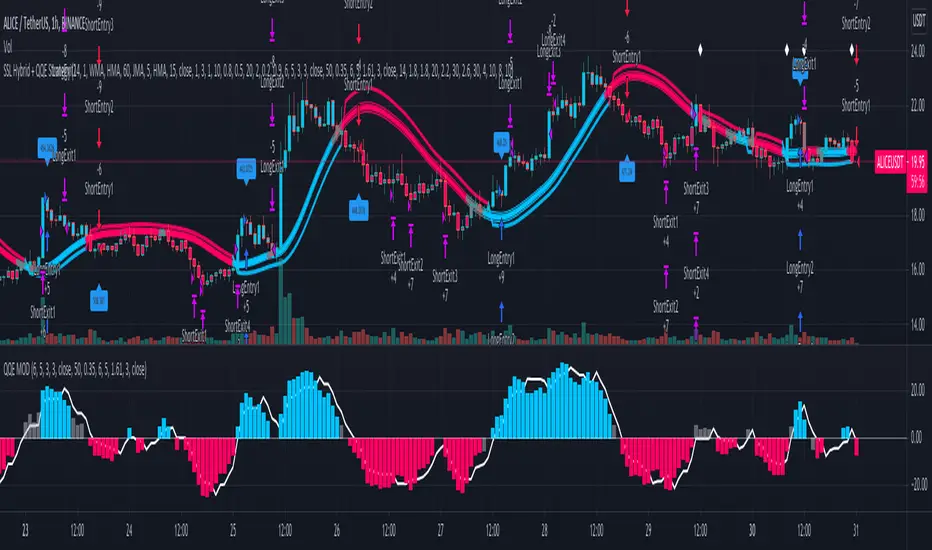
SSL Hybrid + QQE StrategySSL Hybrid strategy combining QQE MOD as trade entry filter.
Rules to enter LONG:
SSL1 is under lower baseline lower
QQE histogram bar is blue
QQE line is above 0
Rules to enter SHORT:
SSL1 is under above baseline upper
QQE histogram bar is red
QQE line is below 0
Bagheri IG EtherThis is a technical trading strategy for Ethereum ( BINANCE:ETHUSDT ). We built and developed it on MetaEditor and optimized it with MetaTrader optimizer.
The main indicators are Donchian Channel, Oscillator of ROC, Bears Power, Balance of Power, and Simple Moving Average (SMA). Default values in the input panel are the best combination of these indicators, but you can change any of them and try it for better results.
Please notice that this strategy has been optimized on the 1-minute chart of Ethereum.
For each position, you can see the Take Profit (TP) and Stop Loss (SL) levels. Also, you can find the values of mentioned TP and SL in points from the input panel of the script.
Attention: The price of Ethereum has 2 decimal places.
Therefore, 3000 points for TP means 30 USDT for trading 1 BINANCE:ETHUSDT .

Long TermThe Strategy is to buy based on Stan which is long term strategy on stocks. This works on 30WEEK And RSI indicator which helps to understand when to enter stock and when not to.
Additionally due to fast moving trades, added logic of crossover of close price above 50DMA

Long only EMA CROSS 8/50/200 BacktestImprove EMA CROSS 8/50/200 with adjustable Exit EMA Level, and can open trade only when above EMA200

Crypto swing correlation RSI and SMAThis is a crypto swing strategy, designed for long term periods and correlated pairs with crypto market total(or other coins used as correlation, however I recommend total of crypto or btc)
Its components are:
RSI with a very length
Correlation candles
SMA 9
Rules for entry:
For long : RSI is above 51 level and going higher and close of the candle is above the SMA
For short :RSI is below 49 and going lower and close of the candle is below the SMA
Rules for exit:
We exit when we encountered an opposite condition than the entry one, or based on take profit/stop loss levels.
If you have any questions let me know !

Full Crypto Swing Strategy ALMA Cross with MACDThis is a full crypto swing strategy designed.
From my testing it looks like it perform the best on timeframes 4h +.
The below example has been adapted to BNB/USDT, using the entire period since 2017 until present day, with a comission of 0.03% ( which is the comission for the futures on binance).
Its components are :
ALMA Fast
ALMA Slow
MACD Histogram
Rules for entry
For long, we have a crossover of the fast alma with the slow one and the histogram is ascending.
For short, we have a crossunder of the fast alma with the slow one and the histogram is descending.
Rules for exit
We exit based on a risk management system for TP and SL, or when we receive an opposite condition than the initial one.
Regarding risk management
0.05 = 5% movement
2 = 200% movement
0.001 = 0.1% movement
If you have any questions, let me know !

Só Trade Top - Média de 8 - Augusto BackesThis strategy is an ADAPTATION of the EMA8 Setup from Augusto Backes (brazilian crypto youtuber).
The strategy was designed to work on the daily timeframe with the weekly EMA8.
Buy signals when there is a bullish candle above the weekly EMA8 - bullish candles in the script: engulfing candles, closing price reversal and bullish hammer.
Exit signals when there is a bearish candle below the weekly EMA8 - bearish candles in script: engulfing candles, closing price reversal and bearish hammer.
Entries and Exits on signals close.
Risk Management: all in on every trade.
The results here shown are from the standard parameters of the strategy.
------------------------------------------------------------------------------------------------------
PORTUGUESE TRANSLATION
------------------------------------------------------------------------------------------------------
Essa estratégia é uma adaptação do setup EMA8 do youtuber crypto Augusto Backes.
A estratégia foi desenvolvida para trabalhar em gráficos diários, usando a EMA8 do gráfico semanal.
Sinais de compra: quando uma figura de alta acontece acima da EMA8 semanal. Figuras de alta consideradas: Engolfo de Alta, Preço de fechamento de reversão de alta e Martelo de Alta
Sinais de saída do trade: quando uma figura de baixa acontece abaixo da EMA8 semanal. Figuras de baixa consideradas: Engolfo de Baixa, Preço de fechamento de reversão de baixa e Martelo de Baixa.
Todas as ordens são executadas dos fechamentos dos candles de sinal.
Gestão de risco: 100% do capital em cada trade.
Os resultados mostrados são com a aplicação dos parâmetros padrão da estratégia.

DMI + HMA - No Risk ManagementDMI (Directional Movement Index) and HMA (Hull Moving Average)
The DMI and HMA make a great combination, The DMI will gauge the market direction, while the HMA will add confirmation to the trend strength.
What is the DMI?
The DMI is an indicator that was developed by J. Welles Wilder in 1978. The Indicator was designed to identify in which direction the price is moving. This is done by comparing previous highs and lows and drawing 2 lines.
1. A Positive movement line
2. A Negative movement line
A third line can be added, which would be known as the ADX line or Average Directional Index. This can also be used to gauge the strength in which direction the market is moving.
When the Positive movement line (DI+) is above the Negative movement line (DI-) there is more upward pressure. Ofcourse visa versa, when the DI- is above the DI+ that would indicate more downwards pressure.
Want to know more about HMA? Check out one of our other published scripts
What is this strategy doing?
We are first waiting for the DMI to cross in our favoured direction, after that, we wait for the HMA to signal the entry. Without both conditions being true, no trade will be made.
Long Entries
1. DI+ crosses above DI-
2. HMA line 1 is above HMA line 2
Short Entries
1. DI- Crosses above DI+
2. HMA line 1 is below HMA lilne 2
Its as simple as that.
Conclusion
While this strategy does have its downsides, that can be reduced by adding some risk manegment into the script. In general the trade profitability is above average, And the max drawdown is at a minimum.
The settings have been optimised to suite BTCUSDT PERP markets. Though with small adjustments it can be used on many assets!

3Commas BotBjorgum 3Commas Bot
A strategy in a box to get you started today
With 3rd party API providers growing in popularity, many are turning to automating their strategies on their favorite assets. With so many options and layers of customization possible, TradingView offers a place no better for young or even experienced coders to build a platform from to meet these needs. 3Commas has offered easy access with straight forward TradingView compatibility. Before long many have their brokers hooked up and are ready to send their alerts (or perhaps they have been trying with mixed success for some time now) only they realize there might just be a little bit more to building a strategy that they are comfortable letting out of their sight to trade their money while they eat, sleep, etc. Many may have ideas for entry criteria they are excited to try, but further questions arise... "What about risk mitigation?" "How can I set stop or limit orders?" "Is there not some basic shell of a strategy that has laid some of this out for me to get me going?"
Well now there is just that. This strategy is meant for those that have begun to delve into the world of algorithmic trading providing a template that offers risk defined positions complete with stops, limit orders, and even trailing stops should one so choose to employ any of these criteria. It provides a framework that is easily manipulated (with some basic working knowledge of pine coding) to encompass ones own ideas and entry criteria, while also providing an already functioning strategy.
The default settings have a basic 1:1 risk to reward ratio, which sets a limit and a stop equal distance from the entry. The entry is a simple MA cross (up for long, down for short). There a variety of MA's to choose from and the user can define the lengths of the averages. The ratio can be adjusted from the menu along with a volatility based adder (ATR) that helps to distance a stop from support or resistance. These values are calculated off the swing low/high of the user defined lookback period. Risk is calculated from position entry to stop, and projected upwards to the limit as a function of the desired risk to reward ratio. Of note: the default settings include 0.05% commissions. Competitive commissions of the leading cryptocurrency exchanges are .1% round trip (one buy and one sell) for market orders. There is also some slippage to allow time for alerts to be sent and orders to fill giving the back test results a more accurate representation of real time conditions. Its recommended to research the going rates for your exchange and set them to default for the strategy you use or build.
To get started a user would:
1) Make a copy of the code and paste in their bot keys in the area provided under the "3Comma Keys" section
- eg. Long bot "start deal" copied from 3commas in to define "Long" etc. (code is commented)
2) Place alert on desired asset with desired settings ensuring to select "Order fills and alert() function calls"
3) Paste webhook into the webhook box and select webhook URL alerts (3rd party provided webhook)
3) Delete contents of alert message box and replace with {{strategy.order.alert_message}} and nothing else
- the codes will be sent to the webhook appropriately as the strategy enters and exits positions. Only 1 alert is needed
settings used for the display image:
1hr chart on BTCUSD
-ATR stop
-Risk adjustment 1.2
-ATR multiplier 1.3
-RnR 0.6
-MAs HEMA/SMA
-MA Length 50/100
-Order size percent of equity
-Trail trigger 60% of target
Experiment with your own settings on your crypto of choice or implement your own code!
Implementing your trailing stop (optional)
Among the options for possible settings is a trailing stop. This stop will ratchet higher once triggered as a function of the Average True Range (ATR). There is a variable level to choose where the user would like to begin trailing the stop during the trade. The level can be assigned with a decimal between 0 and 1 (eg. 0.5 = 50% of the distance between entry and the target which must be exceeded before the trail triggers to begin). This can allow for some dips to occur during the trade possibly keeping you in the trade for longer, while potentially reducing risk of drawdown over time. The default for this setting is 0 meaning unless adjusted, the trail will trigger on entry if the trailing stop exit method is selected. An example can be seen below:
Again, optional as well is the choice to implement a limit order. If one were to select a trailing stop they could choose not to set a limit, which could allow a trail to run further until hit. Drawdowns of this strategy would be foregoing locking gains at highs on target on other trades. This is a trade-off the user can decide on and test. An example of this working in favor can be observed below:
Conclusion
Although a simple strategy is implemented here, the benefits of this script allow a user a starting platform to build their strategies from with built in risk mitigation. This allows the user to sidestep some of the potential difficulties' that can arise while learning Pine and taking on the endeavor of automating their trading strategies. It is meant as an aid, a structure, and an educational piece that can be seen as a "pick-up-and-go" strategy with easy 3Commas compatibility. Additionally, this can help users become more comfortable with strategy alert messages and sending strings in the form of alerts from Pine. As well, FAQs are often littered with questions regarding "strategy.exit" calls, how to implement stops. how to properly set a trailing stop based on ATR, and more. The time this can save an individual to get started is likely of the best "take-aways" here.
Happy trading

Correlation StrategyThis is strategy determines a level (expressed in a scale from 1 to 100) of correlation
between security A (user defined) and security B (used on the chart) closing prices. If the correlation
is less than the user defined threshold, a buy signal will be possible. To determine the direction
of the trade we can choose between a Simple Moving Average or a Relative Strength Index indicator,
both with user defined lengths.
WFA Explained
This strategy includes a simple Walk Forward Optimisation, which is a technique used to evaluate the robustness
of the strategy, simulating a live trading environment where the future (the "out-of-sample" period) is not visible yet. The "in-sample" period is where you should optimise the values of the Strategy Inputs that match the ones in the WFA section. Default period value is 1 (or 1/3 of all the candles in the chart).
After optimising the first period, the "All" period can be chosen to evaluate the results of
our "in-sample" optimisation in an "out-of-sample" period (="All"-"1"). It is also possible (and recommended) to optimise
each period (1 and 2) independently and then replace the corresponding values in the WFA section of the inputs panel.
The WFA input is used to make those values effective in their corresponding periods.
More info on WFA: en.wikipedia.org

Ichimoku Cloud Strategy IdeaThis strategy idea uses the famous Ichimoku Cloud (Forward-shifted SMA-9 and SMA-26) and Chiku (52-candle lagged close price) with its default parameters. This strategy is slow and issues few signals. However, this is one of the most performant long-term trend trading strategies. It usually works well on 1D and 4H timeframes and even better on trending instruments. This is the implementation used in QuantCT app.
You can set operation mode to be Long/Short or long-only.
You also can set a fixed stop-loss or ignore it so that the strategy act solely based on entry and exit signals.
Trade Idea
When both close price and chiku are above the cloud, market is considered rising (bullish) and the plotted cloud becomes green.
When both close price and chiku are below the cloud, market is considered falling (bearish) and the plotted cloud becomes red.
Otherwise, market is considered ranging and the plotted cloud becomes orange.
Entry/Exit rules
Enter LONG right after both close price and chiku went above the cloud (i.e. when the end of the plotted cloud becomes green).
Enter SHORT right after both close price and chiku went below the cloud (i.e. when the end of the plotted cloud becomes red).
EXIT market when close price enters the cloud.
CAUTION
It's just a bare trading idea - but a profitable one. You can enhance this idea and turn it into a full trading strategy with enhanced risk/money management and optimizing it, and you ABSOLUTELY should do this!
DON'T insist on using Long/Short mode on all instruments! This strategy performs much better in Long-Only mode on several instruments (Like BTC , ETH, etc.), and also performs better in Long/Short mode on other instruments (Like VET, BNT, etc.).

Crypto Scalper Divergence Macd Psar Ema 200This is a very efficient crypto scalper adapted to very short timeframes, however it can be optimized for other timeframes and assests as well.
Its components are
MACD
P SAR
EMA 200
Risk management
Rules for entry:
For short : we have an uptrend on PSAR , histogram is positive (divergence MACD) and close of a candle is below EMA 200
For long : we dont have an uptrend on PSAR, histogram is negative(divergence MACD) and close of a candle is above EMA 200
Rules for exit:
We exit when we either find a reverse condition than the entry one, or based on stop loss/take profit that are calculated on % movements of the price.
If you have any questions, let me know !

Date Range DemonstrationThis is a simple strategy that demonstrates how to easily incorporate a date range into a strategy. This allows you to limit your backtesting to a specific range of dates, which is vital if you want to compare different time frames.
To use:
Copy the code block between the '////' lines into your strategy.
Add the variable 'inDateRange' to your entry and/or exit strategy conditions.
