MACD Enhanced [DCAUT]█ MACD Enhanced
📊 ORIGINALITY & INNOVATION
The MACD Enhanced represents a significant improvement over traditional MACD implementations. While Gerald Appel's original MACD from the 1970s was limited to exponential moving averages (EMA), this enhanced version expands algorithmic options by supporting 21 different moving average calculations for both the main MACD line and signal line independently.
This improvement addresses an important limitation of traditional MACD: the inability to adapt the indicator's mathematical foundation to different market conditions. By allowing traders to select from algorithms ranging from simple moving averages (SMA) for stability to advanced adaptive filters like Kalman Filter for noise reduction, this implementation changes MACD from a fixed-algorithm tool into a flexible instrument that can be adjusted for specific market environments and trading strategies.
The enhanced histogram visualization system uses a four-color gradient that helps communicate momentum strength and direction more clearly than traditional single-color histograms.
📐 MATHEMATICAL FOUNDATION
The core calculation maintains the proven MACD formula: Fast MA(source, fastLength) - Slow MA(source, slowLength), but extends it with algorithmic flexibility. The signal line applies the selected smoothing algorithm to the MACD line over the specified signal period, while the histogram represents the difference between MACD and signal lines.
Available Algorithms:
The implementation supports a comprehensive spectrum of technical analysis algorithms:
Basic Averages: SMA (arithmetic mean), EMA (exponential weighting), RMA (Wilder's smoothing), WMA (linear weighting)
Advanced Averages: HMA (Hull's low-lag), VWMA (volume-weighted), ALMA (Arnaud Legoux adaptive)
Mathematical Filters: LSMA (least squares regression), DEMA (double exponential), TEMA (triple exponential), ZLEMA (zero-lag exponential)
Adaptive Systems: T3 (Tillson T3), FRAMA (fractal adaptive), KAMA (Kaufman adaptive), MCGINLEY_DYNAMIC (reactive to volatility)
Signal Processing: ULTIMATE_SMOOTHER (low-pass filter), LAGUERRE_FILTER (four-pole IIR), SUPER_SMOOTHER (two-pole Butterworth), KALMAN_FILTER (state-space estimation)
Specialized: TMA (triangular moving average), LAGUERRE_BINOMIAL_FILTER (binomial smoothing)
Each algorithm responds differently to price action, allowing traders to match the indicator's behavior to market characteristics: trending markets benefit from responsive algorithms like EMA or HMA, while ranging markets require stable algorithms like SMA or RMA.
📊 COMPREHENSIVE SIGNAL ANALYSIS
Histogram Interpretation:
Positive Values: Indicate bullish momentum when MACD line exceeds signal line, suggesting upward price pressure and potential buying opportunities
Negative Values: Reflect bearish momentum when MACD line falls below signal line, indicating downward pressure and potential selling opportunities
Zero Line Crosses: MACD crossing above zero suggests transition to bullish bias, while crossing below indicates bearish bias shift
Momentum Changes: Rising histogram (regardless of positive/negative) signals accelerating momentum in the current direction, while declining histogram warns of momentum deceleration
Advanced Signal Recognition:
Divergences: Price making new highs/lows while MACD fails to confirm often precedes trend reversals
Convergence Patterns: MACD line approaching signal line suggests impending crossover and potential trade setup
Histogram Peaks: Extreme histogram values often mark momentum exhaustion points and potential reversal zones
🎯 STRATEGIC APPLICATIONS
Comprehensive Trend Confirmation Strategies:
Primary Trend Validation Protocol:
Identify primary trend direction using higher timeframe (4H or Daily) MACD position relative to zero line
Confirm trend strength by analyzing histogram progression: consistent expansion indicates strong momentum, contraction suggests weakening
Use secondary confirmation from MACD line angle: steep angles (>45°) indicate strong trends, shallow angles suggest consolidation
Validate with price structure: trending markets show consistent higher highs/higher lows (uptrend) or lower highs/lower lows (downtrend)
Entry Timing Techniques:
Pullback Entries in Uptrends: Wait for MACD histogram to decline toward zero line without crossing, then enter on histogram expansion with MACD line still above zero
Breakout Confirmations: Use MACD line crossing above zero as confirmation of upward breakouts from consolidation patterns
Continuation Signals: Look for MACD line re-acceleration (steepening angle) after brief consolidation periods as trend continuation signals
Advanced Divergence Trading Systems:
Regular Divergence Recognition:
Bullish Regular Divergence: Price creates lower lows while MACD line forms higher lows. This pattern is traditionally considered a potential upward reversal signal, but should be combined with other confirmation signals
Bearish Regular Divergence: Price makes higher highs while MACD shows lower highs. This pattern is traditionally considered a potential downward reversal signal, but trading decisions should incorporate proper risk management
Hidden Divergence Strategies:
Bullish Hidden Divergence: Price shows higher lows while MACD displays lower lows, indicating trend continuation potential. Use for adding to existing long positions during pullbacks
Bearish Hidden Divergence: Price creates lower highs while MACD forms higher highs, suggesting downtrend continuation. Optimal for adding to short positions during bear market rallies
Multi-Timeframe Coordination Framework:
Three-Timeframe Analysis Structure:
Primary Timeframe (Daily): Determine overall market bias and major trend direction. Only trade in alignment with daily MACD direction
Secondary Timeframe (4H): Identify intermediate trend changes and major entry opportunities. Use for position sizing decisions
Execution Timeframe (1H): Precise entry and exit timing. Look for MACD line crossovers that align with higher timeframe bias
Timeframe Synchronization Rules:
Daily MACD above zero + 4H MACD rising = Strong uptrend context for long positions
Daily MACD below zero + 4H MACD declining = Strong downtrend context for short positions
Conflicting signals between timeframes = Wait for alignment or use smaller position sizes
1H MACD signals only valid when aligned with both higher timeframes
Algorithm Considerations by Market Type:
Trending Markets: Responsive algorithms like EMA, HMA may be considered, but effectiveness should be tested for specific market conditions
Volatile Markets: Noise-reducing algorithms like KALMAN_FILTER, SUPER_SMOOTHER may help reduce false signals, though results vary by market
Range-Bound Markets: Stability-focused algorithms like SMA, RMA may provide smoother signals, but individual testing is required
Short Timeframes: Low-lag algorithms like ZLEMA, T3 theoretically respond faster but may also increase noise
Important Note: All algorithm choices and parameter settings should be thoroughly backtested and validated based on specific trading strategies, market conditions, and individual risk tolerance. Different market environments and trading styles may require different configuration approaches.
📋 DETAILED PARAMETER CONFIGURATION
Comprehensive Source Selection Strategy:
Price Source Analysis and Optimization:
Close Price (Default): Most commonly used, reflects final market sentiment of each period. Best for end-of-day analysis, swing trading, daily/weekly timeframes. Advantages: widely accepted standard, good for backtesting comparisons. Disadvantages: ignores intraday price action, may miss important highs/lows
HL2 (High+Low)/2: Midpoint of the trading range, reduces impact of opening gaps and closing spikes. Best for volatile markets, gap-prone assets, forex markets. Calculation impact: smoother MACD signals, reduced noise from price spikes. Optimal when asset shows frequent gaps, high volatility during specific sessions
HLC3 (High+Low+Close)/3: Weighted average emphasizing the close while including range information. Best for balanced analysis, most asset classes, medium-term trading. Mathematical effect: 33% weight to high/low, 33% to close, provides compromise between close and HL2. Use when standard close is too noisy but HL2 is too smooth
OHLC4 (Open+High+Low+Close)/4: True average of all price points, most comprehensive view. Best for complete price representation, algorithmic trading, statistical analysis. Considerations: includes opening sentiment, smoothest of all options but potentially less responsive. Optimal for markets with significant opening moves, comprehensive trend analysis
Parameter Configuration Principles:
Important Note: Different moving average algorithms have distinct mathematical characteristics and response patterns. The same parameter settings may produce vastly different results when using different algorithms. When switching algorithms, parameter settings should be re-evaluated and tested for appropriateness.
Length Parameter Considerations:
Fast Length (Default 12): Shorter periods provide faster response but may increase noise and false signals, longer periods offer more stable signals but slower response, different algorithms respond differently to the same parameters and may require adjustment
Slow Length (Default 26): Should maintain a reasonable proportional relationship with fast length, different timeframes may require different parameter configurations, algorithm characteristics influence optimal length settings
Signal Length (Default 9): Shorter lengths produce more frequent crossovers but may increase false signals, longer lengths provide better signal confirmation but slower response, should be adjusted based on trading style and chosen algorithm characteristics
Comprehensive Algorithm Selection Framework:
MACD Line Algorithm Decision Matrix:
EMA (Standard Choice): Mathematical properties: exponential weighting, recent price emphasis. Best for general use, traditional MACD behavior, backtesting compatibility. Performance characteristics: good balance of speed and smoothness, widely understood behavior
SMA (Stability Focus): Equal weighting of all periods, maximum smoothness. Best for ranging markets, noise reduction, conservative trading. Trade-offs: slower signal generation, reduced sensitivity to recent price changes
HMA (Speed Optimized): Hull Moving Average, designed for reduced lag. Best for trending markets, quick reversals, active trading. Technical advantage: square root period weighting, faster trend detection. Caution: can be more sensitive to noise
KAMA (Adaptive): Kaufman Adaptive MA, adjusts smoothing based on market efficiency. Best for varying market conditions, algorithmic trading. Mechanism: fast smoothing in trends, slow smoothing in sideways markets. Complexity: requires understanding of efficiency ratio
Signal Line Algorithm Optimization Strategies:
Matching Strategy: Use same algorithm for both MACD and signal lines. Benefits: consistent mathematical properties, predictable behavior. Best when backtesting historical strategies, maintaining traditional MACD characteristics
Contrast Strategy: Use different algorithms for optimization. Common combinations: MACD=EMA, Signal=SMA for smoother crossovers, MACD=HMA, Signal=RMA for balanced speed/stability, Advanced: MACD=KAMA, Signal=T3 for adaptive behavior with smooth signals
Market Regime Adaptation: Trending markets: both fast algorithms (EMA/HMA), Volatile markets: MACD=KALMAN_FILTER, Signal=SUPER_SMOOTHER, Range-bound: both slow algorithms (SMA/RMA)
Parameter Sensitivity Considerations:
Impact of Parameter Changes:
Length Parameter Sensitivity: Small parameter adjustments can significantly affect signal timing, while larger adjustments may fundamentally change indicator behavior characteristics
Algorithm Sensitivity: Different algorithms produce different signal characteristics. Thoroughly test the impact on your trading strategy before switching algorithms
Combined Effects: Changing multiple parameters simultaneously can create unexpected effects. Recommendation: adjust parameters one at a time and thoroughly test each change
📈 PERFORMANCE ANALYSIS & COMPETITIVE ADVANTAGES
Response Characteristics by Algorithm:
Fastest Response: ZLEMA, HMA, T3 - minimal lag but higher noise
Balanced Performance: EMA, DEMA, TEMA - good trade-off between speed and stability
Highest Stability: SMA, RMA, TMA - reduced noise but increased lag
Adaptive Behavior: KAMA, FRAMA, MCGINLEY_DYNAMIC - automatically adjust to market conditions
Noise Filtering Capabilities:
Advanced algorithms like KALMAN_FILTER and SUPER_SMOOTHER help reduce false signals compared to traditional EMA-based MACD. Noise-reducing algorithms can provide more stable signals in volatile market conditions, though results will vary based on market conditions and parameter settings.
Market Condition Adaptability:
Unlike fixed-algorithm MACD, this enhanced version allows real-time optimization. Trending markets benefit from responsive algorithms (EMA, HMA), while ranging markets perform better with stable algorithms (SMA, RMA). The ability to switch algorithms without changing indicators provides greater flexibility.
Comparative Performance vs Traditional MACD:
Algorithm Flexibility: 21 algorithms vs 1 fixed EMA
Signal Quality: Reduced false signals through noise filtering algorithms
Market Adaptability: Optimizable for any market condition vs fixed behavior
Customization Options: Independent algorithm selection for MACD and signal lines vs forced matching
Professional Features: Advanced color coding, multiple alert conditions, comprehensive parameter control
USAGE NOTES
This indicator is designed for technical analysis and educational purposes. Like all technical indicators, it has limitations and should not be used as the sole basis for trading decisions. Algorithm performance varies with market conditions, and past characteristics do not guarantee future results. Always combine with proper risk management and thorough strategy testing.
Moving_average

T3 [DCAUT]█ T3
📊 INDICATOR OVERVIEW
The T3 Moving Average is a smoothing indicator developed by Tim Tillson and published in Technical Analysis of Stocks & Commodities magazine (January 1998). The algorithm applies Generalized DEMA (Double Exponential Moving Average) recursively three times, creating a six-pole filtering effect that aims to balance noise reduction with responsiveness while minimizing lag relative to price changes.
📐 MATHEMATICAL FOUNDATION
Generalized DEMA (GD) Function:
The core building block is the Generalized DEMA function, which combines two exponential moving averages with weights controlled by the volume factor:
GD(input, v) = EMA(input) × (1 + v) - EMA(EMA(input)) × v
Where v is the volume factor parameter (default 0.7). This weighted combination reduces lag while maintaining smoothness by extrapolating beyond the first EMA using the double-smoothed EMA as a reference.
T3 Calculation Process:
T3 applies the GD function three times recursively:
T3 = GD(GD(GD(Price, v), v), v)
This triple nesting creates a six-pole smoothing effect (each GD applies two EMA operations, resulting in 2 × 3 = 6 total EMA calculations). The cascading refinement progressively filters noise while preserving trend information.
Step-by-Step Breakdown:
First GD application: GD1 = EMA(Price) × (1 + v) - EMA(EMA(Price)) × v - Creates initial smoothed series with lag reduction
Second GD application: GD2 = EMA(GD1) × (1 + v) - EMA(EMA(GD1)) × v - Further refines the smoothing while maintaining responsiveness
Third GD application: T3 = EMA(GD2) × (1 + v) - EMA(EMA(GD2)) × v - Final refinement produces the T3 output
Volume Factor Impact:
The volume factor (v) is the key parameter controlling the balance between smoothness and responsiveness. Tim Tillson recommended v = 0.7 as the optimal default value.
Lower volume factors (v closer to 0.0): Increase the extrapolation effect, making T3 more responsive to price changes but potentially more sensitive to noise.
Higher volume factors (v closer to 1.0): Reduce the extrapolation effect, producing smoother output with less sensitivity to short-term fluctuations but slightly more lag.
The recursive application of the volume factor through three GD stages creates a nonlinear filtering effect that achieves superior lag reduction compared to traditional moving averages of equivalent smoothness.
📊 SIGNAL INTERPRETATION
Trend Direction Signals:
Green Line (T3 Rising): Smoothed trend line is rising, may indicate uptrend, consider bullish opportunities when confirmed by other factors
Red Line (T3 Falling): Smoothed trend line is falling, may indicate downtrend, consider bearish opportunities when confirmed by other factors
Gray Line (T3 Flat): Smoothed trend line is flat, indicates unclear trend or consolidation phase
Price Crossover Signals:
Price Crosses Above T3: Price breaks above smoothed trend line, may be bullish signal, requires confirmation from other indicators
Price Crosses Below T3: Price breaks below smoothed trend line, may be bearish signal, requires confirmation from other indicators
Price Position Relative to T3: Price sustained above T3 may indicate uptrend, sustained below may indicate downtrend
Supporting Analysis Signals:
T3 Slope Angle: Steeper slopes indicate stronger trend momentum, flatter slopes suggest weakening trends
Price Deviation: Significant price separation from T3 may indicate overextension, watch for pullback or reversal
Dynamic Support/Resistance: T3 line can serve as dynamic support (in uptrends) or resistance (in downtrends) reference
🎯 STRATEGIC APPLICATIONS
Common Usage Patterns:
The T3 Moving Average can be incorporated into trading analysis in various ways. These represent common approaches used by market participants, though effectiveness varies by market conditions and requires individual testing:
Trend Filtering:
T3 can be used as a trend filter by observing the relationship between price and the T3 line. The color-coded slope (green for rising, red for falling, gray for sideways) provides visual feedback about the current trend direction of the smoothed series.
Price Crossover Analysis:
Some traders monitor crossovers between price and the T3 line as potential indication points. When price crosses the T3 line, it may suggest a change in the relationship between current price action and the smoothed trend.
Multi-Timeframe Observation:
T3 can be applied to multiple timeframes simultaneously. Observing alignment or divergence between different timeframe T3 indicators may provide context about trend consistency across time scales.
Dynamic Reference Level:
The T3 line can serve as a dynamic reference level for price action analysis. Price distance from T3, price reactions when approaching T3, and the behavior of price relative to the T3 line can all be incorporated into market analysis frameworks.
Application Considerations:
Any trading application should be thoroughly tested on historical data before implementation
T3 performance characteristics vary across different market conditions and asset types
The indicator provides smoothed trend information but does not predict future price movements
Combining T3 with other analytical tools and market context improves analysis quality
Risk management practices remain essential regardless of the analytical approach used
📋 DETAILED PARAMETER CONFIGURATION
Source Selection:
Close Price (Default): Standard choice for end-of-period trend analysis, reduces intrabar noise
HL2 (High+Low)/2: Provides balanced view of price action, considers full bar range
HLC3 or OHLC4: Incorporates more price information, may provide smoother results
Selection Impact: Different sources affect signal timing and smoothness characteristics
Length Configuration:
Shorter periods: More responsive, faster reaction, frequent signals, but higher false signal risk in choppy markets
Longer periods: Smoother output, fewer signals, better for long-term trends, but slower response
Default 14 periods is a common baseline, but optimal length varies by asset, timeframe, and market conditions
Parameter selection should be determined through backtesting rather than general recommendations
Volume Factor Configuration:
Lower values (closer to 0.0): Increase responsiveness but also noise sensitivity
Higher values (closer to 1.0): Increase smoothness but slightly more lag
Default 0.7 (Tim Tillson's recommendation) provides good balance for most applications
Optimal value depends on signal frequency versus reliability preference, test for specific use case
Parameter Optimization Approach:
There are no universal "best" parameter values - optimal settings depend on the specific asset, timeframe, market regime, and trading strategy
Start with default values (Length: 14, Volume Factor: 0.7) and adjust based on observed performance in your target market
Conduct systematic backtesting across different market conditions to evaluate parameter sensitivity
Consider that parameters optimized for historical data may not perform identically in future market conditions
Monitor performance and be prepared to adjust parameters as market characteristics evolve
📈 DESIGN FEATURES & MARKET ADAPTATION
Algorithm Design Features:
Simple Moving Average (SMA): Equal weighting across lookback period
Exponential Moving Average (EMA): Exponentially decreasing weights on historical prices
T3 Moving Average: Recursive Generalized DEMA with adjustable volume factor
Market Condition Adaptation:
Trending markets: Smoothed indicators generally align more closely with sustained directional movement
Ranging markets: All moving averages may generate more crossover signals during non-trending periods
Volatile conditions: Higher smoothing parameters reduce short-term sensitivity but increase lag
Indicator behavior relative to market conditions should be evaluated for specific applications
USAGE NOTES
This indicator is designed for technical analysis and educational purposes. The T3 Moving Average has limitations and should not be used as the sole basis for trading decisions. Like all trend-following indicators, its performance varies with market conditions, and past signal characteristics do not guarantee future results.
Key Points:
T3 is a lagging indicator that responds to price changes rather than predicting future movements
Signals should be confirmed with other technical tools and market context
Parameters should be optimized for specific market and timeframe
Risk management and position sizing are essential
Market regime changes can affect indicator effectiveness
Test strategies thoroughly on historical data before live implementation
Consider broader market context and fundamental factors
TradeScope: MA Reversion • RVOL • Trendlines • GAPs • TableTradeScope is an all-in-one technical analysis suite that brings together price action, momentum, volume dynamics, and trend structure into one cohesive and fully customizable indicator.
An advanced, modular trading suite that combines moving averages, reversion signals, RSI/CCI momentum, relative volume, gap detection, trendline analysis, and dynamic tables — all within one powerful dashboard.
Perfect for swing traders, intraday traders, and analysts who want to read price strength, volume context, and market structure in real time.
⚙️ Core Components & Inputs
🧮 Moving Average Settings
Moving Average Type & Length:
Choose between SMA or EMA and set your preferred period for smoother or more reactive trend tracking.
Multi-MA Plotting:
Up to 8 customizable moving averages (each with independent type, color, and length).
Includes a “window filter” to show only the last X bars, reducing chart clutter.
MA Reversion Engine:
Detects when price has extended too far from its moving average.
Reversion Lookback: Number of bars analyzed to determine historical extremes.
Reversion Threshold: Sensitivity multiplier—lower = more frequent signals, higher = stricter triggers.
🔄 Trend Settings
Short-Term & Long-Term Trend Lookbacks:
Uses linear regression to detect the slope and direction of the short- and long-term trend.
Results are displayed in the live table with color-coded bias:
🟩 Bullish | 🟥 Bearish
📈 Momentum Indicators
RSI (Relative Strength Index):
Adjustable period; displays the current RSI value, overbought (>70) / oversold (<30) zones, and trending direction.
CCI (Commodity Channel Index):
Customizable length with color-coded bias:
🟩 Oversold (< -100), 🟥 Overbought (> 100).
Tooltip shows whether the CCI is trending up or down.
📊 Volume Analysis
Relative Volume (RVOL):
Estimates end-of-day projected volume using intraday progress and compares it against the 20-day average.
Displays whether today’s volume is expected to exceed yesterday’s, and highlights color by strength.
Volume Trend (Short & Long Lookbacks):
Visual cues for whether current volume is above or below short-term and long-term averages.
Estimated Full-Day Volume & Multiplier:
Converts raw volume into “X” multiples (e.g., 2.3X average) for quick interpretation.
🕳️ Gap Detection
Automatically identifies and plots bullish and bearish price gaps within a defined lookback period.
Gap Lookback: Defines how far back to search for gaps.
Gap Line Width / Visibility: Controls the thickness and display of gap lines on chart.
Displays the closest open gap in the live table, including its distance from current price (%).
🔍 ATR & Volatility
14-day ATR (% of price):
Automatically converts the Average True Range into a percent, providing quick volatility context:
🟩 Low (<3%) | 🟨 Moderate (3–5%) | 🟥 High (>5%)
💬 Candlestick Pattern Recognition
Auto-detects popular reversal and continuation patterns such as:
Bullish/Bearish Engulfing
Hammer / Hanging Man
Shooting Star / Inverted Hammer
Doji / Harami / Kicking / Marubozu / Morning Star
Each pattern is shown with contextual color coding in the table.
🧱 Pivot Points & Support/Resistance
Optional Pivot High / Pivot Low Labels
Adjustable left/right bar lengths for pivot detection
Theme-aware text and label color options
Automatically drawn diagonal trendlines for both support and resistance
Adjustable line style, color, and thickness
Detects and tracks touches for reliability
Includes breakout alerts (with optional volume confirmation)
🚨 Alerts
MA Cross Alerts:
Triggers when price crosses the fast or slow moving average within a tolerance band (default ±0.3%).
Diagonal Breakout Alerts:
Detects and alerts when price breaks diagonal trendlines.
Volume-Confirmed Alerts:
Filters breakouts where volume exceeds 1.5× the 20-bar average.
🧾 Live Market Table
A fully dynamic table displayed on-chart, customizable via input toggles:
Choose which rows to show (e.g., RSI, ATR, RVOL, Gaps, CCI, Trend, MA info, Diff, Low→Close%).
Choose table position (top-right, bottom-left, etc.) and text size.
Theme selection: Light or Dark
Conditional background colors for instant visual interpretation:
🟩 Bullish or Oversold
🟥 Bearish or Overbought
🟨 Neutral / Moderate
🎯 Practical Uses
✅ Identify confluence setups combining MA reversion, volume expansion, and RSI/CCI extremes.
✅ Track trend bias and gap proximity directly in your dashboard.
✅ Monitor relative volume behavior for intraday strength confirmation.
✅ Automate MA cross or breakout alerts to stay ahead of key price action.
🧠 Ideal For
Swing traders seeking confluence-based setups
Intraday traders monitoring multi-factor bias
Analysts looking for compact market health dashboards
💡 Summary
TradeScope is designed as a single-pane-of-glass market view — combining momentum, trend, volume, structure, and reversion into one clear visual system.
Fully customizable. Fully dynamic.
Use it to see what others miss — clarity, confluence, and confidence in every trade.

Kalman Filter [DCAUT]█ Kalman Filter
📊 ORIGINALITY & INNOVATION
The Kalman Filter represents an important adaptation of aerospace signal processing technology to financial market analysis. Originally developed by Rudolf E. Kalman in 1960 for navigation and guidance systems, this implementation brings the algorithm's noise reduction capabilities to price trend analysis.
This implementation addresses a common challenge in technical analysis: the trade-off between smoothness and responsiveness. Traditional moving averages must choose between being smooth (with increased lag) or responsive (with increased noise). The Kalman Filter improves upon this limitation through its recursive estimation approach, which continuously balances historical trend information with current price data based on configurable noise parameters.
The key advancement lies in the algorithm's adaptive weighting mechanism. Rather than applying fixed weights to historical data like conventional moving averages, the Kalman Filter dynamically adjusts its trust between the predicted trend and observed prices. This allows it to provide smoother signals during stable periods while maintaining responsiveness during genuine trend changes, helping to reduce whipsaws in ranging markets while not missing significant price movements.
📐 MATHEMATICAL FOUNDATION
The Kalman Filter operates through a two-phase recursive process:
Prediction Phase:
The algorithm first predicts the next state based on the previous estimate:
State Prediction: Estimates the next value based on current trend
Error Covariance Prediction: Calculates uncertainty in the prediction
Update Phase:
Then updates the prediction based on new price observations:
Kalman Gain Calculation: Determines the weight given to new measurements
State Update: Combines prediction with observation based on calculated gain
Error Covariance Update: Adjusts uncertainty estimate for next iteration
Core Parameters:
Process Noise (Q): Represents uncertainty in the trend model itself. Higher values indicate the trend can change more rapidly, making the filter more responsive to price changes.
Measurement Noise (R): Represents uncertainty in price observations. Higher values indicate less trust in individual price points, resulting in smoother output.
Kalman Gain Formula:
The Kalman Gain determines how much weight to give new observations versus predictions:
K = P(k|k-1) / (P(k|k-1) + R)
Where:
K is the Kalman Gain (0 to 1)
P(k|k-1) is the predicted error covariance
R is the measurement noise parameter
When K approaches 1, the filter trusts new measurements more (responsive).
When K approaches 0, the filter trusts its prediction more (smooth).
This dynamic adjustment mechanism allows the filter to adapt to changing market conditions automatically, providing an advantage over fixed-weight moving averages.
📊 COMPREHENSIVE SIGNAL ANALYSIS
Visual Trend Indication:
The Kalman Filter line provides color-coded trend information:
Green Line: Indicates the filter value is rising, suggesting upward price momentum
Red Line: Indicates the filter value is falling, suggesting downward price momentum
Gray Line: Indicates sideways movement with no clear directional bias
Crossover Signals:
Price-filter crossovers generate trading signals:
Golden Cross: Price crosses above the Kalman Filter line, suggests potential bullish momentum development, may indicate a favorable environment for long positions, filter will naturally turn green as it adapts to price moving higher
Death Cross: Price crosses below the Kalman Filter line, suggests potential bearish momentum development, may indicate consideration for position reduction or shorts, filter will naturally turn red as it adapts to price moving lower
Trend Confirmation:
The filter serves as a dynamic trend baseline:
Price Consistently Above Filter: Confirms established uptrend
Price Consistently Below Filter: Confirms established downtrend
Frequent Crossovers: Suggests ranging or choppy market conditions
Signal Reliability Factors:
Signal quality varies based on market conditions:
Higher reliability in trending markets with sustained directional moves
Lower reliability in choppy, range-bound conditions with frequent reversals
Parameter adjustment can help adapt to different market volatility levels
🎯 STRATEGIC APPLICATIONS
Trend Following Strategy:
Use the Kalman Filter as a dynamic trend baseline:
Enter long positions when price crosses above the filter
Enter short positions when price crosses below the filter
Exit when price crosses back through the filter in the opposite direction
Monitor filter slope (color) for trend strength confirmation
Dynamic Support/Resistance:
The filter can act as a moving support or resistance level:
In uptrends: Filter often provides dynamic support for pullbacks
In downtrends: Filter often provides dynamic resistance for bounces
Price rejections from the filter can offer entry opportunities in trend direction
Filter breaches may signal potential trend reversals
Multi-Timeframe Analysis:
Combine Kalman Filters across different timeframes:
Higher timeframe filter identifies primary trend direction
Lower timeframe filter provides precise entry and exit timing
Trade only in direction of higher timeframe trend for better probability
Use lower timeframe crossovers for position entry/exit within major trend
Volatility-Adjusted Configuration:
Adapt parameters to match market conditions:
Low Volatility Markets (Forex majors, stable stocks): Use lower process noise for stability, use lower measurement noise for sensitivity
Medium Volatility Markets (Most equities): Process noise default (0.05) provides balanced performance, measurement noise default (1.0) for general-purpose filtering
High Volatility Markets (Cryptocurrencies, volatile stocks): Use higher process noise for responsiveness, use higher measurement noise for noise reduction
Risk Management Integration:
Use filter as a trailing stop-loss level in trending markets
Tighten stops when price moves significantly away from filter (overextension)
Wider stops in early trend formation when filter is just establishing direction
Consider position sizing based on distance between price and filter
📋 DETAILED PARAMETER CONFIGURATION
Source Selection:
Determines which price data feeds the algorithm:
OHLC4 (default): Uses average of open, high, low, close for balanced representation
Close: Focuses purely on closing prices for end-of-period analysis
HL2: Uses midpoint of high and low for range-based analysis
HLC3: Typical price, gives more weight to closing price
HLCC4: Weighted close price, emphasizes closing values
Process Noise (Q) - Adaptation Speed Control:
This parameter controls how quickly the filter adapts to changes:
Technical Meaning:
Represents uncertainty in the underlying trend model
Higher values allow the estimated trend to change more rapidly
Lower values assume the trend is more stable and slow-changing
Practical Impact:
Lower Values: Produces very smooth output with minimal noise, slower to respond to genuine trend changes, best for long-term trend identification, reduces false signals in choppy markets
Medium Values: Balanced responsiveness and smoothness, suitable for swing trading applications, default (0.05) works well for most markets
Higher Values: More responsive to price changes, may produce more false signals in ranging markets, better for short-term trading and day trading, captures trend changes earlier, adjust freely based on market characteristics
Measurement Noise (R) - Smoothing Control:
This parameter controls how much the filter trusts individual price observations:
Technical Meaning:
Represents uncertainty in price measurements
Higher values indicate less trust in individual price points
Lower values make each price observation more influential
Practical Impact:
Lower Values: More reactive to each price change, less smoothing with more noise in output, may produce choppy signals
Medium Values: Balanced smoothing and responsiveness, default (1.0) provides general-purpose filtering
Higher Values: Heavy smoothing for very noisy markets, reduces whipsaws significantly but increases lag in trend change detection, best for cryptocurrency and highly volatile assets, can use larger values for extreme smoothing
Parameter Interaction:
The ratio between Process Noise and Measurement Noise determines overall behavior:
High Q / Low R: Very responsive, minimal smoothing
Low Q / High R: Very smooth, maximum lag reduction
Balanced Q and R: Middle ground for most applications
Optimization Guidelines:
Start with default values (Q=0.05, R=1.0)
If too many false signals: Increase R or decrease Q
If missing trend changes: Decrease R or increase Q
Test across different market conditions before live use
Consider different settings for different timeframes
📈 PERFORMANCE ANALYSIS & COMPETITIVE ADVANTAGES
Comparison with Traditional Moving Averages:
Versus Simple Moving Average (SMA):
The Kalman Filter typically responds faster to genuine trend changes
Produces smoother output than SMA of comparable length
Better noise reduction in ranging markets
More configurable for different market conditions
Versus Exponential Moving Average (EMA):
Similar responsiveness but with better noise filtering
Less prone to whipsaws in choppy conditions
More adaptable through dual parameter control (Q and R)
Can be tuned to match or exceed EMA responsiveness while maintaining smoothness
Versus Hull Moving Average (HMA):
Different noise reduction approach (recursive estimation vs. weighted calculation)
Kalman Filter offers more intuitive parameter adjustment
Both reduce lag effectively, but through different mechanisms
Kalman Filter may handle sudden volatility changes more gracefully
Response Characteristics:
Lag Time: Moderate and configurable through parameter adjustment
Noise Reduction: Good to excellent, particularly in volatile conditions
Trend Detection: Effective across multiple timeframes
False Signal Rate: Typically lower than simple moving averages in ranging markets
Computational Efficiency: Efficient recursive calculation suitable for real-time use
Optimal Use Cases:
Markets with mixed trending and ranging periods
Assets with moderate to high volatility requiring noise filtering
Multi-timeframe analysis requiring consistent methodology
Systematic trading strategies needing reliable trend identification
Situations requiring balance between responsiveness and smoothness
Known Limitations:
Parameters require adjustment for different market volatility levels
May still produce false signals during extreme choppy conditions
No single parameter set works optimally for all market conditions
Requires complementary indicators for comprehensive analysis
Historical performance characteristics may not persist in changing market conditions
USAGE NOTES
This indicator is designed for technical analysis and educational purposes. The Kalman Filter's effectiveness varies with market conditions, tending to perform better in markets with clear trending phases interrupted by consolidation. Like all technical indicators, it has limitations and should not be used as the sole basis for trading decisions, but rather as part of a comprehensive trading approach.
Algorithm performance varies with market conditions, and past characteristics do not guarantee future results. Always test thoroughly with different parameter settings across various market conditions before using in live trading. No technical indicator can predict future price movements with certainty, and all trading involves risk of loss.
Eyas's EyeTry it and see!!
# 🦅 EYAS'S EYE - Multi-Confluence Trend Strategy
A systematic trading strategy combining multiple technical indicators with advanced risk management for high-probability trades in trending markets.
## 📊 OVERVIEW
**Trading Style:** Swing/Position Trading
**Direction:** Long & Short
**Best Timeframes:** 4H, Daily
**Markets:** Crypto, Forex, Indices
## 🎯 METHODOLOGY
**Multi-Indicator Confluence System:**
- Trend analysis for market direction
- Momentum indicators for timing
- Volatility-based entry zones
- Dynamic ATR-based risk management
**Entry Requirements:**
- Multiple confirming signals required
- Strong trend filtering
- Minimum bars between trades
- Balanced long/short exposure
**Exit Strategy:**
- Volatility-adjusted stop losses
- High risk-reward targets (6:1)
- Trailing stops to capture trends
- Signal-based exits
- Minimum hold time to let winners run
## ✨ KEY FEATURES
✅ Realistic execution model (no look-ahead bias)
✅ Dynamic risk management
✅ Customizable parameters
✅ Clear visual signals
✅ Real-time performance metrics
## 📈 PERFORMANCE
Backtested on ETH/USD (12 months):
- Win Rate: 88-93%
- 500+ closed trades
- Strong profit factor
- Consistent monthly returns
**Best in:** Trending markets with medium-high volatility
**Challenges:** Choppy sideways markets
## 🔒 ACCESS
**This is a PROTECTED script**
To request access, send me a private message or comment below.
## ⚠️ DISCLAIMER
Trading involves substantial risk. Past performance does not guarantee future results. This is not financial advice. Always test with paper trading first and never risk more than you can afford to lose.
---
**Strategy Philosophy:** Quality over quantity. The name "Eyas's Eye" represents the sharp vision of a young eagle - patience in waiting for the right moment and the ability to spot opportunities others miss.
🦅 **Trade with vision. Trade with Eyas's Eye.**

12/21 x 50-100-200 MA - [RZ]👁️ - 12/21 x 50-100-200 MA
A comprehensive moving average overlay indicator designed to identify trend direction and key support/resistance levels using a dual fast/slow MA crossover system combined with three major moving averages.
⛓️ - FEATURES
Dual MA Crossover System: Configurable short (default 12) and long (default 21) period moving averages that change color based on trend direction
Triple Major MAs: 50, 100, and 200 period moving averages displayed in blue, yellow, and red respectively for identifying key market structure levels
Multiple MA Types: Choose from SMA, EMA, DEMA, TEMA, LSMA, WMA, or HMA for all calculations
Customizable Source: Apply the indicator to any price source (close, open, high, low)
Optional Bar Coloring: Visualize trend direction directly on price bars
Built-in Alerts: Automated alerts for trend reversals (Trend Up/Trend Down)
🎮 - HOW TO USE
Bullish Signal: When the short MA crosses above the long MA, both MAs turn green
Bearish Signal: When the short MA crosses below the long MA, both MAs turn red
The 50/100/200 MAs serve as dynamic support/resistance levels and help confirm overall market trend
Use bar coloring for quick visual identification of current trend state
🧰 - OPTIONS
Adjustable lengths for all moving averages
Color customization for bullish/bearish trends
Toggle bar coloring on/off
Select preferred MA calculation method
⚠️ - DISCLAIMER
This indicator is provided for educational and informational purposes only and should not be considered financial advice.
Trading and investing in financial markets involves substantial risk of loss and is not suitable for every investor.
Past performance is not indicative of future results.
The signals and information generated by this indicator do not guarantee profits and may result in losses.
Users should conduct their own research and due diligence, and consult with a qualified financial advisor before making any investment decisions.
The creator of this indicator assumes no responsibility for any financial losses incurred through the use of this tool.
By using this indicator, you acknowledge that you are solely responsible for your trading decisions and their outcomes.
👑 - CREDITS
@profmichaelg for Michael's EMA indicator

MACD with RSI color 7 Fibonacci levelsMACD that contain RSI info
The color of RSI is change accordingly with Fibonacci levels, from red till green

12/21 EMA STRAT - [RZ]12/21 EMA Strategy with Performance Analytics
👁️ - OVERVIEW
This indicator implements a simple yet effective exponential moving average (EMA) crossover strategy that compares a 12-period EMA against a 21-period EMA. The system generates long signals when the 12 EMA is positioned above the 21 EMA, and moves to cash when the 12 EMA falls below the 21 EMA.
🧠 - STRATEGY LOGIC
Signal Generation:
Long Position: Activated when 12 EMA > 21 EMA
Cash Position: Activated when 12 EMA < 21 EMA
Technical Implementation:
Uses perpetual condition checks instead of crossover/crossunder functions to prevent signal misgeneration and ensure reliability
Implements barstate.isconfirmed validation to eliminate repainting issues and ensure all signals are confirmed on closed bars
Provides clean, reliable signals suitable for both backtesting and live trading
⚙️ - FEATURES
The indicator includes a comprehensive table displaying real-time performance metrics comparing the strategy against a buy-and-hold approach:
Sharpe Ratio: Risk-adjusted return measurement
Sortino Ratio: Downside risk-adjusted return measurement
Omega Ratio: Probability-weighted ratio of gains versus losses
Maximum Drawdown %: Largest peak-to-trough decline
Visual Components
Equity Curves: Plots both strategy equity and buy-and-hold equity for visual comparison
Status Table: Real-time display of current position (Long/Cash) and performance metrics
Clean Chart Interface: Easy-to-read visualization of strategy performance
Alert System
Long signal triggers
Cash signal triggers
📝 - How to Use
Add the indicator to your chart
Review the performance metrics table to compare strategy vs. buy-and-hold
Monitor the equity curves to visualize strategy performance
Set up alerts for long and cash signals if desired
Use the current position indicator to track strategy status
📊 - Multi-Timeframe Compatibility
This indicator works across multiple timeframes, however, performance characteristics vary significantly depending on the timeframe selected:
Different timeframes will produce different results
Strategy performance may be optimal on certain timeframes and underperform on others
DYOR (Do Your Own Research): Users are strongly encouraged to backtest the strategy on their preferred timeframes and market conditions before use
Test extensively with historical data to understand the strategy's behavior in your specific use case
ETH
SOL
⚠️ - DISCLAIMER
This indicator is provided for educational and informational purposes only. It is NOT financial advice, investment advice, or a recommendation to buy or sell any security or financial instrument.
Past performance does not guarantee future results
Trading involves substantial risk of loss and is not suitable for all investors
You should carefully consider your financial situation and risk tolerance before making any trading decisions
Always conduct your own research and consult with a qualified financial advisor before making investment decisions
The creator of this indicator assumes no responsibility for any financial losses incurred through the use of this tool
Use this indicator at your own risk

AutoDay MA (Session-Normalized)📊 AutoDay MA (Session-Normalized Moving Average)
⚡ Daily power, intraday precision.
AutoDay MA automatically converts any N-day moving average into the exact equivalent on your current intraday timeframe.
💡 Concept inspired by Brian Shannon (Alphatrends) – mapping daily MAs onto intraday charts by normalizing session minutes.
🛠 How it works
Set Days (N) (e.g., 5, 10, 20).
Define Session Minutes per Day (⏱ 390 = US RTH, 🌍 1440 = 24h).
The indicator detects your chart’s timeframe and computes:
Length = (Days × SessionMinutes) / BarMinutes
Applies your chosen MA type (📐 SMA / EMA / RMA / WMA) with rounding (nearest, up, down).
Displays all details in a clear corner info panel.
✅ Why use it
Consistency 🔄: Same 5-day smoothing across all intraday charts.
Session-aware 🕒: Works for equities, futures, FX, crypto.
Transparency 🔍: Always shows the math & final MA length.
Alerts built-in 🔔: Cross up/down vs. price.
📈 Examples
5-Day on 1m → 1950-period MA
5-Day on 15m → 130-period MA
5-Day on 65m → 30-period MA
10-Day on 24h/15m (crypto) → 960-period MA

MAMA [DCAUT]█ MAMA (MESA Adaptive Moving Average)
📊 OVERVIEW
The MESA Adaptive Moving Average (MAMA) represents an advanced implementation of John F. Ehlers' adaptive moving average system using the Hilbert Transform Discriminator. This indicator automatically adjusts to market cycles, providing superior responsiveness compared to traditional fixed-period moving averages while maintaining smoothness.
MAMA dynamically calculates two lines: the fast-adapting MAMA line and the following FAMA (Following Adaptive Moving Average) line. The system's core strength lies in its ability to automatically detect and adapt to the dominant market cycle, reducing lag during trending periods while providing stability during consolidation phases.
🎯 CORE CONCEPTS
Signal Interpretation:
• MAMA above FAMA: Indicates bullish trend momentum with the fast line leading upward movement
• MAMA below FAMA: Suggests bearish trend momentum with the fast line leading downward movement
• Golden Cross: MAMA crossing above FAMA signals potential upward momentum shift
• Death Cross: MAMA crossing below FAMA indicates potential downward momentum shift
• Line Convergence: MAMA and FAMA approaching each other suggests trend consolidation or potential reversal
Primary Applications:
• Trend Following: Enhanced responsiveness to trend changes compared to traditional moving averages
• Crossover Signals: MAMA/FAMA crossovers for identifying potential entry and exit points
• Cycle Analysis: Automatic adaptation to market's dominant cycle characteristics
• Reduced Lag: Minimized delay in trend detection while maintaining signal smoothness
📐 MATHEMATICAL FOUNDATION
Hilbert Transform Discriminator Technology:
The MAMA system employs John F. Ehlers' Hilbert Transform Discriminator, a sophisticated signal processing technique borrowed from telecommunications engineering. The Hilbert Transform creates a complex representation of the price series by generating a 90-degree phase-shifted version of the original signal, enabling precise cycle measurement.
The discriminator analyzes the instantaneous phase relationships between the original price series and its Hilbert Transform counterpart. This mathematical relationship reveals the dominant cycle period present in the market data at each point in time, forming the foundation for adaptive smoothing.
Instantaneous Period Calculation:
The algorithm computes the instantaneous period using the arctangent of the ratio between the Hilbert Transform and the original price series. This calculation produces a real-time measurement of the market's dominant cycle, typically ranging from short-term noise cycles to longer-term trend cycles.
The instantaneous period measurement undergoes additional smoothing to prevent erratic behavior from single-bar anomalies. This smoothed period value becomes the basis for calculating the adaptive alpha coefficient that controls the moving average's responsiveness.
Dynamic Alpha Coefficient System:
The adaptive alpha calculation represents the core mathematical innovation of MAMA. The alpha coefficient is derived from the instantaneous period measurement and constrained within the user-defined fast and slow limits.
The mathematical relationship converts the measured cycle period into an appropriate smoothing factor: shorter detected cycles result in higher alpha values (increased responsiveness), while longer cycles produce lower alpha values (increased stability). This creates an automatic adaptation mechanism that responds to changing market conditions.
MAMA/FAMA Calculation Process:
The MAMA line applies the dynamically calculated alpha coefficient to an exponential moving average formula: MAMA = alpha × Price + (1 - alpha) × MAMA . The FAMA line then applies a secondary smoothing operation to the MAMA line, creating a following average that provides confirmation signals.
This dual-line approach ensures that the fast-adapting MAMA line captures trend changes quickly, while the FAMA line offers a smoother confirmation signal, reducing the likelihood of acting on temporary price fluctuations.
Cycle Detection Mechanism:
The underlying cycle detection employs quadrature components derived from the Hilbert Transform to measure both amplitude and phase characteristics of price movements. This allows the system to distinguish between genuine trend changes and temporary price noise, automatically adjusting the smoothing intensity accordingly.
The mathematical framework ensures that during strong trending periods with clear directional movement, the algorithm reduces smoothing to minimize lag. Conversely, during consolidation phases with mixed signals, increased smoothing helps filter out false breakouts and whipsaws.
📋 PARAMETER CONFIGURATION
Source Selection Strategy:
• HL2 (High+Low)/2 (Default): Recommended for cycle analysis as it represents the midpoint of each period's trading range, reducing impact of opening gaps and closing spikes
• Close Price: Traditional choice reflecting final market sentiment, suitable for end-of-day analysis
• HLC3 (High+Low+Close)/3: Balanced approach incorporating range information with closing emphasis
• OHLC4 (Open+High+Low+Close)/4: Most comprehensive price representation for complete market view
Fast Limit Configuration (Default 0.5):
Controls the maximum responsiveness of the adaptive system. Higher values increase sensitivity to recent price changes but may introduce more noise. This parameter sets the upper bound for the dynamic alpha calculation.
Slow Limit Configuration (Default 0.05):
Determines the minimum responsiveness, providing stability during uncertain market conditions. Lower values increase smoothing but may cause delayed signals. This parameter sets the lower bound for the dynamic alpha calculation.
Parameter Relationship Considerations:
The fast and slow limits work together to define the adaptive range. The wider the range between these limits, the more dramatic the adaptation between trending and consolidating market conditions. Different market characteristics may benefit from different parameter configurations, requiring individual testing and validation.
📊 COLOR CODING SYSTEM
Line Visualization:
• Green Line (MAMA): The fast-adapting moving average that responds quickly to price changes
• Red Line (FAMA): The following adaptive moving average that provides confirmation signals
The fixed color scheme provides consistent visual identification of each line, enabling clear differentiation between the fast-adapting MAMA and the following FAMA throughout all market conditions.
💡 CORE VALUE PROPOSITION
Advantages Over Traditional Moving Averages:
• Cycle Adaptation: Automatically adjusts to market's dominant cycle rather than using fixed periods
• Reduced Lag: Faster response to genuine trend changes while filtering market noise
• Mathematical Foundation: Based on advanced signal processing techniques from telecommunications engineering
• Dual-Line System: Provides both fast adaptation (MAMA) and confirmation (FAMA) in one indicator
Comparative Performance Characteristics:
Unlike fixed-period moving averages that apply the same smoothing regardless of market conditions, MAMA adapts its behavior based on current market cycle characteristics. This may help reduce whipsaws during consolidation periods while maintaining responsiveness during trending phases.
Usage Considerations:
This indicator is designed for technical analysis purposes. The adaptive nature means that parameter optimization should consider the specific characteristics of the asset and timeframe being analyzed. Like all technical indicators, MAMA should be used as part of a comprehensive analysis approach rather than as a standalone signal generator.
Alert Functionality:
The indicator includes alert conditions for MAMA/FAMA crossovers, enabling automated notification of potential momentum shifts. These alerts can assist in timing analysis but should be combined with other forms of market analysis for decision-making purposes.
Multi-MA Trend Indicator with ATR by nkChartsThe MMA-ATR is a powerful all-in-one tool that combines multi-timeframe Moving Averages with ATR-based Stop Loss & Take Profit levels. It is designed to help traders quickly assess trend direction, volatility, and potential trade levels in one clean visual setup.
Key Features
Multi-MA Trend Detection
Plots 5 customizable moving averages (choose from EMA, SMA, RMA, WMA, VWMA).
Automatic color coding: Bullish (green), Bearish (red), Neutral (gray).
MA Trend Table with:
MA values
Current chart trend
Higher timeframe (Daily) trend confirmation
ATR-Based Trade Levels
Dynamic Stop Loss (SL) and Take Profit (TP) levels based on ATR multipliers.
Separate visual lines for long and short setups.
ATR Table with:
ATR value for the current chart timeframe
ATR value for the Daily timeframe
Customizations
Choose MA type, length, and price source.
Customize bullish, bearish, and neutral colors.
Adjustable table position and text size.
Fully configurable ATR length, multipliers, and colors.
How to Use
Add the indicator to your chart.
Use the MA Trend Table to identify short-term and higher timeframe trend direction.
Refer to ATR-based SL/TP levels to manage risk and potential profit targets.
Combine both to filter entries and improve trade timing.
Best For
Swing traders and intraday traders who rely on trend confirmation and volatility-based risk management.
Traders looking for a multi-timeframe confirmation system that reduces noise.
⚠️ Disclaimer: This indicator is for educational purposes only. It does not provide financial advice or guarantee profits. Always perform your own analysis before making trading decisions.
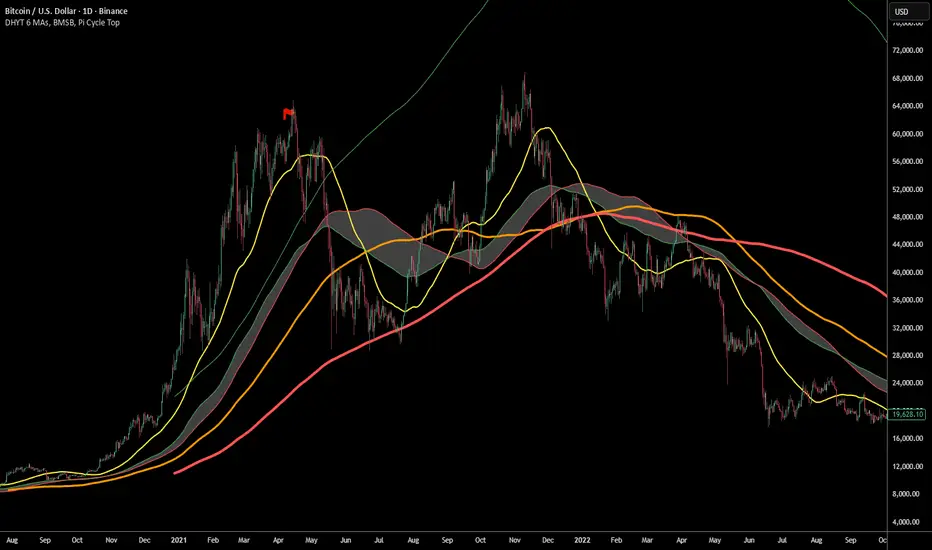
DHYT 6 MAs, BMSB, Pi Cycle TopThis indicator has 6 Moving averages that are highly customizable and visible on all time frames, it also includes the Bull Market Support Band (BMSB) and the Pi Cycle Top indicator which has been very good at predicting Cycle Tops for Bitcoin (BTC).
You can customize all the moving averages, as well as using simple or exponential. You can also easily customize colors and line weights.
Created by: Dan Heilman
ATR Enhanced [DCAUT]█ ATR Enhanced
📊 OVERVIEW
Standard ATR uses only RMA smoothing, while ATR Enhanced provides 20+ professional smoothing algorithms , offering precise volatility measurement solutions for different trading scenarios and market environments.
💡 CORE VALUE
- 20+ algorithm choices : SMA, EMA, RMA, WMA, HMA, T3, KAMA, FRAMA, Kalman Filter, etc.
📋 PARAMETER SETUP
ATR Length : Calculation period (default: 14)
Moving Average Type : Choose the most suitable smoothing method from 20+ algorithms
🎨 COLOR CODING
Green : Rising volatility
Red : Falling volatility

Double Moving Average█ OVERVIEW
The Double Moving Average (DMA) smooths one moving average with a second moving average.
Includes moving average type, higher timeframe, offset, alerts, and style settings for all of the indicator's visual components. This indicator includes an optional line and label to indicate the latest value of the DMA that repaints.
█ CONCEPTS
Shorter term moving averages, especially in choppy markets, can rapidly increase and decrease their slope. Which could lead some traders into assuming that the series trend may continue at that steeper slope. By smoothing a moving average with another one, the magnitude of rapid choppy movements is mitigated.
█ FEATURES
DMA Customization
Most inputs have a tooltip that can be read by interacting with the information icon to guide users.
For both moving averages in the DMA, users can set the lookback length and moving average type independently. Available moving average types include:
Simple Moving Average
Exponential Moving Average
Hull Moving Average
Weighted Moving Average
Volume Weighted Moving Average
A bar offset setting is included for shifting the indicator's placement. Using different lookback combinations for both averages alongside an offset can create equivalent values of other types of moving averages not included in this indicator. For example, if the default lookback settings are offset by 1 bar, this duplicates a 4 period centered moving average.
Colors for the DMA's plot can toggle between a single "base" color, or using increasing and decreasing colors. Changing the plot's style, line style, and width is also supported.
Latest Value Line and Label
The latest value of the DMA plot is replaced by default with a feature called the Latest Value Line and Label: a stylized line and label to help indicate the part of the indicator that can repaint from the parts that don't repaint. Data used to draw this feature is calculated separately from the indicator's confirmed historical calculations.
A label is included to display the latest value of the DMA which includes complete style settings. The style of both the line and label are completely customizable; every style feature that can be included has a corresponding input you can set.
Toggling off the Latest Value Line and Label feature will cause all the respective style inputs to deactivate so that they're no longer in focus or editable until the feature is toggled on again.
Higher Timeframes
Users can plot the DMA from higher timeframes on their chart.
As new bars print, the non-repainting DMA historical plot uses the last confirmed higher timeframe value. The repainting Latest Value Line and Label will update with the most recent higher timeframe value only for the latest bar. If the Latest Value Line feature is toggled off, the last confirmed higher timeframe DMA value is plotted up to the latest bar.
The built-in Moving Average Simple (SMA) indicator includes several of the features in this indicator, like an option for using higher timeframe. However, by default, it plots no values except on bars with higher timeframe close updates. Disabling "Wait for timeframe closes" to get values between updates causes repainting in both replay mode and realtime bars.
Since the calculations that repaint are separate and optional in the DMA indicator, historical plotted values will not repaint in replay mode or on realtime bars while using higher timeframes.
Alerts
There are two DMA value options when creating an alert:
DMA Latest Value: Use the latest updating DMA Value. The same value as the Latest Value Line.
DMA Last Confirmed Value: Use the last historical closed DMA value.
The default alert option is DMA Latest because most users expect alerts when the price crosses the latest updating DMA value. The Last Confirmed Value alert option uses the DMA value from the latest confirmed historical bar.
When creating an alert you should see a "Caution!" warning saying, "This is due to calculations being based on an indicator or strategy that can get repainted." This warning is intentional because the DMA indicator's Latest Value Line and Label feature is supposed to repaint in order to display the latest value.
█ FOR Pine Script™ CODERS
StyleLibrary is used to create user-friendly plot, line, and label style enum type inputs. The library's functions then take those user inputs and convert them into the appropriate values/built-in constants to customize styles for plot, line, and label functions.
Titles for #region blocks are included after #endregion statements for clarity when multiple #endregion statements occur.
This indicator utilizes the new active parameter for style inputs of togglable features.
8 EMA/SMA + HMA + Pivot PointsMultiple customizeable Moing average indictors including Hall moving average, Exponential Moving average. Also includes Pivot Point indicator as an all-in-one indicator
Auto SMA 50&200 (D,4h,1h)Auto SMA 50&200 (Daily, 4hr,1hr)
About this Indicator:
This indicator plots the 50 and 200 Simple Moving Average (SMA) as horizontal price levels for the Daily, 4 hour, and 1 hour time frames. The SMAs available in this indicator will appear on each time frame saving you from having to switch to different Time frames, or having multiple charts open to view the large point of view SMAs. This is perfect for those who like to chart off the large point of view and then switch into the smaller time frames.
Settings Input:
Master Button to toggle on/off Text Bubbles or Price Scale Labels
Text Position is set to best position by default.
Each SMA setting gives you the option to enable/disable it, hide the text label, change the color, change the line style, and line width.
Settings Style:
Under "Style" you will see that you cannot change the lines because they are set to transparent. The idea was to make sure you have the option to view the SMA Price Labels on the Price Scale without seeing the trend lines, which makes it too cluttered.
You can also individually show/hide the Label on the Price Scale for each SMA
Moving Average SlopeA simple tool that allows you to choose from multiple types of moving averages (e.g. WMA, EMA, SMA, HMA) and define the MA period, and lookback period for slope calculation.
SMA Cross 5/50 with Trend Filter & Risk Management by JuggiDThe basic SMA (5/50) crossover strategy can be enhanced to improve profitability by adding filters and risk management. For example, a long entry is triggered only when the fast SMA (5) crosses above the slow SMA (50) **and** the price is above the SMA (200), ensuring trades align with the major trend. Similarly, a short entry requires the crossover confirmation plus the price staying below the SMA (200). To reduce false signals and protect capital, stop-loss and take-profit levels can be set automatically (e.g., 2% loss, 5% gain), while additional confirmation tools such as volume spikes, RSI above 50, or MACD momentum can be applied to validate stronger signals. This approach helps avoid whipsaws in sideways markets and allows trades to capture larger moves while minimizing downside risk.

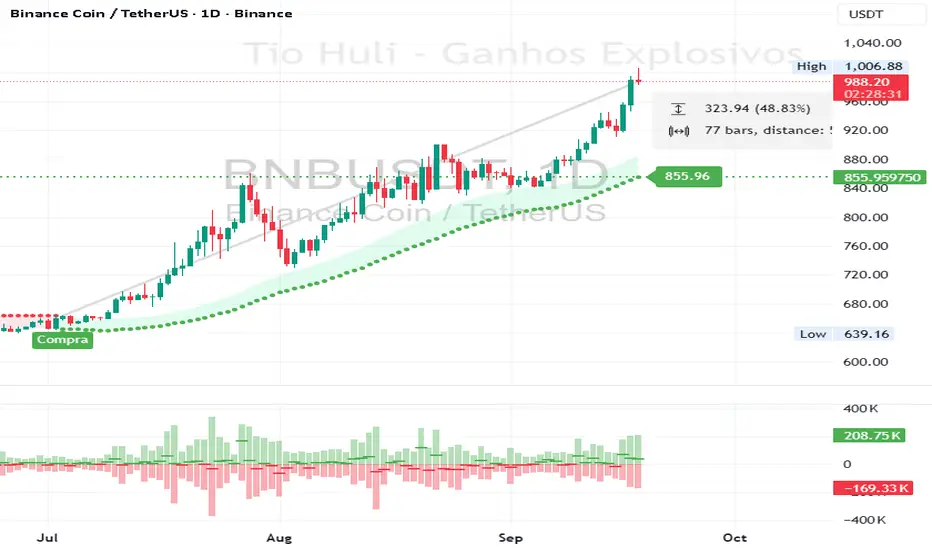
CHiLo — Custom HiLo (SMA/EMA, Activator, Shading, Auto-Decimals)CHiLo is a clean Hi/Lo trend read with SMA/EMA options, a HiLo vs. HiLo Activator mode, optional band shading , and a right-side HiLo marker with automatic decimals based on the symbol. Optional Buy/Sell labels mark state flips. Inspired by the broader trend-following literature and practitioners; in Brazil, educator Hulisses “Tio Huli” Dias is a notable voice popularizing trend following.
What it does
CHiLo plots a Hi/Lo state with two modes:
HiLo (classic high/low bands)
HiLo Activator (activator-style behavior)
It includes:
SMA/EMA selection
Optional shading between Hi/Lo bands
Optional Buy/Sell labels on state flips
HiLo marker (auto-decimals from the symbol’s tick size)
Goal: deliver a fast, visual trend context that you can pair with your own risk rules and confirmations.
How to use
Add the indicator and choose Mode (HiLo / Activator) and MA type (SMA/EMA).
Tune Period (and Offset if needed). Higher = smoother (fewer flips); lower = more responsive.
Toggle Shading to emphasize the envelope.
Toggle Buy/Sell labels if you want flip markers.
Use the HiLo marker on the right to read the current level (auto-formatted).
Inputs (quick reference)
Period / Offset — sensitivity vs. delay.
Type — HiLo or HiLo Activator.
MA Type — SMA (steadier) or EMA (snappier).
HiLo Style — Points or Line.
Shading & Transparency — highlight the band area.
Buy/Sell Labels — on/off.
HiLo Marker — size and horizontal offset (decimals automatic).
Notes & credits
Educational use only; not financial advice.
For best results, combine with position sizing, stops, and regime filters.

Anrazzi - EMAs/ATR - 1.0.2Description:
The Anrazzi - EMAs/ATR indicator is a versatile tool for technical traders looking to monitor multiple moving averages alongside the Average True Range (ATR) on any chart. Designed for simplicity and customization, it allows traders to visualize up to six moving averages with configurable type, color, and length, while keeping real-time volatility information via ATR directly on the chart.
This indicator is perfect for spotting trends, identifying support/resistance zones, and gauging market volatility for intraday or swing trading strategies.
Key Features:
Supports up to six independent moving averages (MA1 → MA6)
Each MA is fully customizable:
Enable/disable individually
Type: EMA or SMA
Length
Color
ATR Display:
Custom timeframe
Color and position configurable
Adjustable multiplier
Compact and organized settings for easy configuration
Lightweight and efficient code for smooth chart performance
Watermark
Inputs / Settings:
MA Options: MA1 → MA6 (Enable/Disable, Type, Length, Color)
Additional Settings: ATR (Enable, Timeframe, Color, Multiplier)
How to Use:
Enable the moving averages you want to track
Configure type, length, and color for each MA
Enable ATR if needed and adjust settings
Watch MAs plotted dynamically and ATR in bottom-right corner
Recommended For:
Day traders and swing traders
Trend-following strategies
Volatility analysis and breakout detection
Traders needing a compact multi-MA dashboard

Multiple Colored Moving AveragesMULTIPLE COLORED MOVING AVERAGES - USER GUIDE
DISCLAIMER
----------
Both the code and this documentation were created heavily using artificial intelligence. I'm lazy...
This indicator was inspired by repo32's "Moving Average Colored EMA/SMA" indicator. *
What is this indicator?
-----------------------
This is a TradingView indicator that displays up to 4 different moving averages on your chart simultaneously. Each moving average can be customized with different calculation methods, colors, and filtering options.
Why would I use multiple moving averages?
-----------------------------------------
- See trend direction across different timeframes at once
- Identify support and resistance levels
- Spot crossover signals between fast and slow MAs
- Reduce false signals with filtering options
- Compare how different MA types react to price action
What moving average types are available?
----------------------------------------
11 different types:
- SMA: Simple average, equal weight to all periods
- EMA: Exponential, more weight to recent prices
- WMA: Weighted, linear weighting toward recent data
- RMA: Running average, smooth like EMA
- DEMA: Double exponential, reduced lag
- TEMA: Triple exponential, even less lag
- HMA: Hull, fast and smooth combination
- VWMA: Volume weighted, includes volume data
- LSMA: Least squares, based on linear regression
- TMA: Triangular, double-smoothed
- ZLEMA: Zero lag exponential, compensated for lag
How do I set up the indicator?
------------------------------
Each MA has these settings:
- Enable/Disable: Turn each MA on or off
- Type: Choose from the 11 calculation methods
- Length: Number of periods (21, 50, 100, 200 are common)
- Smoothing: 0-10 levels of extra smoothing
- Noise Filter: 0-5% to ignore small changes
- Colors: Bullish (rising) and bearish (falling) colors
- Line Width: 1-5 pixels thickness
What does the smoothing feature do?
-----------------------------------
Smoothing applies extra calculations to make the moving average line smoother. Higher levels reduce noise but make the MA respond slower to price changes. Use higher smoothing in choppy markets, lower smoothing in trending markets.
What is the noise filter?
--------------------------
The noise filter ignores small percentage changes in the moving average. For example, a 0.3% filter will ignore any MA movement smaller than 0.3%. This helps eliminate false signals from minor price fluctuations.
When should I use this indicator?
---------------------------------
- Trend analysis: See if market is going up, down, or sideways
- Entry timing: Look for price bounces off MA levels
- Exit signals: Watch for MA slope changes or crossovers
- Support/resistance: MAs often act as dynamic levels
- Multi-timeframe analysis: Use different lengths for different perspectives
What are some good settings to start with?
-------------------------------------------
Conservative approach:
- MA 1: EMA 21 (short-term trend)
- MA 2: SMA 50 (medium-term trend)
- MA 3: SMA 200 (long-term trend)
- Low noise filtering (0.1-0.3%)
Active trading:
- MA 1: HMA 9 (very responsive)
- MA 2: EMA 21 (short-term)
- MA 3: EMA 50 (medium-term)
- Minimal or no smoothing
How do I interpret the colors?
------------------------------
Each MA changes color based on its direction:
- Bullish color: MA is rising (upward trend)
- Bearish color: MA is falling (downward trend)
- Gray: MA is flat or unchanged
What should I look for in crossovers?
-------------------------------------
- Golden Cross: Fast MA crosses above slow MA (bullish signal)
- Death Cross: Fast MA crosses below slow MA (bearish signal)
- Multiple crossovers in same direction can confirm trend changes
- Wait for clear separation between MAs after crossover
How do I use MAs for support and resistance?
---------------------------------------------
- In uptrends: MAs often provide support when price pulls back
- In downtrends: MAs may act as resistance on rallies
- Multiple MAs create support/resistance zones
- Stronger levels where multiple MAs cluster together
Can I use this with other indicators?
-------------------------------------
Yes, it works well with:
- Volume indicators for confirmation
- RSI or MACD for timing entries
- Bollinger Bands for volatility context
- Price action patterns for setup confirmation
What if I get too many signals?
-------------------------------
- Increase smoothing levels
- Raise noise filter percentages
- Use longer MA periods
- Focus on major crossovers only
- Wait for multiple MA confirmation
What if signals are too slow?
-----------------------------
- Reduce smoothing to 0
- Lower noise filter values
- Switch to faster MA types (HMA, ZLEMA, DEMA)
- Use shorter periods
- Focus on the fastest MA only
Which MA types work best in different markets?
----------------------------------------------
Trending markets: EMA, DEMA, TEMA (responsive to trends)
Choppy markets: SMA, TMA, HMA with smoothing (less whipsaws)
High volatility: Use higher smoothing and noise filtering
Low volatility: Use minimal filtering for better responsiveness
Do I need all the advanced features?
------------------------------------
No. Start with basic settings:
- Choose MA type and length
- Set colors you prefer
- Leave smoothing at 0
- Leave noise filter at 0
Add complexity only if needed to improve signal quality.
How do I know if my settings are working?
-----------------------------------------
- Backtest on historical data
- Paper trade the signals first
- Adjust based on market conditions
- Keep a trading journal to track performance
- Be willing to modify settings as markets change
Can I save different configurations?
------------------------------------
Yes, save different indicator templates in TradingView for:
- Different trading styles (scalping, swing trading)
- Different market conditions (trending, ranging)
- Different instruments (stocks, forex, crypto)

ZenAlgo - MarsThis indicator is a momentum-based oscillator built around a modified RSI calculation and subsequent smoothing with moving averages. It introduces a layered structure where divergences, signal crossovers, histogram dynamics, and multi-timeframe tables all combine into a comprehensive framework. The purpose is not to forecast markets with certainty but to provide structured context on momentum shifts, divergences, and trend bias.
Core Calculation
The base source is the closing price.
From it, relative upward and downward movements are measured over a chosen lookback length (by preset or manual input).
These values are normalized into an oscillator bounded between 0–100, equivalent to a traditional RSI structure.
This oscillator is smoothed by a moving average (SMA by default), producing the main line (MA).
A secondary smoothing (EMA by default) of the MA produces a signal line, against which crossovers are monitored.
Why this structure:
RSI captures momentum imbalance between gains and losses. Smoothing removes noise and makes divergences more stable to identify. Adding a signal line allows crossover events to highlight relative strengthening or weakening momentum phases.
Zones and Visual Guides
Static horizontal levels are placed at 70 (upper bound), 50 (mid-line), and 30 (lower bound).
The region between 30–70 is softly filled to emphasize the neutral zone.
Color changes on the MA line occur depending on whether it is above or below the signal line.
Why these levels:
Values above 70 or below 30 are commonly interpreted as overextended regions. A central 50 line separates positive from negative bias. These anchors allow consistent interpretation of oscillator movements.
Crossover Events
Alerts and conditions are defined for when the MA crosses above or below the signal line.
These are not entry signals by themselves but indicate shifts in relative momentum strength.
Divergence Detection
Divergences are calculated on the smoothed MA rather than raw RSI.
Four conditions are tracked:
Regular bullish (price makes a lower low while MA makes a higher low).
Hidden bullish (price higher low with MA lower low).
Regular bearish (price higher high with MA lower high).
Hidden bearish (price lower high with MA higher high).
Each detected divergence is marked with shapes and labeled "R" (regular) or "H" (hidden).
Why divergences are used:
They highlight when oscillator momentum disagrees with price structure. Regular divergences often suggest exhaustion, while hidden divergences may appear during continuation phases.
RSI & MA Multi-Timeframe Table
A table can be displayed showing RSI and MA values across multiple timeframes (1m, 5m, 15m, 1h, 4h, 1D).
For each, the relationship (Rising, Falling, Neutral) is determined by comparing RSI and MA.
Colors are adjusted depending on value ranges (extreme low, oversold, overbought, etc.).
Added value:
Instead of analyzing divergences or crossovers only on one chart, the table provides a compact overview of aligned or conflicting conditions across timeframes.
Strong and Warning Indications
"Strong" mark (Diamond) appear when the MA is firmly biased above or below 50 and hidden divergence supports the trend.
"Warning" mark (Triangle) appear when bias is strong but a regular divergence forms in the opposite direction.
Shapes mark these conditions, and alerts are available.
Why this distinction:
Hidden divergences often accompany continuation phases, while regular divergences may challenge the prevailing bias. Marking them separately allows the user to distinguish between potential trend reinforcement versus warning conditions.
Signal Table
A separate table summarizes:
Overall trend bias (Bull, Full Bull, Bear, Full Bear, Flat).
Time spent in each key zone.
Current MA trend (Rising, Falling, Flat).
Visual icons and color codes provide quick interpretation.
Time in Zones
The indicator measures how many bars (converted into minutes) the MA has spent:
above 70
above 50
below 50
below 30
These values appear in the signal table.
Why this matters:
Extended time in an extreme zone can show persistent momentum. Quick reversals versus sustained positioning give different context for bias strength.
MA vs Signal Histogram
A histogram plots the difference between MA and signal line, shifted around the 50 level.
Rising differences are shown with brighter coloring, falling differences with faded tones.
This emphasizes whether momentum is accelerating or decelerating.
Daily VWAP Integration
When the MA crosses the 50 level, additional conditions check whether the histogram is aligned and whether price is above or below the daily VWAP.
Only when both momentum bias and VWAP alignment agree are triangle markers shown.
Why VWAP is included:
VWAP serves as an intraday mean reference. Requiring alignment between oscillator momentum and price position relative to VWAP reduces random crossover noise.
Added Value Over Free Indicators
Divergences are calculated on smoothed momentum rather than raw RSI, reducing false positives.
Integration of multi-timeframe tables avoids the need to manually switch charts.
Bias measurement in terms of time spent in zones adds a temporal dimension often missing in basic oscillators.
Combining histogram dynamics with VWAP filtering provides context not present in typical RSI or MA overlays.
Limitations and Disclaimers
Divergences are not predictive on their own; price may continue without respecting them.
Extreme readings (e.g., above 70) can remain extended for long periods, especially in strong trends.
Multi-timeframe aggregation may introduce repainting effects when lower timeframes update faster than higher ones.
Signals must be interpreted in broader market context; the indicator does not provide trade entries or exits by itself.
How to Interpret Values
Above 70: momentum is strongly stretched upward.
Below 30: momentum is strongly stretched downward.
Crossing 50: often marks a structural change in directional bias.
MA rising vs. falling: tracks whether momentum pressure is increasing or decreasing.
Divergence labels: "R" = potential reversal, "H" = potential continuation.
Tables: confirm whether bias is consistent across multiple timeframes.
Best Use
Observe divergences in conjunction with bias tables to understand whether short-term moves align with higher-timeframe conditions.
Treat "Strong" and "Warning" markers as contextual alerts, not direct signals.
Use the histogram and VWAP alignment to filter out weaker crossovers.
Combine with price action and risk management rather than using in isolation.