Bollinger Bands Lab - by InFinitoVariation of the Moving Average Lab that includes Bollinger Bands functionality for any manually created Moving Average. It includes:
- Standard Deviations for any MA
- Fixed Symmetrical Deviations for any MA that remain at a constant % away from the MA
- The same Moving Average creation settings from the Moving Average Lab
"The Moving Average Lab allows to create any possible combination of up to 3 given MAs. It is meant to help you find the perfect MA that fits your style, strategy and market type.
This script allows to average, weight, double and triple multiple types and lengths of Moving Averages
Currently supported MA types are:
SMA
EMA
VWMA
WMA
SMMA (RMA)
HMA
LSMA
DEMA
TEMA
Features:
- Double or Triple any type of Moving Average using the same logic used for calculating DEMAs and TEMAs
- Average 2 or 3 different types and lengths of Moving Average
- Weight each MA manually
- Average up to 3 personalized MAs
- Average different Moving Averages with different length each "
The preview screenshot shows:
- The combination of:
- 200 LSMA - Weight: 1
- 200 HMA - Weight: 2
- 200 VWMA - Weight: 1 - Double
- The regular Bollinger Band setting, 2 standard deviations
- Two fixed symmetrical deviations at 15% and 20% away from the XMA
Moving_average
Regularized-Moving-Average Oscillator SuiteThe Regularized-MA Oscillator Suite is a versatile indicator that transforms any moving average into an oscillator. It comprises up to 13 different moving average types, including KAMA, T3, and ALMA. This indicator serves as a valuable tool for both trend following and mean reversion strategies, providing traders and investors with enhanced insights into market dynamics.
Methodology:
The Regularized MA Oscillator Suite calculates the moving average (MA) based on user-defined parameters such as length, moving average type, and custom smoothing factors. It then derives the mean and standard deviation of the MA using a normalized period. Finally, it computes the Z-Score by subtracting the mean from the MA and dividing it by the standard deviation.
KAMA (Kaufman's Adaptive Moving Average):
KAMA is a unique moving average type that dynamically adjusts its smoothing period based on market volatility. It adapts to changing market conditions, providing a smoother response during periods of low volatility and a quicker response during periods of high volatility. This allows traders to capture trends effectively while reducing noise.
T3 (Tillson's Exponential Moving Average):
T3 is an exponential moving average that incorporates additional smoothing techniques to reduce lag and provide a more responsive indicator. It aims to maintain a balance between responsiveness and smoothness, allowing traders to identify trend reversals with greater accuracy.
ALMA (Arnaud Legoux Moving Average):
ALMA is a moving average type that utilizes a combination of linear regression and exponential moving average techniques. It offers a unique way of calculating the moving average by providing a smoother and more accurate representation of price trends. ALMA reduces lag and noise, enabling traders to identify trend changes and potential entry or exit points more effectively.
Z-Score:
The Z-Score calculation in the Regularized-MA Oscillator Suite standardizes the values of the moving average. It measures the deviation of each data point from the mean in terms of standard deviations. By normalizing the moving average through the Z-Score, the indicator enables traders to assess the relative position of price in relation to its mean and volatility. This information can be valuable for identifying overbought and oversold conditions, as well as potential trend reversals.
Utility:
The Regularized-MA Oscillator Suite with its unique moving average types and Z-Score calculation offers traders and investors powerful analytical tools. It can be used for trend following strategies by analyzing the oscillator's position relative to the midline. Traders can also employ it as a mean reversion tool by identifying peak values above user-defined deviations. These features assist in identifying potential entry and exit points, enhancing trading decisions and market analysis.
Key Features:
Variety of 13 MA types.
Potential reversal point bubbles.
Bar coloring methods - Trend (Midline cross), Extremities, Reversions, Slope
Example Charts:

MTF MAs and Crosses Nexus [DarkWaveAlgo]🧾 Description:
A nexus is a connection, link, or neuronal junction where signals and information are transmitted between different elements.
The MTF MAs and Crosses Nexus indicator serves as a nexus between MTF Moving Averages by facilitating the visualization and interaction of up to eight multi-timeframe moving averages, each with its own customizable timeframe, period, cross-over and cross-under alerts and plot markers, moving average calculation type, and price source.
It acts as a utility/control center that brings together multiple MTF moving averages (MTF MAs) and allows you to visualize the interactions between them with exceptional ease-of-use and customizability, helping to provide you with valuable insights into potential trend reversals, momentum shifts, and trading opportunities.
💡 Originality and Usefulness:
While there are other multi-timeframe moving average indicators available, MTF MAs and Crosses Nexus' customizable alert and signal settings offer intra-indicator MTF moving average cross markers and alerts not seen in other MTF MA indicators, allowing you to visualize the cross-over and cross-under relationships between the indicator's MAs with an 'all-in-one' experience. We also believe it stands above the rest with its sheer quantity and quality of settings, features, and usability.
✔️ Re-Published to Avoid Misleading Values
This script has been re-published to ensure that it does not use `request.security()` calls using lookahead_on to access future data when referencing moving averages from other timeframes. This decreases the likelihood that the indicator will provide deceiving values. This change has been made in accordance with the PineScript documentation: "Using barmerge.lookahead_on at timeframes higher than the chart's without offsetting the `expression` argument like in `close ` will introduce future leak in scripts, as the function will then return the `close` price before it is actually known in the current context" and the Publishing Rule: "Do not use `request.security()` calls using lookahead to access future data".
💠 Features:
8 toggleable MTF Moving Averages with customizable timeframes, periods, moving average calculation types, and price sources
Customizable cross-over and cross-under alert and chart signal options for each MTF MA (toggleable cross alerts and signals for crosses between intra-indicator MAs and bar price values)
Aesthetic and flexible coloring and color theme styling options
End-of chart labels and options for ease-of-use and legibility
⚙️ Settings:
Use a Color Theme: When this setting is enabled, all manual 'Bullish and Bearish Colors' are overridden. All plots will use the colors from your selected Color Theme - excepting those plots set to use the 'Single Color' coloring method.
Color Theme: When 'Use a Color Theme' is enabled, this setting allows you to select the color theme you wish to use.
Hide MAs on Timeframes Lower Than the Chart: When this setting is enabled, any MTF MA with a timeframe smaller than that of the chart the indicator is applied to will be hidden from view.
Enable: Show/hide a specific MTF MA.
Timeframe: Set the timeframe for a specific MTF MA.
Period: Set the lookback period for a specific MTF MA.
Type: Set the calculation type for a specific MTF MA. Options include: Exponential, Simple, Weighted, Volume-Weighted, and Hull.
Source Price: Set the source value used for a specific MTF MA's calculation.
Enable Cross Over Signals & Alerts: When enabled, cross-over chart signals (markers) and alerts are enabled for when this specific MTF MA crosses above its respective 'Cross Over Cross Source'.
Enable Cross Under Signals & Alerts: When enabled, cross-under chart signals (markers) and alerts are enabled for when this specific MTF MA crosses below its respective 'Cross Under Cross Source'.
Cross Source: Set the target plot which this specific MTF MA must cross (for either a cross-over or cross-under event) to trigger a chart signal and alert.
Marker Position: Set the position where this specific MTF MA's cross chart signal should appear. Options include: Above Bar, Below Bar, and On MA Line.
Coloring Method: Set the coloring method for this specific MA. The coloring method defines how the MA should be dynamically colored. Options include: Single Color, Increasing/Decreasing, and Over/Under Price.
Bullish Color: When 'Use a Color Theme' is disabled, this will set the 'bullish color' for this specific MTF MA.
Bearish Color: When 'Use a Color Theme' is disabled, this will set the 'bearish color' for this specific MTF MA.
Single Color: When the 'Coloring Method' is set to Single Color for this specific MA, this color option will set the MA's color.
Enable Label: When enabled, a label will show at the end of the chart displaying the timeframe, period, MA type, and current price value of this specific MTF MA.
Size: Sets the font size of this specific MTF MA's label.
Label Offset (in Bars): Sets the distance from the latest bar, in bars, at which this specific MTF MA's label is displayed.
Show Label Line: When enabled, this specific MTF MA's label will be accommodated by a dashed line connecting it to its plot.
📈 Chart:
The chart shown in this original publication displays the 15 minute chart on BTCUSDT. Displayed on the chart are 4 MTF MAs: the 15m 20 WMA, 30m 100 EMA, 1h 11 EMA, and 1D 7 VWMA - offering an exemplary view of how you can use these MTF MAs and crosses to your advantage in gauging trend relationships across multiple timeframes.

Key Levels (Open, Premarket, & Yesterday)OVERVIEW
This indicator automatically identifies and draws recent high-probability support and resistance levels (recent key levels). Specifically, yesterdays highs / lows, premarket highs / lows, as well as yesterdays end of day Volume Weighted Average Price and trader specified Moving Average.
This is most useful on charts with intraday time frames (1 minute, 5 minute etc.) commonly used for day trading. This is not ideal for larger time frames (greater than 1 hour) commonly used for swing trading or identifying larger trends.
INPUTS
You can configure:
Line size, style, and colors
Label colors
Which key levels you want to see
Moving Average Parameters
Market Hours and Time Zone
DEV NOTES
This script illustrates:
A method for iterative management of more complex data objects (not just discrete values) with loops and arrays.

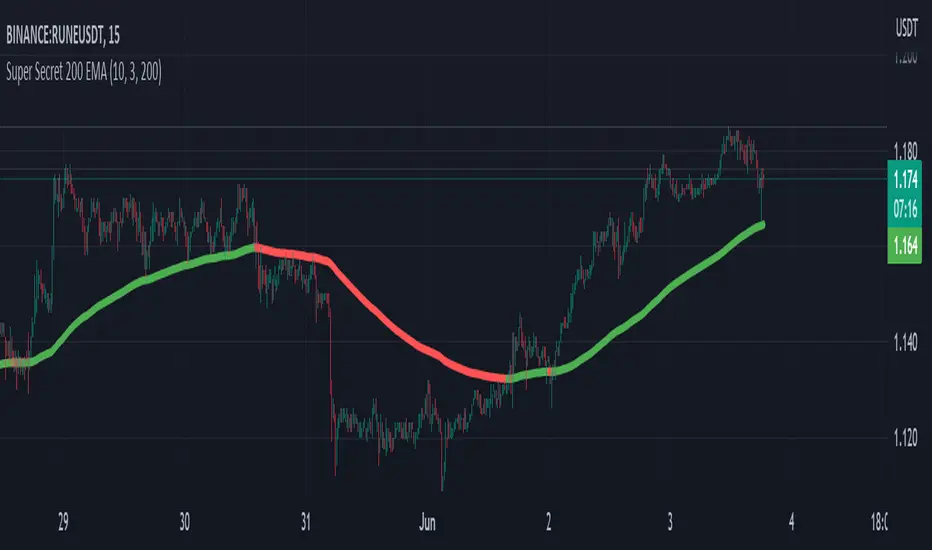
Super Secret 200 EMAThe indicator is called "Super Secret 200 EMA." It combines two technical indicators, the Supertrend and the 200 Exponential Moving Average (EMA), to generate buy and sell opportunities in a trading chart.
Here's how the indicator works and how you can use it:
Supertrend Calculation:
The Supertrend indicator helps identify the current trend in the market. It uses two parameters: Length and Multiplier.
Length: This parameter determines the number of periods used for the calculation.
Multiplier: It controls the width of the Supertrend line, indicating the level of volatility considered in the calculation.
The Supertrend is calculated by looping through the historical data from length to 1.
For each period, it checks whether the closing price has increased or decreased compared to the previous period.
If the closing price has increased, it updates the highestHigh value with the maximum of the current highest high and the high of the current period.
If the closing price has decreased, it updates the lowestLow value with the minimum of the current lowest low and the low of the current period.
Finally, it calculates the Supertrend value using the following formula:
If the change in the closing price is positive: Supertrend = lowestLow + (multiplier * Average True Range (ATR))
If the change in the closing price is negative: Supertrend = highestHigh - (multiplier * ATR)
The Supertrend line will be green if it is above the 200 EMA line and red if it is below.
200 EMA Calculation:
The 200 EMA is a widely used moving average indicator that gives more weight to recent prices.
The EMA period is set to 200 in this case.
The 200 EMA is calculated using the EMA formula, taking into account the closing prices over the specified period.
Plotting:
The Supertrend and 200 EMA lines are plotted on the chart using the plot function.
The Supertrend line is colored green if it is above the 200 EMA line and red if it is below.
The 200 EMA line is colored green if the closing price is above it and red if it is below.
Buy and Sell Conditions:
The indicator determines the buy and sell conditions based on the crossover and crossunder of the closing price with the 200 EMA line and the Supertrend line.
Buy Condition: A buy signal is generated when the closing price crosses above the 200 EMA line and is also above the Supertrend line.
Sell Condition: A sell signal is generated when the closing price crosses below the 200 EMA line and is also below the Supertrend line.
Plotting Buy and Sell Signals:
You can use this indicator to identify potential buy and sell opportunities in your trading strategy. However, please note that this is a simplified explanation, and it's essential to thoroughly understand the indicator's principles and backtest it with historical data before relying on it for actual trading decisions.
Use this with other confluences for best results and never rely on a single indicator
T3 JMA KAMA VWMAEnhancing Trading Performance with T3 JMA KAMA VWMA Indicator
Introduction
In the dynamic world of trading, staying ahead of market trends and capitalizing on volume-driven opportunities can greatly influence trading performance. To address this, we have developed the T3 JMA KAMA VWMA Indicator, an innovative tool that modifies the traditional Volume Weighted Moving Average (VWMA) formula to increase responsiveness and exploit high-volume market conditions for optimal position entry. This article delves into the idea behind this modification and how it can benefit traders seeking to gain an edge in the market.
The Idea Behind the Modification
The core concept behind modifying the VWMA formula is to leverage more responsive moving averages (MAs) that align with high-volume market activity. Traditional VWMA utilizes the Simple Moving Average (SMA) as the basis for calculating the weighted average. While the SMA is effective in providing a smoothed perspective of price movements, it may lack the desired responsiveness to capitalize on short-term volume-driven opportunities.
To address this limitation, our T3 JMA KAMA VWMA Indicator incorporates three advanced moving averages: T3, JMA, and KAMA. These MAs offer enhanced responsiveness, allowing traders to react swiftly to changing market conditions influenced by volume.
T3 (T3 New and T3 Normal):
The T3 moving average, one of the components of our indicator, applies a proprietary algorithm that provides smoother and more responsive trend signals. By utilizing T3, we ensure that the VWMA calculation aligns with the dynamic nature of high-volume markets, enabling traders to capture price movements accurately.
JMA (Jurik Moving Average):
The JMA component further enhances the indicator's responsiveness by incorporating phase shifting and power adjustment. This adaptive approach ensures that the moving average remains sensitive to changes in volume and price dynamics. As a result, traders can identify turning points and anticipate potential trend reversals, precisely timing their position entries.
KAMA (Kaufman's Adaptive Moving Average):
KAMA is an adaptive moving average designed to dynamically adjust its sensitivity based on market conditions. By incorporating KAMA into our VWMA modification, we ensure that the moving average adapts to varying volume levels and captures the essence of volume-driven price movements. Traders can confidently enter positions during periods of high trading volume, aligning their strategies with market activity.
Benefits and Usage
The modified T3 JMA KAMA VWMA Indicator offers several advantages to traders looking to exploit high-volume market conditions for position entry:
Increased Responsiveness: By incorporating more responsive moving averages, the indicator enables traders to react quickly to changes in volume and capture short-term opportunities more effectively.
Enhanced Entry Timing: The modified VWMA aligns with high-volume periods, allowing traders to enter positions precisely during price movements influenced by significant trading activity.
Improved Accuracy: The combination of T3, JMA, and KAMA within the VWMA formula enhances the accuracy of trend identification, reversals, and overall market analysis.
Comprehensive Market Insights: The T3 JMA KAMA VWMA Indicator provides a holistic view of market conditions by considering both price and volume dynamics. This comprehensive perspective helps traders make informed decisions.
Analysis and Interpretation
The modified VWMA formula with T3, JMA, and KAMA offers traders a valuable tool for analyzing volume-driven market conditions. By incorporating these advanced moving averages into the VWMA calculation, the indicator becomes more responsive to changes in volume, potentially providing deeper insights into price movements.
When analyzing the modified VWMA, it is essential to consider the following points:
Identifying High-Volume Periods:
The modified VWMA is designed to capture price movements during high-volume periods. Traders can use this indicator to identify potential market trends and determine whether significant trading activity is driving price action. By focusing on these periods, traders may gain a better understanding of the market sentiment and adjust their strategies accordingly.
Confirmation of Trend Strength:
The modified VWMA can serve as a confirmation tool for assessing the strength of a trend. When the VWMA line aligns with the overall trend direction, it suggests that the current price movement is supported by volume. This confirmation can provide traders with additional confidence in their analysis and help them make more informed trading decisions.
Potential Entry and Exit Points:
One of the primary purposes of the modified VWMA is to assist traders in identifying potential entry and exit points. By capturing volume-driven price movements, the indicator can highlight areas where market participants are actively participating, indicating potential opportunities for opening or closing positions. Traders can use this information in conjunction with other technical analysis tools to develop comprehensive trading strategies.
Interpretation of Angle and Gradient:
The modified VWMA incorporates an angle calculation and color gradient to further enhance interpretation. The angle of the VWMA line represents the slope of the indicator, providing insights into the momentum of price movements. A steep angle indicates strong momentum, while a shallow angle suggests a slowdown. The color gradient helps visualize this angle, with green indicating bullish momentum and purple indicating bearish momentum.
Conclusion
By modifying the VWMA formula to incorporate the T3, JMA, and KAMA moving averages, the T3 JMA KAMA VWMA Indicator offers traders an innovative tool to exploit high-volume market conditions for optimal position entry. This modification enhances responsiveness, improves timing, and provides comprehensive market insights.
Enjoy checking it out!
---
Credits to:
◾ @cheatcountry – Hann Window Smoothing
◾ @loxx – T3
◾ @everget – JMA

Price Action (ValueRay)With this indicator, you gain access to up to 5 moving averages from a selection of 15 different types. This flexibility allows you to customize your trading strategy based on your preferences and market conditions. Whether you're a fan of simple moving averages, exponential moving averages, or weighted moving averages, our indicator has got you covered! Additionally, all the MAs are Multi-Time-Frame!
The indicator also provides trading signals. By analyzing market trends and price movements, it generates accurate buy and sell signals, providing you with clear entry and exit points. You can choose between Fast, Mid, and Slow signal speeds.
Trendlines are another crucial aspect of effective trading, and our indicator seamlessly integrates them, helping you visualize the market's direction.
Furthermore, the indicator empowers you with recent highs and lows. By highlighting these key levels, it becomes easier than ever to spot support and resistance areas, aiding you in making well-informed trading choices.
Additionally, you can switch the ADR% (Average Daily Range as a Percentage) on and off. This number instantly provides you with information on how much the stock usually moves per day as a percentage.
Key Features:
Up to 5 Moving Averages, each with its own timeframe.
SMA, EMA, WMA, RMA, Triangular, Volume Weighted, Elastic Volume Weighted, Least Squares, ZLEMA, Hull, Double EMA, Triple EMA, T3, ALMA, KAMA (more to come in future versions).
Recent High and Low Pivot Points acting as support/resistance.
Trendline indicating the current trend.
Buy/Sell Signals (recommended for use as exit points, stop loss, or take profit levels).
Signals can have three different speeds: Fast, Mid, and Slow. You can switch them anytime depending on how quickly or slowly you want to exit a trade.
The predefined colors are best suited for a dark background, and the predefined settings provide a solid starting point that many traders use in their daily work.
Unlock the full potential of your trading strategy with our comprehensive indicator and start making informed trading decisions today!

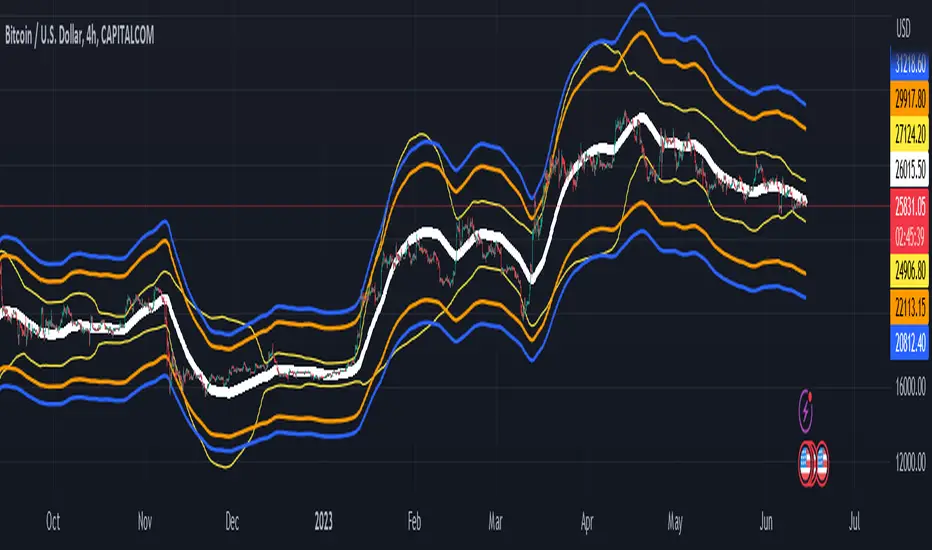
Moving Averages + BB & R.VWAP StDev (multi-tf)█ Moving Averages + Bollinger Bands and Rolling Volume Weighted Average Price with Standard Deviation Bands (Multi Timeframe)
Multiple moving averages can be independently applied.
The length , type and timeframe of each moving average are configurable .
The lines and colors are customizable too.
This script can display:
Moving Averages
Bollinger Bands
Rolling VWAP and Standard Deviation Bands
Types of Moving Averages:
Simple Moving Average (SMA)
Exponential Moving Average (EMA)
Smoothed Moving Average (SMMA)
Weighted Moving Average (WMA)
Volume Weighted Moving Average (VWMA)
Least Squares Moving Average (LSMA)
Hull Moving Average (HMA)
Arnaud Legoux Moving Average (ALMA)
█ Moving Average
Moving Averages are price based, lagging (or reactive) indicators that display the average price of a security over a set period of time.
A Moving Average is a good way to gauge momentum as well as to confirm trends, and define areas of support and resistance.
█ Bollinger Bands
Bollinger Bands consist of a band of three lines which are plotted in relation to security prices.
The line in the middle is usually a Simple Moving Average (SMA) set to a period of 20 days (the type of trend line and period can be changed by the trader, a 20 day moving average is by far the most popular).
The SMA then serves as a base for the Upper and Lower Bands which are used as a way to measure volatility by observing the relationship between the Bands and price.
█ Rolling VWAP
The typical VWAP is designed to be used on intraday charts, as it resets at the beginning of the day.
Such VWAPs cannot be used on daily, weekly or monthly charts. Instead, this rolling VWAP uses a time period that automatically adjusts to the chart's timeframe.
You can thus use the rolling VWAP on any chart that includes volume information in its data feed.
Because the rolling VWAP uses a moving window, it does not exhibit the jumpiness of VWAP plots that reset.
Based on the previous script :

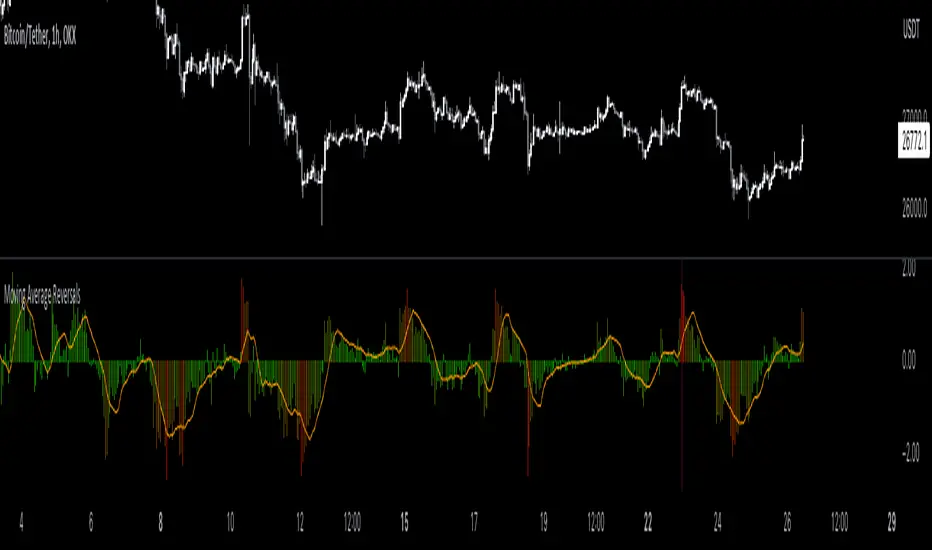
Moving Average Reversals [QuantVue]Moving Average Reversals
Description:
The Moving Average Reversals indicator gives a quick visual representation of when a stock gets extended up or down from a user selected moving average.
The color of the histogram dynamically changes as price becomes extended or within it’s normal trading range.
The indicator also highlights the largest extensions over the past year or 252 bars if using intraday.
Lastly a simple moving average of the extensions is calculated and used to confirm a change of character.
Settings:
🔹Use different MA types - EMA, SMA, HMA, WMA, VWMA
🔹Adjustable MA length
🔹Change distance measurement source - open, close, high, low, hl2, hlc3, ohlc4, hlcc4
🔹Extension highlighting
🔹Toggle MA extensions
Don't hesitate to reach out with any questions or concerns. We hope you enjoy!
Cheers.
VWAP + 2 Moving Averages + RSI + Buy and SellIndicator: VWAP + 2 Moving Averages + RSI + Buy and Sell
Buy and Sell Arrows (Great for use alone or in conjunction with other scripts on the chart)
This indicator displays BUY (BUY) and SELL (SELL) arrows on the chart based on a combination of moving averages, VWAP and RSI. Arrows are a visual way to identify trading opportunities and can be useful for traders who want to follow a strategy based on these conditions.
The indicator uses two moving averages (20 and 50 periods) to identify upward crosses (buy) and downward crosses (sell). In addition, it takes into account VWAP (Volume Weighted Average Price) and RSI (Relative Strength Index) as additional filters to confirm buy and sell signals.
This script is great for use both independently and in conjunction with other indicators and strategies. You can combine it with other indicators and customize it to your preferences to create a more comprehensive trading strategy.
Please remember that this indicator is provided for educational purposes only and does not constitute financial advice. It is always recommended to carry out a thorough analysis before making any trading decisions.
Give this indicator a try and enjoy clear visualization of buy and sell arrows on your chart. Happy trading!

MA Correlation CoefficientThis script helps you visualize the correlation between the price of an asset and 4 moving averages of your choice. This indicator can help you identify trendy markets as well as trend-shifts.
Disclaimer
Bear in mind that there is always some lag when using Moving-Averages, hence the purpose of this indicator is as a trend identification tool rather than an entry-exit strategy.
Working Principle
The basic idea behind this indicator is the following:
In a trendy market you will find high correlation between price and all kinds of Moving-Averages. This works both ways, no matter bull or bear trend.
In sideways markets you might find a mix of correlations accross timeframes (2018) or high correlation with Low-Timeframe averages and low correlation with High-Timeframe averages (2021/2022).
Trend shifts might be characterised by a 'staircase' type of correlation (yellow), where the asset regains correlation with higher timeframe averages
Indicator Options
1. Source : data used for indicator calculation
1. Correlation Window : size of moving window for correlation calculation
2. Average Type :
Simple-Moving-Average (SMA)
Exponential-Moving-Average (EMA)
Hull-Moving-Average (HMA)
Volume-Weighted-Moving-Average (VWMA)
3. Lookback : number of past candles to calculate average
4. Gradient : modify gradient colors. colors relate to correlation values.
Plot Explanation
The indicator plots, using colors, the correlation of the asset with 4 averages. For every candle, 4 correlation values are generated, corresponding to 4 colors. These 4 colors are stacked one on top of the other generating the patterns explained above. These patterns may help you identify what kind of market you're in.

MultiMovesCombines 3 different moving averages together with the linear regression. The moving averages are the HMA, EMA, and SMA. The script makes use of two different lengths to allow the end user to utilize common crossovers in order to determine entry into a trade. The edge of each "cloud" is where each of the moving averages actually are. The bar color is the average of the shorter length combined moving averages.
-The Hull Moving Average (HMA), developed by Alan Hull, is an extremely fast and smooth moving average. In fact, the HMA almost eliminates lag altogether and manages to improve smoothing at the same time. A longer period HMA may be used to identify trend.
-The exponential moving average (EMA) is a technical chart indicator that tracks the price of an investment (like a stock or commodity) over time. The EMA is a type of weighted moving average (WMA) that gives more weighting or importance to recent price data.
-A simple moving average (SMA) is an arithmetic moving average calculated by adding recent prices and then dividing that figure by the number of time periods in the calculation average.
-The Linear Regression Indicator plots the ending value of a Linear Regression Line for a specified number of bars; showing, statistically, where the price is expected to be. Instead of plotting an average of past price action, it is plotting where a Linear Regression Line would expect the price to be, making the Linear Regression Indicator more responsive than a moving average.
The lighter colors = default 50 MA
The darker colors = default 200 MA

Average Trend with Deviation Bands v2TL;DR: An average based trend incl. micro trend spotting and multiple display options.
This script is basically an update of my "Average Trend with Deviation Bands" script. I made the following changes:
Not an overlay anymore - The amount of drawn lines makes the chart pretty messy. That's why I moved it to a pane. If you preferred the overlay you can use my "Average Trend with Deviation Bands" script. *This is also the reason why I publish this script instead of updating the existing one.
I added an EMA to represent the price movement instead of candles
I added a signal (SMA) to spot micro trends and early entry/exit signals
I added the option to switch between a "line view" which shows the average trend and deviation bands and an "oscillator view" which shows an oscillator and histogram (MACD style)
General usage:
1. The white line is the average trend (which is an average of the last N bars open, close, high, low price).
2. Bands around the average trend are standard deviations which can be adjusted in the options menu and are only visible in "lines view". Basically they are like the clouds in the Ichimoku Cloud indicator - In big deviation bands the price movement needs more "power" to break through the average trend and vice versa.
3. Indicator line (blue line) - This is the EMA which represents the price. Crossing the average trend from below indicates an uptrend and vice versa (crossing from above indicates a down trend).
4. Signal line (red line) - This is a smoothed version of the indicator line which can be used to predict the movement of the price when crossed by the indicator line (like at MACD and many other indicators).
Oscillator usage:
When switched to "oscillator view" the indicator line oscillates around a zero line which can be seen as the average trend. The usage is basically the same as described above. However there is also the histogram which shows the difference between the indicator and signal. Of course the histogram can be deactivated. Additionally a color filling can be added to easily spot entry/exit signals.
As always: Code is free do whatever you like. If you have any questions/comments/etc. just drop it in the comment section.

T3 OscillatorTL;DR - An Oscillator based on T3 moving average
The T3 moving average is a well known moving average created by Tim TIllson. Oscillator values are created by using the simple formula "source (close by default) - T3 moving average". Tim Tillson used a "volume factor" of 0.7 in his original T3 calculation. I changed this value to 0.618 and added the option to change it if needed/wanted. I also added alarms for zero line crossing upwards and downward, a smoothing option and custom time frames.
Compared to other oscillators like TSI, MACD etc. I observed better signals, especially in trending market situations, from the T3 oscillator (I tested Forex and Crypto).
Usage is simple: If the oscillator is above 0 it indicates a bearish trend. If below 0 it indicates a bullish trend. -> Really simple to use. However it can also be used to determine micro trends and reversals when combined with price action analysis. To keeps things simple I have not added a moving average like many other oscillators because I think it is confusing and does not help (in this particular case).
P.S. I haven't found a T3 oscillator on Trading View. Code is free - do whatever you want with it ;)

Fetch ATR + MA StrategyA trend following indicator that allows traders/investors to enter trades for the long term, as it is mainly tested on the daily chart. The indicator fires off buy and sell signals. The sell signals can be turned off as trader can decide to use this indicator for long term buy signals. The buy signals are indicated by the green diamonds, and the red diamonds show the points on then chart where the asset can be sold.
The indicator uses a couple indicators in order to generate the buy signals:
- ADX
- ATR
- Moving Average of ATR
- 50 SMA
- 200 SMA
The buy signal is generated at the cross overs of the 50 and 200 SMA's while the ATR is lower than then Moving Average of the ATR. The buy signal is fired when these conditions are met and if the ADX is lower than 30.
The thought process is as follows:
When the ATR is lower than its moving average, the price should be in a low volatilty environment. An ADX between 25 and 50 signals a Strong trend. Every value below 25 is an absent or weak trend. So entering a trade when the volatilty is still low but increasing, you'll be entering a trade at the start of a new uptrend. This mechanism also filters out lots of false signals of the simple cross overs.
The sell signals are fired every time the 50 SMA drops below the 200 SMA.

Trend Reversal Probability CalculatorThe "Trend Reversal Probability Calculator" is a TradingView indicator that calculates the probability of a trend reversal based on the crossover of multiple moving averages and the rate of change (ROC) of their slopes. This indicator is designed to help traders identify potential trend reversals by providing signals when the short-term moving averages start to slope in the opposite direction of the long-term moving average.
To use the indicator, simply add it to your TradingView chart and adjust the input parameters according to your preferences. The input parameters include the length of the moving averages, the ROC length (trend sensitivity), and the reversal sensitivity (signal percentage).
The indicator calculates the ROC of the moving averages and determines if the short-term moving averages are sloping in the opposite direction of the long-term moving average. The number of short-term moving averages that meet this condition is then counted, and the probability of a trend reversal is calculated based on the percentage of short-term moving averages that meet this condition.
When the probability of a trend reversal is high, a bullish or bearish signal is generated, depending on the direction of the reversal. The bullish signal is generated when the short-term moving averages start to slope upward, and the bearish signal is generated when the short-term moving averages start to slope downward.
Traders can use the "Trend Reversal Probability Calculator" to identify potential trend reversals and adjust their trading strategies accordingly. It is important to note that this indicator is not a guarantee of a trend reversal and should be used in conjunction with other technical analysis tools to make informed trading decisions.

FRAMA & CPMA Strategy [CSM]The script is an advanced technical analysis tool specifically designed for trading in financial markets, with a particular focus on the BankNifty market. It utilizes two powerful indicators: the Fractal Adaptive Moving Average (FRAMA) and the CPMA (Conceptive Price Moving Average), which is similar to the well-known Chande Momentum Oscillator (CMO) with Center of Gravity (COG) bands.
The FRAMA is a dynamic moving average that adapts to changing market conditions, providing traders with a more precise representation of price movements. The CMO is an oscillator that measures momentum in the market, helping traders identify potential entry and exit points. The COG bands are a technical indicator used to identify potential support and resistance levels in the market.
Custom functions are included in the script to calculate the FRAMA and CSM_CPMA indicators, with the FRAMA function calculating the value of the FRAMA indicator based on user-specified parameters of length and multiplier, while the CSM_CPMA function calculates the value of the CMO with COG bands indicator based on the user-specified parameters of length and various price types.
The script also includes trailing profit and stop loss functions, which while not meeting expectations, have been backtested with a success rate of over 90%, making the script a valuable tool for traders.
Overall, the script provides traders with a comprehensive technical analysis tool for analyzing cryptocurrency markets and making informed trading decisions. Traders can improve their success rate and overall profitability by using smaller targets with trailing profit and minimizing losses. Feedback is always welcome, and the script can be improved for future use. Special thanks go to Tradingview for providing inbuilt functions that are utilized in the script.

Conceptive Price Moving Average [CSM]The Conceptive Price Moving Average (CPMA) is a technical indicator designed to provide a more accurate moving average of the price by using the average of various price types, such as open, close, high, low, etc. The CPMA can help to smooth out the noise and provide a clearer picture of the overall trend by taking the average of the last 3 candles for each price type and then calculating the average of those averages.
To use the CPMA for generating buy/sell signals, you can look for crossovers of the CPMA and other commonly used moving averages, such as the 9-period EMA, 20-period EMA, 50-period EMA, 100-period EMA, and 200-period EMA, which are also plotted on the chart. When the CPMA crosses above a shorter-term moving average, such as the 9-period EMA or 20-period EMA, it can indicate a potential buy opportunity, while when the CPMA crosses below a shorter-term moving average, it can indicate a potential sell opportunity.
Based on my analysis of BankNifty and Nifty, I have found that the CPMA works best at a length of 21, showing good resistance and support for stocks. Therefore, I recommend using a length of 21 when using the CPMA for generating buy/sell signals.

FRAMA and Candlestick Patterns [CSM]FRAMA (Fractal Adaptive Moving Average) is a technical analysis indicator that adapts its smoothing period according to the market's volatility, allowing it to provide accurate signals in all market conditions. This indicator script plots the FRAMA on a chart and generates buy and sell signals based on the FRAMA and candlestick patterns. It also includes an option to filter signals based on bullish and bearish engulfing patterns.
To detect candlestick patterns, the script imports the "BankNifty_CSM" library from the creator's public library on TradingView. The FRAMA calculation is done using a loop that iterates over the last "length" number of bars, with the smoothing factor adjusted based on the "fracDim" parameter.
The buy and sell signals are generated based on the position of the current price relative to the FRAMA line. If the "engulfing" parameter is set to true, the signals are further filtered based on bullish and bearish engulfing patterns.
Overall, this script combines various technical indicators and candlestick pattern recognition to provide a complete trading strategy. However, as with any trading strategy, it should be thoroughly backtested and evaluated before using it in a live trading environment.

Moving Averages SuiteThe Moving Averages Suite is a powerful technical analysis tool that provides traders with unparalleled control over five different moving averages and two special moving average indexes. This suite is designed to provide traders with a comprehensive understanding of market trends and help them make more informed trading decisions.
By default, the Moving Averages Suite displays two special moving average indexes that are made from the moving averages within the suite. These special moving average indexes are specially weighted indexes that are designed to provide a more accurate representation of market trends. The first index is the Moving Average Directional Index (MADI), which measures the strength of the trend in the market. The second index is the Moving Average Oscillator Index (MAOI), which measures the momentum of the trend in the market.
In addition to these special indexes, traders can enable five different moving averages within the suite. These moving averages include the TEMA, HMA, EMA, VWMA, and SMA. Each moving average has a specific purpose and is used to provide traders with a unique perspective on market trends.
The Triple Exponential Moving Average (TEMA) is designed to reduce the lag time associated with traditional moving averages. This moving average places more weight on recent price data, providing traders with a more accurate representation of current market trends.
The Hull Moving Average (HMA) is another moving average that is designed to reduce lag time. This moving average uses weighted averages to provide traders with a more accurate representation of market trends.
The Exponential Moving Average (EMA) is a popular moving average that is used to identify trends in the market. This moving average places more weight on recent price data, providing traders with a more accurate representation of current market trends.
The Volume Weighted Moving Average (VWMA) is another moving average that is used to identify trends in the market. This moving average places more weight on periods of high volume, providing traders with a more accurate representation of market trends during high volume periods.
The Simple Moving Average (SMA) is a widely used moving average that provides traders with a simple and easy-to-understand representation of market trends.
The Moving Averages Suite is a powerful technical analysis tool that provides traders with unparalleled control over five different moving averages and two special moving average indexes. Each moving average within the suite is designed to provide traders with a unique perspective on market trends, allowing them to make more informed trading decisions. Traders who are looking to gain a comprehensive understanding of market trends should consider using the Moving Averages Suite in their trading strategies.

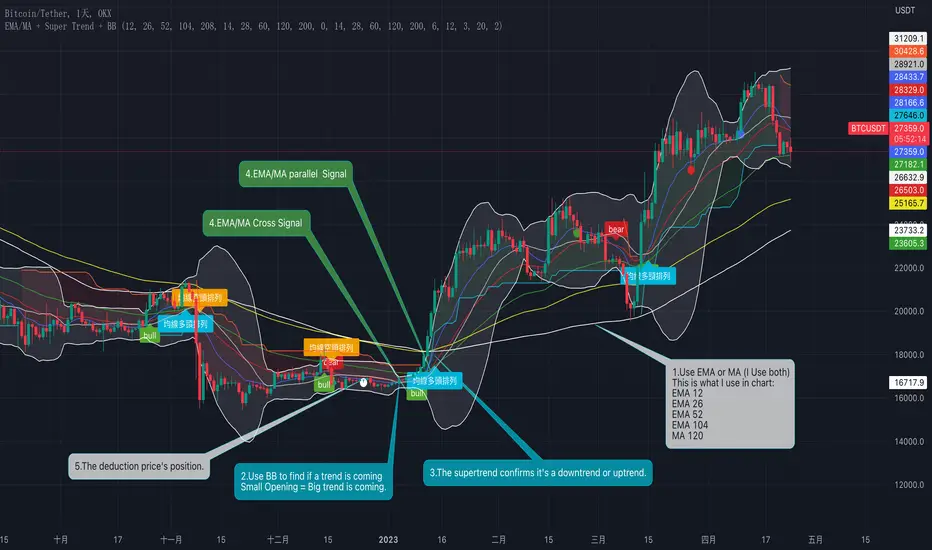
EMA/MA + Super Trend + BBHere is what this indicator does :
1. EMA+SMA moving average system
1. EMA moving average (five in total)
2. SMA moving average (five in total)
3. deduction price
4. EMA/SMA cross prompt: EMA 12//26 cross, or MA14/MA28 cross
5. EMA/SMA parallel prompt: prompt when EMA 12/26/52 is in parallel, or prompt when MA14/MA28/MA 60 is in parallel
Why use EMA 12/26 cross prompt, and MA14/MA28 cross prompt?
Because I backtested BTC based on the winning rate of EMA and MA crossover, its winning rate is higher.
Why use parallel prompt?
Because after the moving averages cross, they will start to be in parallel mode. If you don't see the moving averages be in parallel, it will be a warning sign.
2. Super Trend:
Super Trend is used to assist in judging the current trend.
3. BB Bollinger Bands:
Use the size of the opening to judge whether the major trend is coming.
How to use this indicator? (see chart)
1. Choose EMA or MA, or mix them at the same time
2. Use the Bollinger Bands to find the potential big trend is coming
3. Confirm the trend with Supertrend
4. Use moving averages to confirm crossover and long or short moving average parallel signals
5. The deduction price is used to judge whether the moving average continues to go up or down
Why to do this, why mix them?
1. When the opening of the Bollinger band is very small, it means that the trend is coming
2. Supertrend can help us confirm whether it is an upward or downward trend
3. The crossing and parallel of moving averages can be used as entry trading signals
4. The deduction price is used to judge whether the moving average continues to go up or down
This's why there is a mix of Moving average, Supertrend and BB.
這是這個指標的功能(instructions in Chinese):
一、EMA+SMA 均線系統
1、EMA 均線(共五條)
2、SMA 均線(共五條)
3、抵扣價:可以五條均線的折扣價位置
4、EMA/SMA 交叉提示:EMA 12/EMA 26交叉 或 MA14/MA28 交叉
5、EMA/SMA 排列提示:EMA 12/26/52 呈排列時提示,或 MA14/MA28/MA 60 排列時提示
交叉定義:
二、Super Trend 超級趨勢:
Super Trend 用來輔助判斷當前趨勢。
三、BB 布林帶:
藉由開口大小判斷大趨勢是否即將來臨。
如何使用這個指標?(見圖表說明)
1、選擇EMA或MA均線,或同時混合使用它們
2、用布林帶尋找潛在大趨勢即將來臨
3、用Supertrend 確認趨勢
4、用均線確認交叉與多頭或空頭均線排列訊號
5、抵扣價用來判斷均線是否持續向上或向下
為什麼要這麼做?
1、當布林帶的開口很小時,說明趨勢即將來臨
2、Supertrend 可以幫助我們確認是向上還是向下趨勢
3、均線的交叉與排列可以作為進場交易訊號
4、抵扣價則用來判斷均線是否持續向上或向下
這就是為什麼要混合使用這幾個指標的原因。
Crypto Uptrend Script + Pullback//Volume CandlesDescription: his is an adaption of my Pullback candle - This works on all timeframes and Markets (Forex//Stocks//)
Crypto Uptrend Script with Pullback Candle allows traders to get into a trend when the price is at end of a pullback and entering a balance phase in the market (works on all markets). The use of Moving averages to help identify a Trends and the use of Key levels to help traders be aware of where strong areas are in the market.
This script can work really well in Crypto Bull Runs when used on HTF and with confluences
The script has key support and resistance zones which are made up of quarterly data. Price reacts to these areas but patience is required as price will take time to come into these areas
I have updated the Pullback Candle with the use of Volume to filter out the weak Pullback Candles -
There are new candles to the script.
The First candle is the Bullish Volume Candle - This candle is set to a multiplier of 2x with a crossover of 50/100 on Volume - this then will paint a purple candle.
Uses of the Bullish Volume Candle:
Breakthrough of key areas // special chart patterns
Rejection of key areas
End of a impulse wave (Profit Takers)
The second candle is a Hammer - I prefer using the Hammers on Higher Timeframes however they do work on all timeframes. .
The third candle is a Exhaustion of impulse downward move.
Uses of this candle - can denote a new trend but has to be with confluence to a demand area // support area or with any use of technical analysis - using this alone is not advised
The fourth candle is a indecision candle in the shape of a Doji - this candle can help identify if the trend is in a continuation or a reversal
This script can work really well in Crypto Bull Runs
Disclaimer: There will be Pullbacks with High Volume (Breakouts) and not go the way as intended but this script is to allow traders to get into trends at good price levels. The script can paint signals in areas where price is too expensive so please do your own due diligence on the markets as this script is to help get into good areas of price
Please leave a thumbs up if you like this script and message me for information on how to use the script.

Seer's HutThis is a strategy based on Exponential Moving Averages or Volume Weighted Moving Averages against Adaptive fib resistance / support level and profit percentage which can be definetly defined by user and targeting small profits(profits will be raised by leverages).
In this strategy, there are predefined values which are collected one by one with statistical background and backtests. This gives an advantage to see which ratios are working better for each symbol. Also this statistics are re-evaluated monthly and if there is a need they are going to be changed with the help of libraries. Also IT IS RECOMMENDED TO USE IN DAILY INTERVAL GRAPHICS!!!!
When we deep dive to strategy, it is based on profit percentages. it is similar to the MOST system. MOST only changes the way with default value of %2. But this hardcoded strategy is not working well with each Symbol.
So this is the point where DC and ADR Statistics are involved.
For Ex. while BTC is suits well with %2, it does not do wonders for RSR or RUNE which is 4-5% for each.
There is 3 options for setting the statistical usage of this indicator.
1. Auto calculated based on 1000 days of ADR and DC
imgur.com
2. Using Library where statistical values are stored.
imgur.com
3. User-defined values used. Yeah you read it right. Fully on-demand changes are supported. Which gives freedom to users for setup their own Adaptive FIB and Profit Percentages.
imgur.com
Based on this 3 options, TP and SL points are calculated on bar closures. Strategy Orders are also shown / raised with the closures.
Ok, system calculates these values but how to read / use them. what is this strategy based on ?
This strategy is mostly looking for minimizing the LOSS in case of any stop. So because of this, in each TP, system gives order signal to close half of the remaining open position.
There are 7 type of orders
OL : Open Long (Close Short and Open Long if in position)
CL 50 : Close Long - %50 of Open Position
CL 100 : Close Long - Close all position
OS : Open Short (Close Long and Open Short if in position)
CL 50 : Close Short - %50 of Open Position
CL 100 : Close Short - Close all position
TP5 : Highest TP reached. Close all position.
Script checks cross of EMA / VWMA and adFib to decide open a position. In reversal / crosses, adFib line had been set to defined Fib. Percentage (FP) level.
For creating the TP points, Profit Percentage (PP) parameter had been used which I briefly introduce at the beginning with the options.
One important topic about this strategy, it is not stacking / pyramiding the positions. Which means, it always calculate one way position. For example we are in the long position after OL signal.
We reached TP values and take profits. Later on due to FP crossing EMA, OS order signal given. This means you have to close all long position and open short position.
But beware. These calculated points are based on given values or calculated regarding to average ADR / DC ratings. For supporting strategy, several methods also had been included in the options.
imgur.com
These are:
1. MA plotting (Optional 4 EMA, 1WMA) - checking for Golden and Death Cross
2. Bollinger Bands (Length 25 and Multiplier 2.5 set as default. Used in correlation with TEMA)
3. Kama 2 / Kama 5 - Crossing speaks of Trend way
4. TEMA (TEMA 50, VWMA 25 calculations and plotting. Used for TEMA 50 / VWMA 25 / SMA 25 cross checks for weakening or strengthening trend analysis)
5. ATR plotting
6. Chandelier Exit plotting (Widely used for calculating Stop levels in market)
7. PSAR (Widely used for indicating trend reversal)
Also for the ease of use, if the users does not want to plot any values on the graph and just want to see the values there is couple of tables also included.
1. EMA info
2. KAMA info
3. Order info
4. TP/SL info
imgur.com
Some important notes:
1. To minimize the stop just after the order opening candle in volatile grounds, system prevents to raise new order signals if there is a signal already raised in last 4 candle.
2. if system reach and give close order in one of the TP points (For Ex TP1.), then index goes down and goes up again same TP (above TP1 in scenario) after 4 candle, system gives a close order signal again in the same TP.
3. There is a Profit Factor value had been shown at Order Info table. This information shows how profitable is the setup regarding to given FP and PP values.
In general market conditions, A Profit Factor above 1.50 is considered good enough and above 2.0 it is considered ideal. A strategy with profit factor less than 1.20 suggests too bigger a risk taken for making money.
In some cases automatic ADR and DC calculations are not good enough. so if you want to find a good Profit Factor value, you can change the system automatic calculation to manual value entering and you can see the results directly with in this field.
