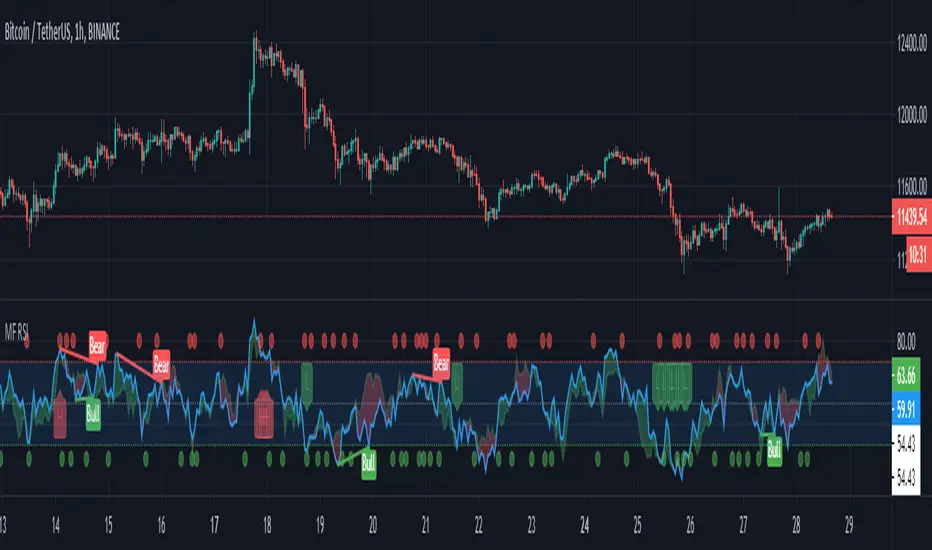
ALTS-Trend
ALTS-Trend
Altcoins-Trend is a technique that shows how much Altcoins is dominating the Marketcap and it's effect over the whole Crypto Market ,and that will show you alts season in each time frame because trend is relative .
*** Features
* Color grading to show you the Increase of domination effect (Green).
* Color grading to show you the Decrease of domination effect (Red) .
* Better understanding to the market ,and that will help you with a very good timed trades at the best trading times for altcoins .
/////////////////////////////////////////////
*Note
Special thanks for Lazybear for his momentum algorithm .
Índice de Fluxo de Dinheiro (MFI)
MFI - Money Flow Index [UTS]Money Flow Index (MFI) is the technical indicator, which indicates the rate at which money is invested into a security and then withdrawn from it.
Construction and interpretation of the indicator is similar to Relative Strength Index with the only difference that volume is important to MFI.
Usage:
When analyzing the money flow index one needs to take into consideration the following points:
divergences between the indicator and price movement. If prices grow while MFI falls (or vice versa), there is a great probability of a price turn;
Money Flow Index value, which is over 80 or under 20, signals correspondingly of a potential peak or bottom of the market.
Common known variants of this type of indicator are the On Balance Volume, Chaikin Oscillator or Chaikin Money Flow.
Based on www.metatrader5.com
FearsAndHopesA strategy based on the assumption that if you buy in a panic and sell on the euphoria of the crowd, then in the long run you get a profit. The strategy is symmetrical, that is, we assume that FOMO and FUD have an equal impact on the crowd. Never make different paired parameters. Do not try to get a perfect result on the backtest. The setup is symmetrical, the program does not use EMA, requests to larger timeframes, and other things that can cause repaintings. However, if you use the value 1 in the Fast Sma Length field, repaintings is possible, use with caution. This algorithm makes me profit 2600% profit per year, which, of course, does not mean that the next year will bring the same. API history on Bitmex on request in PM. Use it as an indicator with pleasure. Access to the script and help in setting up costs 0.5 btc
High-Low- Signal (Expo)High-Low-Signal (Expo)
DESCRIPTION
This simple but powerful High-Low indicator plots price extremes. Either it’s an exhausting sign or a continuation sign of the trend. The color of the cloud determines the trend, and the height of the peaks determines the strength in the price moves. You can easily compare current peaks with historical ones to understand the current dynamics and what might happen next.
This indicator is a must if you want to understand price dynamics in the market. The indicator is perfect to combine with other indicators to confirm the signal.
For example:
Combine it with trend lines/Channels/Bollinger Band, you name it! If the indicator peaks in conjunction with that the price reaches a trend line/Channels/Bollinger Band. It's a great sign!
HOW TO USE
1. Look for a signal
2. Identify the color and height of the peak. Compare it to historical ones to get an understanding of the current market dynamics.
3. Combine the indicator with e.g. trend lines/Channels/Bollinger Band
4. Consider Enter the market.
INDICATOR IN ACTION
BTCUSD
BTCUSD
BTCUSD
Wall Street
EURJPY
EURUSD
GOLD
I hope you find this indicator useful , and please comment or contact me if you like the script or have any questions/suggestions for future improvements. Thanks!
I will continue to work on this indicator, so please share your experience and feedback with me so that I can continuously improve it. Thanks to everyone that have contacted me regarding my scripts. Your feedback is valuable for future developments!
ACCESS THE INDICATOR
• Contact me on TradingView or use the links below
-----------------
Disclaimer
Copyright by Zeiierman.
The information contained in my scripts/indicators/ideas does not constitute financial advice or a solicitation to buy or sell any securities of any type. I will not accept liability for any loss or damage, including without limitation any loss of profit, which may arise directly or indirectly from use of or reliance on such information.
All investments involve risk, and the past performance of a security, industry, sector, market, financial product, trading strategy, or individual’s trading does not guarantee future results or returns. Investors are fully responsible for any investment decisions they make. Such decisions should be based solely on an evaluation of their financial circumstances, investment objectives, risk tolerance, and liquidity needs.
My scripts/indicators/ideas are only for educational purposes!
yutas_Money_Flow_Index_TrendVer1.0
Visually understand the initial movement of MFI trends.
The background color changes when the value is greater or less than the specified value.
This should be seen together with ADX etc.
MFIのトレンド発生の初動を視覚的に分かりやすくしました。
指定数値以上・以下で背景の色が変わります。
これはADX等と合わせて見る必要があります。
Hashem Helper -TwoHashem Helper Two
This Indicator contains many indicators and mixture of them.
RSI+MFI = Green and Red Cloud (Above 0 is Green, Below 0 is Red)
StochRSI (K = Aqua, D = Purple)
WaveTrend (Not shown directly but used in the bigger Aqua and Purple Cloud Waves)
VWAP (Volume-Weighted Average Price) = Yellow Cloud Around 0 Line.
The Blue WaveCloud ( which is a Fast Momentum ) and the Purple WaveCloud ( which is Slow Momentum ) is the result of the mixture.
Basically when Fast Wave crosses the Slow Wave, It's a setup and the price momentum is probably going to follow the wave as a "Probable Signal". (when cross happen, a Red or Green Circle is plotted on the 60 or -60 Line)
The idea here is that you are looking for a big momentum wave( Purple Cloud ), followed by a smaller trigger wave ( Blue Cloud ).
In addition the Divergences on StochRSI and RSI and WaveCloud are analyzed. This indicator shows Normal Divergences (R) and Hidden Divergences (H) on itself. But the point is YOU with your TA should must that. So it's NOT an "Absolute Signal". Human eye is needed to interpret the false and true signals.
Divergences on StochRSI and WaveClouds are shown with actual Green/Red Lines (R/H) and on RSI are shown with Shapes on the its line.
Bullish Divergence = Aqua Triangle
Hidden Bullish Divergence = Aqua Circle
Bearish Divergence = Purple Triangle
Hidden Bearish Divergence = Purple Circle
When you see these shapes on the RSI , it tells you: Hey, Watch the RSI and Price, A Divergence could be there but it's not confirmed. you need to confirm it with your own TA.
Note that this is a Helper Indicator, NOT a Short/Long Signal Indicator. This should be used alongside with your TA.
Open Interest Stochastic Money Flow IndexThis is the improved version of Stochastic Money Flow Index script that uses Open Interest instead of volume in Future markets.
I think it will make a difference especially in Future and CFD markets.
Since the system will pull data from Quandl, CFTC reports may cause repaint when disclosed.
So if you use it during the weekly time frame (1W), it will definitely not repaint.
You can also use the volume by selecting "Others" from the menu.This option applies to each instrument, you can use it on any financial instrument with or without COT data.
Bitcoin is included in the "Futures" option.
In Futures, you can observe the difference of Open Interest's success by comparing, since it counts exchanges between the two parties singularly, it reacts more firmly to speculative movements.
This script also includes alerts and bar color options, you can use from the menu.
It is also suitable for mutable variables.This script was freed from the integer loads.You can modify it in any adaptive or fractional period.
I hope it will help your analyzes, regards .
14-RSI minus 36-MFI (weekly)On the weekly chart of BTC/USD, the difference between the 14-RSI and the 36-MFI, combined with the 14-RSI alone, gives good buy and sell signals.
JK-HSIC1(TQ)-1D-CandleThis script uniquely and creatively get daily data on HSI futures from third party sources, so that it display the regular hours trading of HSI data and ignore after hours trading ( AHT ) data, which HSIC1! currently does not allow excluding AHT data.
This script shows candle.
MFI/RSIThis is a simple study that combines MFI and RSI and provides buy/sell alerts.
The red lines are MFI.
the blue lines are RSI.
Boundries are colored as the indicators and are user configurable.
Black triabgles are buy/sell points when both MFI and RSI are overbought/sold.
Function : Stochastic Money Flow IndexThis function is similar to the stochastic rsi function.
The only difference is that Money Flow Index is used instead of rsi.
Oversold and overbought values were changed to 80 and 20.
Because the MFI's overbought and overbought zones are 20 and 80.
In MFI, I think that it can be more beneficial in liquid markets than stochastic rsi since volume is taken into account in contrast to RSI.
Regards.
|-ML-| Banana Split | RSI & MFI Divergence OscillatorsMFI and RSI moving average divergence oscillators.
Bullish:
More Yellow underneath curling up.
Higher Low on blue oscillator.
'MFI Trend' (red and green line) red at the top.
Bearish:
More orange at the top curling down.
Lower high on blue oscillator.
'MFI Trend' green at the bottom.
This is a great compliment to the C4 indicator.
()
SpiralSwinger V2 by SpiralmanPre-release of Spiral Swinger V2 - a trading system based on godmode oscillator.
Please don't send requests yet, as it's in testing phase now, not for public use!
Free two week trial + user manual will be available after next update release.
REAL STRATEGY : Dow_Factor_MFI/RSI_DVOG_StrategyI'm actually one of those who think it's more important to extract clues from indicators than strategy, but I wanted to test the data about the probability and dow factor I've shared for a long time.
Usually, Bitcoin is used as an eye stain for strategy success, since the graph has increased significantly from the beginning.
To prevent this, I used a commission and in the last lines of document I shared Bitmex's Bitcoin and Ethereum 1W test results.
I don't think there's a factor to repaint. ( Warn me if u see or observe )
I considered Bitcoin because I found working with liquid parities much more realistic.
Ethereum and Bitmex have been featured as a spot and may soon find a place at the CME , so I've evaluated the Ethereum .
But since the Ethereum Bitmex was also spot new, I deleted results that were less than 10 closed trades.
Since the Dow Theory also looks at the harmony in the indices, just try it in the Cryptocurrency market.
Use as indicator in other markets. Support with channels, trend lines with big periods and other supportive indicators.
And my personal suggestion : Use this script and indicator TF : 4H and above.
Specifications :
Commission. ( % 0.125 )
Switchable Methods ( Relative Strength Index / Money Flow Index )
Alarms. (Buy / Sell )
Position closure when horizontal market rates weighs.
Progressive gradual buy/sell alarms.
Clean code layout that will not cause repaint. (Caution : source = close )
Switchable barcolor option (I / 0 )
*****Test results :*****
drive.google.com
Summary:
It was a realistic test.
It has achieved great success in some markets, but as I mentioned earlier, use it only to gain insight into the price movements of cryptos.
Use as indicator in other markets.
This code is open source under the MIT license. If you have any improvements or corrections to suggest, please send me a pull request via the github repository : github.com
Stay tuned ! Noldo.
IFish money FlowThe Money Flow Index and RSI are very closely related. The main difference is that Money flow incorporates volume , while the RSI does not.
Proponents of volume analysis believe it Volume is a leading indicator.
Therefore, they also believe that Money flow will provide signals, and warn of possible reversals,
in a more timely fashion than the RSI . One indicator is not better than the other,
they are simply incorporating different elements and will, therefore, provide signals at different times.
How Money Flow Calculated
Calculate the Typical Price for each of the last 14 periods.
For each period, mark whether the typical price was higher or lower than the prior period. This will tell you whether Raw Money Flow is positive or negative.
1-Calculate Raw Money Flow by multiplying the Typical Price by Volume for that period. Use negative or positive numbers depending on whether the period was up or down (see step above).
2-Calculate the Money Flow Ratio by adding up all the positive money flows over the last 14 periods and dividing it by the negative money flows for the last 14 periods.
3-Calculate the Money Flow Index ( MFI ) using the ratio found in step four.
4-Continue doing the calculations as each new period ends, using only the last 14 periods of data.
This Indicator compressed by inverse Fisher Transform Calculation to find out Market turn out Points.
Overbought and oversold doesn't necessarily mean the price will reverse, only that the price (factoring for volume ) is near the high or low of its recent price range.
Basically look for a color flip of indicator (green/red) at overbought oversold region by threshold violation.
For trading concept dm.
Gaussian MFI BFThe signals are based on the Gaussian Channel calculated by Donovan Wall. Thanks also to Kiasaki for Rate of Change code.
Simply going long and short based on Gaussian channel was not consistent enough so I also included an MFI filter. We only go long if Money Flow Index is greater than the last candle (more money is flowing in than out). The opposite for short. Also employed Rate of Change function (white background) to avoid sideways market.
A 2% stop loss seems to be the most balanced for this strategy but can can altered in the settngs.
Also included a take-profit function but it seems this is best not implemented for this strategy, at least in the case of XBT/USD.
A derivative of The MFI is also plotted on the chart simply to compare the current candle with the last candle visually.
Background color:
Green = Long
Red = Short
White = No Trade
Open Interest Money Flow Index (OIMFI)CAUTION : This system was inspired from seiglerj' s "Money Flow Index " script. Open Interests are used instead of volume.
What is the Money Flow Index ( MFI )?
The Money Flow Index ( MFI ) is a technical oscillator that uses price and volume for identifying overbought or oversold conditions in an asset. It can also be used to spot divergences which warn of a trend change in price. The oscillator moves between 0 and 100.
Unlike conventional oscillators such as the Relative Strength Index ( RSI ), the Money Flow Index incorporates both price and volume data, as opposed to just price. For this reason, some analysts call MFI the volume-weighted RSI .
What Does the Money Flow Index ( MFI ) Tell You?
One of the primary ways to use the Money Flow Index is when there is a divergence. A divergence is when the oscillator is moving in the opposite direction of price. This is a signal of a potential reversal in the prevailing price trend.
For example, a very high Money Flow Index that begins to fall below a reading of 80 while the underlying security continues to climb is a price reversal signal to the downside. Conversely, a very low MFI reading that climbs above a reading of 20 while the underlying security continues to sell off is a price reversal signal to the upside.
Traders also watch for larger divergences using multiple waves in the price and MFI . For example, a stock peaks at $10, pulls back to $8, and then rallies to $12. The price has made two successive highs, at $10 and $12. If MFI makes a lower higher when the price reaches $12, the indicator is not confirming the new high. This could foreshadow a decline in price.
The overbought and oversold levels are also used to signal possible trading opportunities. Moves below 10 and above 90 are rare. Traders watch for the MFI to move back above 10 to signal a long trade, and to drop below 90 to signal a short trade.
Other moves out of overbought or oversold territory can also be useful. For example, when an asset is in an uptrend, a drop below 20 (or even 30) and then a rally back above it could indicate a pullback is over and the price uptrend is resuming. The same goes for a downtrend. A short-term rally could push the MFI up to 70 or 80, but when it drops back below that could be the time to enter a short trade in preparation for another drop .
Reference : www.investopedia.com
WARNING :
** Since each instrument in the list has its own unique contract data, you must first enter its name to display it. I recommend you to select OANDA from the markets. Finally, when the COT reports are issued, it may repaints. However, this repaint is usually close to closing or after close .(When COT reports are so sharp ) So use this script only 1W ( 1 week ) or 1 M ( 1 month ) timeframe.
** This data is taken to Tradingview with the help of Quandl. This is a very low possibility, but the system will not work if there is a malfunction.
FEATURES :
*** Working with all futures (Including : Bitcoin )
*** If you dont work with "Futures" , you can select "Others" from switchable menu and use volume for all instruments.
*** New generation elegant design used : Adaptive coloring Overbought - Oversold Levels according to the closing price.
NOTE : This code is open source under the MIT License. If you have any improvements or corrections to suggest, please send me a pull request via the github repository github.com
Stay tuned. Best wishes !
MFI flatИз 5 периодов вычислено среднее значение. Использовать вместе с индикатором ADR_B+CCI на интервалах 115,230,450 минут и 12 часах. Важно пересечение с касательной и положение относительно нулевой линии. Позволяет более точно получить точку входа и выхода.
MFI MTF Pane [Anan]Hello friends,
This is MFI MTF Pane :
Green : MFI >= 50
RED : MFI < 50
Green Dot : MFI Oversold MFI >= 80
Red Dot : MFI Overbought <=20
Dependent Variable Odd Generator For Machine Learning TechniquesCAUTION : Not suitable for strategy, open to development.
If can we separate the stagnant market from other markets, can we be so much more accurate?
This project was written to research it. It is just the tiny part of the begining.
And this is a very necessary but very small side function in the main function. Lets start :
Hi users, I had this idea in my mind for a long time but I had a hard time finding the parameters that would make the market stagnant. This idea is my first original command system. Although it is very difficult to make sense of the stagnant market, I think that this command system can achieve realistic proportions. With 's money flow index, I opened the track to determine the level. On the other hand, the prices were also using a money flow index, and it forced me to make the limitations between the levels in a logical way. But the good thing is that since the bollinger bandwidth uses a larger period, we are able to print normal values at extreme buy and sell values.
In terms of price, we can define excessive purchase and sale values as the period is smaller. I have repeatedly looked at the limit values that determine the bull, bear, and bollinger bandwidth (mfi), and I think this is the right one. Then I have included these values in the probability set.
The bull and bear market did not form the intersection of the cluster, and because there are connected events, the stagnant market, which is the intersection, will be added to the other markets with the same venn diagram logic and the sum of the probability set will be 1. is equal to. I hope that we can renew the number generators in the very important parameters of machine learning such as Markov Process with generators dependent on dependent variables, which bring us closer to reality. This function is open to development and can be made of various ideas on machine learning. Best wishes.
This code is open source under the MIT license. If you have any improvements or corrections to suggest, please send me a pull request via the github repository github.com
Function : Bollinger Bands and BBW Squeeze DetectorThis script shows Bollinger Bands function and want to detect Bollinger Band Width Squeeze with a successful, different perspective .
Bollinger Bands : You can specify the Bollinger Bands periods as mutable variables .
Bollinger Band Width Squeeze : First the Bollinger bands width was calculated.The width was then divided into levels using the money flow index.
Thus, the bollinger takes into account the available volume averages when calculating the band width mfi (Money Flow Index).
After this modelling, we can limit and color the lower limit and upper limits just as Relative Strength Index.
We can even put warnings on oversold areas if desired. Let's not forget that we are working with width rather than price.
By design, squeeze areas are defined directly above the Bollinger Bands with coloration. I think it is very practical and looks stylish.
I tried and found it quite successful and wanted to share it with users.
I came up with many ideas when I wrote this system, and I will share them very soon . I hope it will be useful to users and give new ideas.
Best regards.
Money Flow Index Extreme Condition + MACDCombine the signal of extreme condition of Money Flow Index and MACD