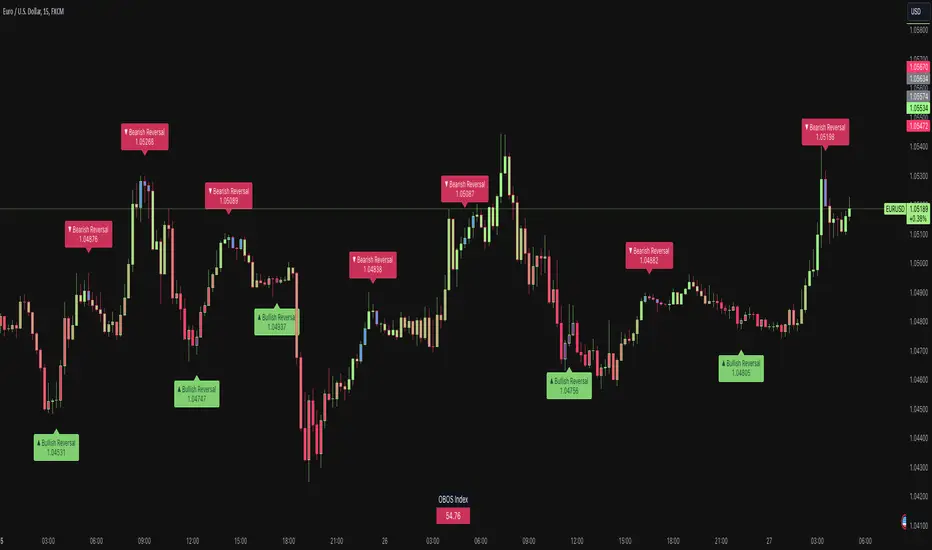
Price & Momentum Reversal Indicator [TradeDots]Price & Momentum Divergence Indicator is a variant of the Chande Momentum Oscillator (CMO), designed to identify reversal patterns in overvalued and undervalued markets. This indicator aims to mitigate the common problem of all oscillating indicators: false buy/sell signals during prolonged market trends, by incorporating a volume-weighted approach and momentum analysis.
📝 HOW IT WORKS
Price Extremeness Calculation
The indicator evaluates the extremeness of the current price by analyzing price changes over a fixed window of candlesticks.
It separates the price changes into positive and negative changes, then multiplies them by the bar volume to obtain volume-weighted values, giving higher significance to bars with larger volumes.
Extremeness Ratio
The ratio is calculated by taking the difference between the total positive changes and total negative changes, and then dividing this result by the sum of the total positive and negative changes.
The result is then smoothed to reduce market noise and rescaled to a range between -100 to 100, where 100 indicates all price changes within the window are positive.
Momentum Analysis
Momentum is calculated by measuring the rate of change of the smoothed extremeness ratio, indicating whether market extremeness is slowing and showing signs of reversion.
Reversal Signal Confirmation
For an asset to be considered a reversal, it has to be in the overvalued or undervalued zone (exceeding the overvalued & undervalued threshold). It must then show a slowed momentum change and a price reversion.
Lastly, candlestick analysis is used to confirm the reversal signal, ensuring there is no room for further breakout price movement.
🛠️ HOW TO USE
Candlestick Visualization
Candlestick bodies are painted with gradient colors representing the smoothed price extremeness (OBOS Index), ranging from -100 (solid red) to 100 (solid green). The exact value is displayed in a table at the bottom right corner.
Slowing price momentum is indicated with blue (bearish) and purple (bullish) colors, showing market pressure from the opposite side.
Reversal Confirmation
A decrease in price momentum combined with a price reversal triggers a signal label on the candlestick, indicating a potential pullback or reversal. This can serve as a reference for better entry and exit points.
⭐️ Premium Features
Higher Timeframe (HTF) Analysis
The indicator includes a feature to apply the same algorithm to a selected higher timeframe, ensuring trend alignment across multiple timeframes.
Alert Functions
Real-time notifications for overvalued and undervalued conditions, allowing traders to monitor trades and reversal signals anywhere and anytime.
❗️LIMITATIONS
Accuracy decreases in volatile and noisy markets.
Extended bullish or bearish market conditions may affect performance.
See Author's instructions below to get instant access to this indicator.
RISK DISCLAIMER
Trading entails substantial risk, and most day traders incur losses. All content, tools, scripts, articles, and education provided by TradeDots serve purely informational and educational purposes. Past performances are not definitive predictors of future results.
Momentumstrategy
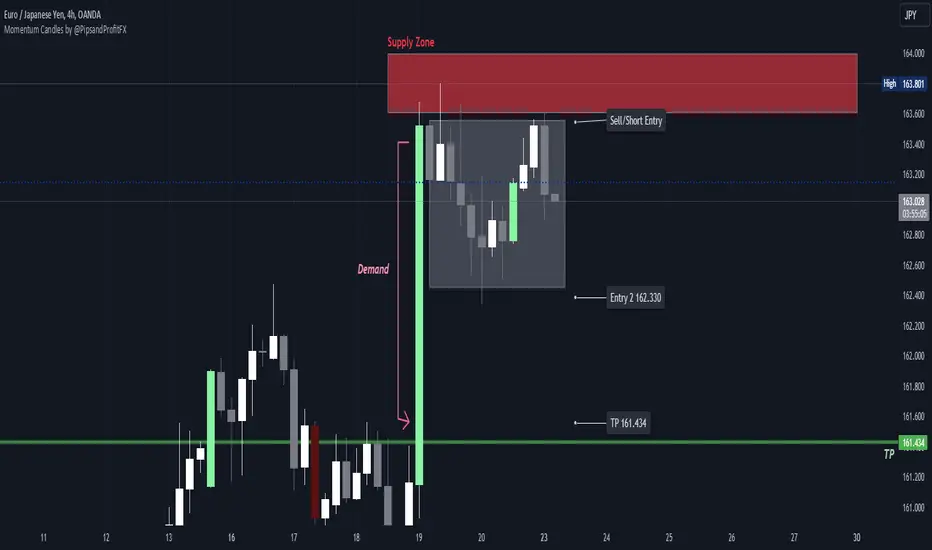
Momentum Candles by @PipsandProfitFXThe High Momentum Candles indicator highlights price bars with exceptional price movement and strong volume. It identifies candles with significantly long bodies relative to their shadows, indicating rapid price changes. Additionally, the indicator filters for candles with above-average volume to confirm the strength of the price movement.
Dark red: bearish momentum
Orange: bullish momentum
(You can easily change the momentum candles to whatever color you want in the indicator settings.)
By visually emphasizing these high momentum candles, traders can potentially identify potential trend reversals or continuations, as well as potential entry and exit points.
Key Features:
Identifies candles with large bodies relative to their shadows
Filters candles based on volume to confirm strength
Highlights high momentum candles with a distinct color
Let me know if you'd like to see any updates on this indicator.
Note: This indicator is a visual tool and should be used in conjunction with other technical analysis techniques for making informed trading decisions.
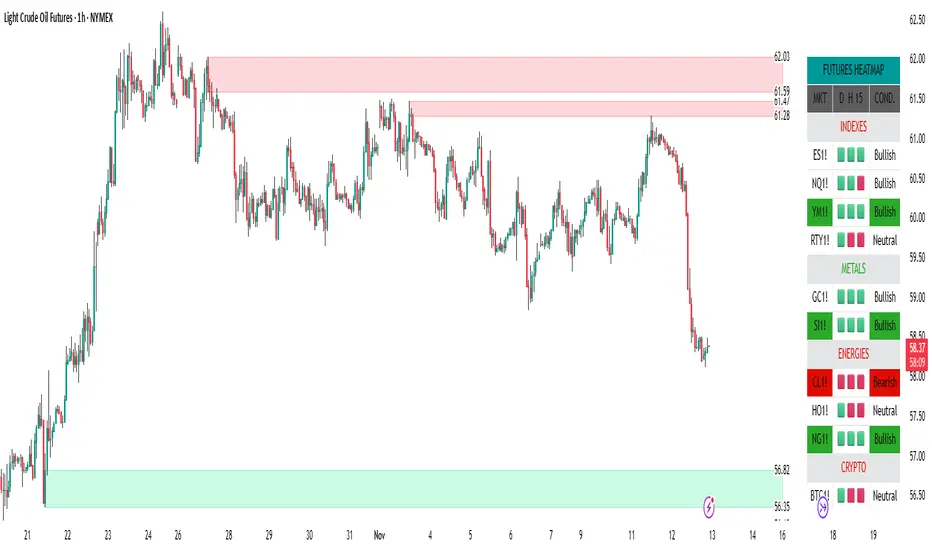
Supply & Demand Trade Analyzer by NYTCSupply and Demand Trade Analyzer
Automatic Zone Identification
• Identifies high quality supply and demand zones on multiple timeframes
• Shows the prices for each zone so the user may easily identify actionable prices to buy or sell
• Once a zone is no longer valid, it is automatically removed from the chart to keep the workspace clean.
• Includes all 4 zone formations: DBR, RBR, RBD and DBD
What are supply and demand zones?
Supply and demand zones are visual representations of areas where there has been a price imbalance. Whenever a demand imbalance is detected, the indicator will plot a green demand zone which may be used as an area to buy under the right market conditions, such as an uptrend or to take profit on a short position. Also, whenever a supply imbalance is detected, the indicator will plot a red supply zone which may be used as an area to sell under the right conditions such as a downtrend or to take profit on a long position.
Automatic Trend Analysis
Proper trend analysis is one of the most important steps in successfully trading or investing in the financial markets as it helps the trader determine which side of the market, he/she wants to take: long or short. For this reason, we decided to also include in this indicator our unique trend analysis technique that utilizes highs and lows to detect when trends begin, how they continue and when they end. The indicator is able properly identify uptrends (Higher Highs and Higher Lows), downtrend (Lower Highs and Lower Lows), and sideways trends (relatively equal highs and lows, higher highs but lower lows or lower highs but higher lows).
• The trader can toggle this feature on or off as needed.
• Our unique trend indicator is located at the bottom of the chart so, as not to interfere with the candles and hide important information.
• When the indicator shows green, the trend is up, when it shows red, the trend is down and sideways when the indicator shows grey.
How it works
Being that supply and demand zones are areas of potential imbalance, under the right conditions price may reverse at these zones. Use them in conjunction with your entry and exit rules to maximize efficacy and minimize risk.
User Inputs
In the settings menu you will find the following functions:
• Zone Count: Allows the trader to determine how many zones are shown on the chart
• Zone-on-Zone: Give the trader the option to also see overlapping zones
• Minor Zones: While the indicator plots major zones by default, this function gives the trader to see all zones in real time as they are being formed.
• HTF Trend: Give the trader the option to turn on our unique trend identification tool
• LTF Momentum: Allows the trader to toggle on or off our unique lower timeframe momentum finder. This tool is best used during the Globex of the Futures session for short-term trading (scalping)
Instruments
Our Trade Analyzer works across all asset classes and on all instruments, including:
Stocks
Futures
Forex
Cryptocurrencies
Summary
The Supply and Demand Trade Analyzer offers traders a quick and easy way of identifying supply and demand or support and resistance areas on a chart. It provides:
• Zone Identification: Proper zone identification on multiple timeframes
• User-Friendly Customization: With a variety of user inputs, you can tailor the analyzer to fit your unique trading strategy.
• Cross-Asset Compatibility: Works seamlessly across all major asset classes and instruments.
• Clean Workspace: Automatic removal of invalid zones keeps your chart organized and focused on the most relevant information.
• Real-Time Insights: Stay ahead of the market with real-time zone plotting and trend analysis, enabling timely and strategic trades.
Bitcoin Momentum StrategyThis is a very simple long-only strategy I've used since December 2022 to manage my Bitcoin position.
I'm sharing it as an open-source script for other traders to learn from the code and adapt it to their liking if they find the system concept interesting.
General Overview
Always do your own research and backtesting - this script is not intended to be traded blindly (no script should be) and I've done limited testing on other markets beyond Ethereum and BTC, it's just a template to tweak and play with and make into one's own.
The results shown in the strategy tester are from Bitcoin's inception so as to get a large sample size of trades, and potential returns have diminished significantly as BTC has grown to become a mega cap asset, but the script includes a date filter for backtesting and it has still performed solidly in recent years (speaking from personal experience using it myself - DYOR with the date filter).
The main advantage of this system in my opinion is in limiting the max drawdown significantly versus buy & hodl. Theoretically much better returns can be made by just holding, but that's also a good way to lose 70%+ of your capital in the inevitable bear markets (also speaking from experience).
In saying all of that, the future is fundamentally unknowable and past results in no way guarantee future performance.
System Concept:
Capture as much Bitcoin upside volatility as possible while side-stepping downside volatility as quickly as possible.
The system uses a simple but clever momentum-style trailing stop technique I learned from one of my trading mentors who uses this approach on momentum/trend-following stock market systems.
Basically, the system "ratchets" up the stop-loss to be much tighter during high bearish volatility to protect open profits from downside moves, but loosens the stop loss during sustained bullish momentum to let the position ride.
It is invested most of the time, unless BTC is trading below its 20-week EMA in which case it stays in cash/USDT to avoid holding through bear markets. It only trades one position (no pyramiding) and does not trade short, but can easily be tweaked to do whatever you like if you know what you're doing in Pine.
Default parameters:
HTF: Weekly Chart
EMA: 20-Period
ATR: 5-period
Bar Lookback: 7
Entry Rule #1:
Bitcoin's current price must be trading above its higher-timeframe EMA (Weekly 20 EMA).
Entry Rule #2:
Bitcoin must not be in 'caution' condition (no large bearish volatility swings recently).
Enter at next bar's open if conditions are met and we are not already involved in a trade.
"Caution" Condition:
Defined as true if BTC's recent 7-bar swing high minus current bar's low is > 1.5x ATR, or Daily close < Daily 20-EMA.
Trailing Stop:
Stop is trailed 1 ATR from recent swing high, or 20% of ATR if in caution condition (ie. 0.2 ATR).
Exit on next bar open upon a close below stop loss.
I typically use a limit order to open & exit trades as close to the open price as possible to reduce slippage, but the strategy script uses market orders.
I've never had any issues getting filled on limit orders close to the market price with BTC on the Daily timeframe, but if the exchange has relatively low slippage I've found market orders work fine too without much impact on the results particularly since BTC has consistently remained above $20k and highly liquid.
Cost of Trading:
The script uses no leverage and a default total round-trip commission of 0.3% which is what I pay on my exchange based on their tier structure, but this can vary widely from exchange to exchange and higher commission fees will have a significantly negative impact on realized gains so make sure to always input the correct theoretical commission cost when backtesting any script.
Static slippage is difficult to estimate in the strategy tester given the wide range of prices & liquidity BTC has experienced over the years and it largely depends on position size, I set it to 150 points per buy or sell as BTC is currently very liquid on the exchange I trade and I use limit orders where possible to enter/exit positions as close as possible to the market's open price as it significantly limits my slippage.
But again, this can vary a lot from exchange to exchange (for better or worse) and if BTC volatility is high at the time of execution this can have a negative impact on slippage and therefore real performance, so make sure to adjust it according to your exchange's tendencies.
Tax considerations should also be made based on short-term trade frequency if crypto profits are treated as a CGT event in your region.
Summary:
A simple, but effective and fairly robust system that achieves the goals I set for it.
From my preliminary testing it appears it may also work on altcoins but it might need a bit of tweaking/loosening with the trailing stop distance as the default parameters are designed to work with Bitcoin which obviously behaves very differently to smaller cap assets.
Good luck out there!

Daily Range AnalysisThis indicator helps quickly identify if a stock is making a "price expansion" or a "price contraction". If today's range is larger than yesterday, then the stock is having a price expansion. This will be represented with a positive number. If today's range is smaller, the stock is making a contraction, and the indicator will display a negative number.
Indicator Features:
1. **Dark and Light Themes**: Users can choose between dark and light themes based on their preference. Dark themes are easier on the eyes in low-light conditions, reducing eye strain, while light themes are more suitable for well-lit environments.
2. **Customizable Text Colors**: Users can customize the text color for each data element displayed in the table. Customization allows users to tailor the appearance of the indicator to their liking and enhance readability.
3. **Show/Hide Data Options**: Users have the flexibility to show or hide each data element in the table individually. This feature enables users to focus on specific information they find most relevant, decluttering the chart and improving readability.
4. **Daily Range Analysis**: The script calculates and displays important metrics related to the daily price range of a financial instrument. These metrics include:
- Closing Range: Percentage indicating how close the closing price is to the daily low relative to the daily range. Helps traders assess where the closing price lies within the day's price action.
- Range Expansion: Percentage indicating the change in the daily price range compared to the previous day. Useful for identifying potential volatility shifts and trend continuation or reversal.
- StopH: Price level representing the midpoint between the day's open and close, commonly used as a reference for setting stop-loss orders.
- StopL: The low of the day, providing information about the lowest price reached during the trading session. Some traders like to use the Low of Day as a Stop Loss.
Overall, this script provides traders with essential insights into daily price movements, enabling them to make more informed trading decisions based on key price action metrics. The customization options enhance user experience and adaptability, catering to individual preferences and trading styles

Weighted Average Volume Depth [QuantraSystems]Weighted Average Volume Depth
Introduction
The Weighted Average Volume Depth (𝓦𝓐𝓥𝓓) indicator is calibrated to provide extensive insights, calculated using volumetric price action and volume depth, and provides dynamic adjustments based upon historical volatility.
This indicator is a valuable asset for traders and investors, aiming to capture trends, measure dynamic volatility, and provide market reversion analysis in a systematic way.
Legend
Volumetric Top Cap: Plotted at y = 0, this line represents the probabilistic maximum value, or ‘cap’ for the signal line. It is colored using a binary color scheme, and indicates the dominant trend direction - green for an uptrend and purple for a downtrend.
Base Line: Calculated using a volume-weighted volatility measurement, this line is used as the benchmark to calculate momentum in the 𝓦𝓐𝓥𝓓 indicator.
Signal Line: The signal line represents the volume and volatility weighted measurements, and oscillates between the Base Line and Top Cap. Its position between these levels provides the depth of insights available in this script.
When the signal line is remaining in close proximity to the base line, this is indicative of a low volatility market environment. These periods are also reflected as muted bar coloring when the ‘Trend Intensity’ setting is enabled.
Conversely, when the signal line approaches, or even breaks above the Top Cap, this is characteristic of an unsustainable trending action - and probabilistically speaking, a reversion or consolation is likely to occur at these levels.
Highlighting: When this setting is enabled, background coloring is applied when the Signal Line breaks above the Top Cap. This highlights green as an oversold zone, and purple as an overbought zone.
Reversal Signals: When price begins to reverse from a zone of overextension, a signal is plotted when this reversion occurs from a high probability zone.
Circle - Shows a possible bullish reversal.
Cross - Shows a possible bearish reversal.
Case Study
In the above image, we showcase three distinct trades in short succession, showcasing the 𝓦𝓐𝓥𝓓’s speed and accuracy under the right conditions.
The first long trade was initiated upon receiving a bullish reversal signal. The trade was then closed after the price experienced a sharp upwards movement - and an overbought signal was indicated by the purple shading.
The second, short trade was entered on the next bar, after a bearish reversal signal was printed by the indicator (a white cross). Similarly, this trade was closed upon the oversold signal.
Once again, a reversal signal was indicated by the 𝓦𝓐𝓥𝓓 indicator. This time a bullish signal (a white circle), and hence a long position was opened. However, this trade was held until a negative trend confirmation (signaled by the Top Cap’s shift in color). This makes apparent the indicator’s flexible nature, and showcases the multiple signaling types available for traders to use.
Recommended Settings
The optimal settings for the 𝓦𝓐𝓥𝓓 indicator will vary upon the chosen asset’s average level volatility, as well as the timeframe it is applied to.
Due to increased volatility levels on lower timeframes, it is recommended to increase the 'Top Cap Multiplier' to take into account the increased frequency of false signals found in these trading environments. The same can be said when used on highly volatile assets - a trader will likely benefit from using a higher 'Top Cap Multiplier.'
On more price-stable assets, as well as any asset on higher timeframes, there is merit to tightening the length of the 'Top Cap Multiplier,' due to the slower nature of price action.
Methodology
The 𝓦𝓐𝓥𝓓 starts with calculating the volume weighted average price and the volume weighted variance - which is the expectation of the squared deviation of a variable from its mean, giving insights into the distribution of trading volume.
Using the volume weighted variance, a standard deviation value is calculated based on user input. This value acts as the ‘Volumetric Top Cap’ - seen in the 𝓦𝓐𝓥𝓓 indicator window as the zero line.
The signal line is calculated as the difference between the current price and the theoretical upper or lower VWAP deviation bands. This line acts as the trigger for identifying prevailing trends and high probability reversal points.
The base line serves as a reference point for historical momentum. It is calculated using an exponential moving average of the lowest signal line values over a defined lookback period. This baseline helps in assessing whether the current momentum is high or low relative to historical norms.
Notes
Bar coloring can be turned off - especially useful when stacking multiple indicators as recommended, or set to 'Trend Intensity,' or 'Binary Trend' (which reflects the top cap coloring).
It is always recommended to never rely on a single indicator - and instead build and test multiple strategies utilizing more than one indicator as confirmation.

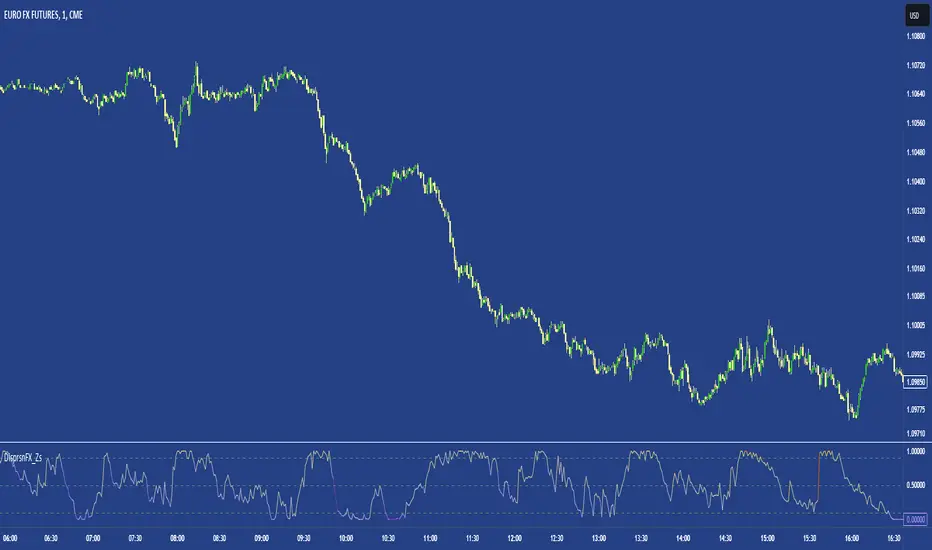
FX DispersionThis script calculates the dispersion of a basket of 5 FX pairs and then calculates the z-score the z-score is then made into a composite using the 30 and 60 ema of the z-score to smooth any noise. It must be used on one of the FX pairs in the basket and on the 1-minute timeframe as it has been hardcoded for 1 min use below.
Interpretation - Dispersion is a component of volatility - the dispersion of the underlying basket increases above 0.5 and decreases below 0.5.
Although increased dispersion is beneficial to momentum and trend-following strategies on the monthly and weekly timeframes. Observe this on the 1-minute timeframe and how dispersion crossing above/ below 0.5 it can signal reversion or momentum for the next period.
EXOFADEEXOFADE is an incredible trading indicator designed help give traders a visual clue of price momentum by combining Linear regression calculations with volume.
Overview:
ExoFade is a unique and dynamic trading indicator designed for both beginner and professional traders. At its core, it uses a sophisticated blend of multiple linear regression analysis, incorporating price, time, and volume-weighted moving average (VWMA) to predict potential price movements. By analyzing these key factors, EXOFade offers an innovative approach to understanding market trends and identifying trade opportunities.
Why It Works:
ExoFade works by calculating a regression line that adapts to market conditions, factoring in both price trends and trading volumes. This approach provides a more nuanced view of market momentum, going beyond traditional price-only indicators. The inclusion of time as a variable offers unique insights into market dynamics, making ExoFade a valuable tool for various trading strategies.
Key Features to Look Out For:
Regression Line: The heart of ExoFade, offering visual cues about the market's direction.
ATR-Based Fade Levels: Utilizes Average True Range (ATR) to set dynamic levels that signal potential reversals or continuation. The indicator comes with three fade levels, which are described below
Alert Conditions: You can set up for alerts for when any of the fade levels have been been reached, indicating potential entry points.
What Are Fade Levels And How To Use The Enter Trades:
The exofade line always moves with price, this indicates that the current volume is moving in the same direction.
When you see the exofade start to move ahead of price. For example, in an Uptrend, if price stops making new highs and you see the exofade line continue moving up ahead of price as price stagnates, this is the first time that you should be expecting pull back or reversal. When the line starts to visibly curve, this when you want to enter the trade.
Sometimes, the exofade line will move just a little bit ahead of price, and sometimes it will move a clear distance ahead of price.
From my experience, the further ahead it moves from price without price keeping up, the higher the probability of a pullback or reversal.
The actual pullback then starts when the exofade line starts to curve, which signifies the start if the actual pullback.
Since we cannot sit and watch for when the line has either moved further ahead enough or started to curve, thats why i figured to use ATR as the best way to measure the distance the exofade line moves ahead of price and the ATR also happens to measure Volatility, which makes it a perfect match.
From forward testing this for months, i have found the pullbacks typically start when the exofade line has moved ahead of price by atleast 2 ATR's. A distance of 2 ATR and above are the ones i consider the best setups. This also marks the point for your stop loss, since 2 ATR is generally used stoploss level.
To catch and sell a pullback in an uptrend, you can set alert for one or both of these alerts
Fade Level 2 abv price - This alert will trigger once Exofade line reached 2 ATR ABOVE price (Just means it has reached 2 atr, dosent mean it has started curving yet)
Curve lvl 2 - SELL - This alert means the exofade line has started to curve at 2 ATR
To buy pullbacks in a downtrend you set the opposite alerts of the one above for curve below price
There are also same alerts for level 3 as well, which is 2.5 ATR
IMPORTANT NOTES - DONT SKIP THIS
For daily and intra-day swings - Use this on 1hr trend upwards - The exofade line much slower on higher timeframe, so when you get a curve on a high time frame, like the 4HR or Daily timeframe, those are excellent signals
For scalpers trading 1hr below - The exofade moves faster on lower timeframes, so more caution should be used with these on lower timeframes , you this with other confluences like a good momentum oscillator oversold/overbought regions StochRSI, MACD etc
EXTRA TIPS
- Since the curve forms slower on higher time frames, it means getting a curve the on daily and weekly chart can help in your trend analysis to detect early signs of potential trend reversals
-I typically pair this with my customized version of Nadaraya watsons envelope ( a free indicator on tradingview) It will further improve your entry and winrate. Biggest advantage is for setting a profit target. In a buy trade for example, you buy the curve below price and set your profit target for the top band of the nadaraya watson envelope. Very efficient for scalping
- Unique areas were you want to pay attention to the exofade is when price enters points of interest, this depending on your trading style could be a
-FVG - fair value gaps
-Order blocks
- Supply / Demand areas
-Volume profile Value area High and Value area Low
The are two scenarios i would like you to be cautious of
1. As with every indicator and strategy, i most definitely wouldn't use this during high impact news.
2. If price is trending very strongly in one direction only, such that even barely gives any decent pull backs at all. Most especially if that strong push is happening between the 4hr to Daily time frame. Do not attempt to counter those trends unless you know what you are doing. Its not advisable.
Instead i'll recommend using the Exofade to catch an entry in the direction of the trade for a continuation.
And Lastly
Since this indicator uses VOLUME data as part of its calculations. It will not work on any pairs that tradingview does not provide volume data for, like Gold. But it will work normally on Gold Futures, since that has volume data

TASC 2023.12 Growth and Value Switching System█ OVERVIEW
This script implements a rotation system for trading value and growth ETFs, as developed by Markos Katsanos and detailed in the article titled 'Growth Or Value?' in TASC's December 2023 edition of Traders' Tips . The purpose of this script is to demonstrate how short-term momentum can be employed to track market trends and provide clarity on when to switch between value and growth.
█ CONCEPTS
The central concept of the presented rotation strategy is based on the observation that the stock market undergoes cycles favoring either growth or value stocks. Consequently, the script introduces a momentum trading system that is designed to switch between value and growth equities based on prevailing market conditions. Specifically tailored for long-term index investors, the system focuses on trading Vanguard's value and growth ETFs ( VTV and VUG ) on a weekly timeframe.
To identify the ETF likely to outperform, the script uses a custom relative strength indicator applied to both VTV and VUG in comparison with an index ( SPY ). To minimize risk and drawdowns during bear markets, when both value and growth experience downtrends, the script employs the author's custom volume flow indicator (VFI) and blocks trades when its reading indicates money outflow . Positions are closed if the relative strength of the current open trade ETF falls below that of the other ETF for two consecutive weeks and is also below its moving average. Additionally, the script implements a stop-loss when the ETF is trading below its 40-week moving average, but only during bear markets.
The script plots the relative strengths of the value and growth equities along with the signals triggered by the aforementioned rules. Information about the current readings of the relative strength and volume flow indicators, along with the current open position, is displayed in a table.
█ CALCULATIONS
The script uses the request.security() function to gather price data for both equities and the reference index. Custom relative strength and volume flow indicators are calculated based on the formulas presented in the original article. By default, the script employs the same parameters for these indicators as proposed in the original article for VTV and VUG on a weekly timeframe.

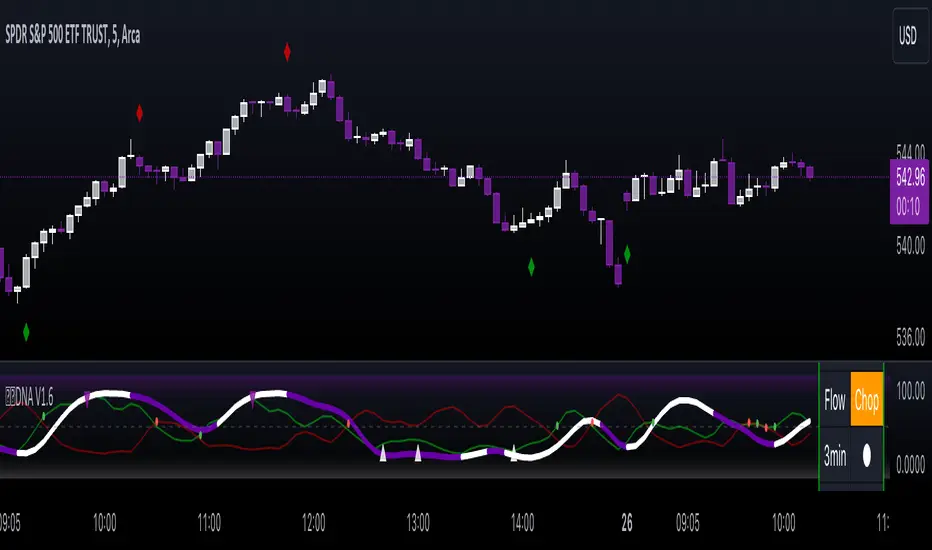
Gorb DNAIntroduction:
Gorb DNA is a versatile indicator using classic technical analysis components such as moving averages, stochastic oscillator, and histogram blending call/put flow analysis with our proprietary DNA algorithm. This indicator is designed to provide traders with useful market direction, volume, and momentum change visual cues.
Overview:
The Gorb DNA Indicator isn't just another momentum tool; it's a complex integration of innovative market analysis techniques.
By combining moving averages, stochastic oscillator, with proprietary algorithms, this indicator offers a multi-layered view of market trends, by merging call/put flow analysis with traditional market flow assessment.
This is designed for all kinds of traders, using a simple method to deliver visual changes in flow, volume, and momentum.
Core Features: Call/Put Flow & DNA
Call/Put Flow Analysis: This component examines the strength of market buying and selling pressures. It analyzes call (buying) and put (selling) flows using price range movements, providing insights smoothed over a defined period for analysis of market sentiment.
DNA Algorithm: A central feature of this indicator, the DNA algorithm utilizes a specialized moving average and oscillator technique to discern market trends. It presents an innovative approach, calculating the difference between bullish and bearish indicators to offer a detailed analysis of market momentum.
Visualization and Color Coding: The indicator employs a color-coded system for ease of interpretation, with distinct colors indicating different market conditions: white for upward/bullish movement and purple for downward/bearish movement. This feature translating complex data into a visual format that is simple to understand.
How Call/Put Flow Works:
Moving averages are used with volume and candlestick highs/lows over a specific range to help determine the overall flow. It then plots a colored line area that looks like a colored wave using just two colors to provide traders with a visual of the current market flow. This can help traders identify changes in sentiment with simple color cues.
How DNA Works:
A stochastic oscillator is used to measure the current price level relative to its price over a specific range period to analyze the momentum for the two DNA strands. Additionally moving averages are used to confirm trend and identify any divergences relative to the momentum. This is then plotted as two lines(DNA Strands) following the same color scheme as Call/Put Flow. When momentum is picking up in a specific direction, the lines will change colors and cross each other, this gives a visual of momentum now being fully on one side until it starts to change colors and flip that direction.
Custom Algorithm Elements:
Gorb DNA isn't just common tools combined into one indicator. It includes proprietary algorithmic elements tailored to enhance technical analysis and timing. These are the reasons what set this indicator apart from common momentum, sentiment, and volume methods.
We recommend experimenting with these features to choose what best suits your trading style.
Settings:
All skill-level friendly presets, easy to enable features with one-click
Call Flow: allows the user to plot a colored area that looks like waves showing increases/decreases in bullish volume (not to be followed blindly)
Put Flow: allows the user to plot a colored area that looks like waves showing increases/decreases in bearish volume (not to be followed blindly)
DNA Strand 1: allows the user to plot one of the algorithm lines to visualize momentum direction (not to be followed blindly)
DNA Strand 2: allows the user to plot one of the algorithm lines to visualize momentum direction (not to be followed blindly)
DNA Strength: allows the user to a histogram displaying momentum volume bars in the background
Flow Threshold: allows users to plot a dotted line to identify when call/put flow is now above average flow range
All colors are changeable for the user to customize to their liking
Call/Put Flow & DNA Demonstration
In the image below, we can see a basic illustration of how these core features function.
As stated above, call/put flow carefully monitors changes in moving averages, volume, and price action. If the market sentiment is shifting one direction, the call/put flow will plot those changes. If market is bullish, call flow should rise and put flow should decrease. The same goes for the opposite if the market is bearish.
As is the same for the DNA strands, if markets momentum is becoming bullish, the lines will change color and then cross to signify a change in momentum and the call flow in the background should match this change. This creates two layers of confluence in an easy understandable visual method.
Using Call/Put Flow
In the image below, we disabled everything but call flow to demonstrate usage.
On the left side of the image, you can see call flow matched price increase, then started to decline. This created a flow divergence, identifying a possible change in price action coming. This happened once flow crossed back below the threshold line and price then beginning to move lower. On the right side of the image, you can see call flow rising and price increasing. This is a good confluence showing there is bullish sentiment building in the market.
In this next image, we disabled everything but put flow to demonstrate usage.
The left side shows a put flow divergence. Put flow is slowly rising just like price is, this can help a trader identify a possible shift in sentiment coming. And on the right side, we have put flow rising above the threshold line and price beginning to decrease. Now we have confluence of bearish sentiment building in the market.
The image below shows only call & put flow enabled, to display what the above two images combined look like.
As you can see in the image above, these flow visuals help identify the underlying market sentiment. And when they cross, it leads to a change in price action in the direction of the sentiment over the threshold line.
Using DNA Strands
The image below has just DNA strands enabled to demonstrate usage.
On the left is a box highlighting bearish momentum cross. In the circles is the change in momentum shifting from bullish to bearish. The move gets stronger as the DNA strands get closer to cross over signifying strength in the move. On the right side is a box highlighting a bullish momentum cross. The circles again, show the change from bearish to bullish momentum. Like previously said, the move gets stronger as the DNA strands get closer to crossing over, signifying strength in that direction.
The next image shows call/put flow and DNA strands enabled for a full complete picture.
The circles labeled (1) are showing the change in momentum from bullish to bearish. Circle (2) shows call flow decreasing and put flow rising above calls. Finally the arrow points to the DNA strands crossing over and put flow rising above the threshold line. This is 3 levels of easy visual confluence showing a change in sentiment, volume, and momentum to the downside.
The next image will be showing the bullish side with call/put flow and DNA strands enabled.
The circles that are labeled (1), show the visual change in momentum on the DNA strands from bearish to bullish. Circle (2) is the crossing of call flow over put flow and the arrow points to the DNA strands crossing over and call flow above the threshold line. Three simple to use visual confluences to identify change in sentiment, volume, and momentum to the upside.
Conclusion:
Our goal is to provide a unique, yet simple approach to market sentiment & momentum analysis. It's a tool developed for traders seeking user-friendly and easy to use tools that provide easy visual insights of market dynamics. We believe in simplicity, effectiveness, and creating tools to support decision making for all traders.
How to get access:
You can see the Author's instructions to get access to this indicator
RISK DISCLAIMER
All content, tools, scripts & education provided by Gorb Algo are for informational & educational purposes only. Trading is risky and most lose their money, past performance does not guarantee future results.
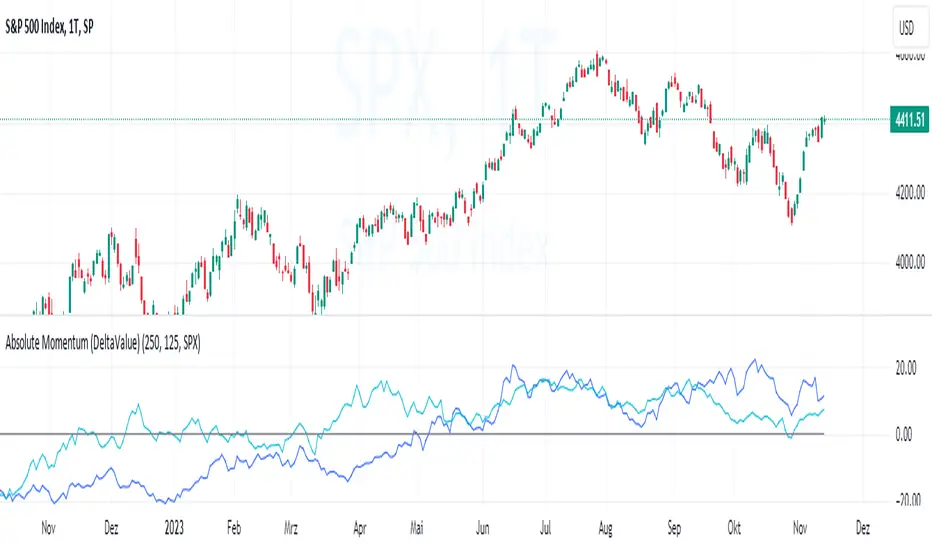
Absolute Momentum (Time Series Momentum)Absolute momentum , also known as time series momentum , focuses on the trend of an asset's own past performance to predict its future performance. It involves analyzing an asset's own historical performance, rather than comparing it to other assets.
The strategy determines whether an asset's price is exhibiting an upward (positive momentum) or downward (negative momentum) trend by assessing the asset's return over a given period (standard look-back period: 12 months or approximately 250 trading days). Some studies recommend calculating momentum by deducting the corresponding Treasury bill rate from the measured performance.
Absolute Momentum Indicator
The Absolute Momentum Indicator displays the rolling 12-month performance (measured over 250 trading days) and plots it against a horizontal line representing 0%. If the indicator crosses above this line, it signifies positive absolute momentum, and conversely, crossing below indicates negative momentum. An additional, optional look-back period input field can be accessed through the settings.
Hint: This indicator is a simplified version, as some academic approaches measure absolute momentum by subtracting risk-free rates from the 12-month performance. However, even with higher rates, the values will still remain close to the 0% line.
Benefits of Absolute Momentum
Absolute momentum, which should not be confused with relative momentum or the momentum indicator, serves as a timing instrument for both individual assets and entire markets.
Gary Antonacci , a key contributor to the absolute momentum strategy (find study below), emphasizes its effectiveness in multi-asset portfolios and its importance in long-only investing. This is particularly evident in a) reducing downside volatility and b) mitigating behavioral biases.
Moskowitz, Ooi, and Pedersen document significant 'time series momentum' across various asset classes, including equity index, currency, commodity, and bond futures, in 58 liquid instruments (find study below). There's a notable persistence in returns ranging from one to 12 months, which tends to partially reverse over longer periods. This pattern aligns with sentiment theories suggesting initial under-reaction followed by delayed over-reaction.
Despite its surprising ease of implementation, the academic community has successfully measured the effects of absolute momentum across decades and in every major asset class, including stocks, bonds, commodities, and foreign exchange (FX).
Strategies for Implementing Absolute Momentum:
To Buy a Stock:
Select a Look-Back Period: Choose a historical period to analyze the stock's performance. A common period is 12 months, but this can vary based on your investment strategy.
Calculate Excess Return: Determine the stock's excess return over this period. You can also assume a risk-free rate of "0" to simplify the process.
Evaluate Momentum:
If the excess return is positive, it indicates positive absolute momentum. This suggests the stock is in an upward trend and could be a good buying opportunity.
If the excess return is negative, it suggests negative momentum, and you might want to delay buying.
Consider further conditions: Align your decision with broader market trends, economic indicators, or fundamental analysis, for additional context.
To Sell a Stock You Own:
Regularly Monitor Performance: Use the same look-back period as for buying (e.g., 12 months) to regularly assess the stock's performance.
Check for Negative Momentum: Calculate the excess return for the look-back period. Again, you can assume a risk-free rate of "0" to simplify the process. If the stock shows negative momentum, it might be time to consider selling.
Consider further conditions:Align your decision with broader market trends, economic indicators, or fundamental analysis, for additional context.
Important note: Note: Entering a position (i.e., buying) based on positive absolute momentum doesn't necessarily mean you must sell it if it later exhibits negative absolute momentum. You can initiate a position using positive absolute momentum as an entry indicator and then continue holding it based on other criteria, such as fundamental analysis.
General Tips:
Reassessment Frequency: Decide how often you will reassess the momentum (monthly, quarterly, etc.).
Remember, while absolute momentum provides a systematic approach, it's recommendable to consider it as part of a broader investment strategy that includes diversification, risk management, fundamental analysis, etc.
Relevant Capital Market Studies:
Antonacci, Gary. "Absolute momentum: A simple rule-based strategy and universal trend-following overlay." Available at SSRN 2244633 (2013)
Moskowitz, Tobias J., Yao Hua Ooi, and Lasse Heje Pedersen. "Time series momentum." Journal of financial economics 104.2 (2012): 228-250
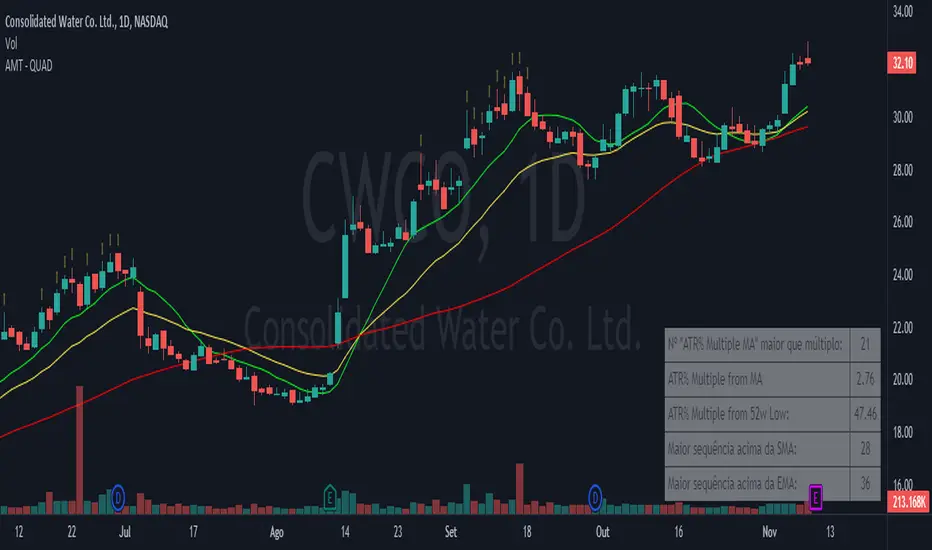
Alpha Momentum Trade - AMT (QUAD Financial)The "Alpha Momentum Trend" indicator was conceived by Tiago Friedrich and programmed by Conrado Villaça.
The indicator description applies to the daily chart. When used on other timeframes, the indicator also changes its signals based on the timeframe used.
It has five fields, from top to bottom:
1. "ATR Multiple MA" greater than multiple: shows how many candles the asset stayed 7 times the ATR (average true range) above the 50-period simple moving average (SMA) in the last 126 candles. The purpose is to identify the strength of the asset because the more times it stayed at this distance from the SMA 50, the greater the acceleration of its prices tends to be, indicating a high momentum asset. You can change the period of the SMA in the indicator settings.
2. ATR% Multiple from MA: shows the multiple of ATR that the asset is from the same SMA as in the upper field. The default is the SMA 50, and the indicator helps identify interesting regions to take profits from long positions. When the asset is more than 7 ATRs above the SMA 50, the asset is considered "stretched," and a correction or price consolidation becomes likely. For high beta assets with a very strong trend, you can use a multiple of 10 ATRs for this purpose.
3. ATR% Multiple from 52w Low: shows the multiple of ATR that the asset is in relation to the 52-week low price. The higher the number, the more the asset has risen relative to its volatility standards, indicating a stronger trend. For momentum traders, it's ideal for the asset to be at least 15 ATRs above the minimum for this period to ensure that it's in a strong uptrend and far from the lows.
4. Longest streak above SMA: within the last 126 candles, it shows the longest streak of days when the asset didn't close below a specific simple moving average. The default definition is with the 10-day SMA, but you can change it in the indicator settings. The more consecutive days the asset can stay above the SMA10, the sign that its trend is consistent and not very volatile, which is desirable. Ideally, an asset should have previously formed an uptrend by staying at least 20 consecutive days above the SMA10.
5. Longest streak above EMA: within the last 126 candles, it shows the longest streak of days when the asset didn't close below a specific exponential moving average. The default definition is with the 21-day EMA, but you can change it in the indicator settings. The more consecutive days the asset can stay above the EMA21, the sign that its trend is consistent and not very volatile, which is desirable. Ideally, an asset should have previously formed an uptrend by staying at least 35 consecutive days above the EMA21.
It's also possible to visualize on the chart the moving averages used for the calculation of the "ATR Multiple MA," "Longest streak above SMA," and "Longest streak above EMA". In the default configuration, this results in a simple 50-day moving average, a simple 10-day moving average, and an exponential 21-day moving average being displayed on the chart, respectively.
Kalman MomentumKalman Filter
The Kalman Filter is an algorithm used for recursive estimation and filtering of time-series data. It was developed by Rudolf E. Kálmán in the 1960s and has found widespread applications in various fields, including control systems, navigation, signal processing, and finance.
The primary purpose of the Kalman filter is to estimate the state of a dynamic system based on a series of noisy measurements over time. It operates recursively, meaning it processes each new measurement and updates its estimate of the system state as new data becomes available.
Kalman Momentum Indicator
This indicator implements the Kalman Filter to provide a smoothed momentum indicator using returns. The momentum in this indicator is calculated by getting the logarithmic returns and then getting the expected value.
The Kalman calculation in this indicator is used to filter and predict the next value based on the logarithmic returns expected value.
Here's a simplified explanation of the steps and how they are applied in the Script:
State Prediction: Predict the current state based on the previous state estimate.
Error Covariance Prediction: Predict the covariance of the prediction error.
Correction Step:
Kalman Gain Calculation: Calculate the Kalman gain, which determines the weight given to the measurement.
State Correction: Update the state estimate based on the measurement.
Error Covariance Correction: Update the error covariance.
In this Script, the Kalman Filter is applied to estimate the state of the system, with two state variables.
When the Kalman Momentum is above 0, there is positive momentum or positive smoothed expected value.
When the Kalman Momentum is below 0, there is negative momentum or negative smoothed expected value.
How to Use:
Trend Identification:
Positive values of the Kalman Momentum Indicator indicates positive expected value, while negative values suggest negative expected value.
You can look for changes in the sign of the indicator to identify potential shifts in market direction.
Volatility Analysis:
Observe the behavior of the indicator during periods of high and low volatility. Changes in the volatility of the Kalman Momentum Indicator may precede changes in market conditions.
Filtering Noise:
The Kalman Filter is known for its ability to filter out noise in time series data. Use the Kalman Momentum Indicator to filter out the noise in momentum to catch the trend more clearly.
Squeezes:
At time there may be squeezes, and these are zones with low volatility. What could follow after these zones are expansions and huge trending moves.
Indicator Settings:
You can change the source of the calculations.
There is also a lookback for the log returns.
Understanding Expected Value in Trading:
The Expected Value is a fundamental concept that shows the potential outcomes of a trading strategy or individual trade over a series of occurrences. It is a measure that represents the average outcome when a particular action is repeated multiple times.
Images of the indicator:

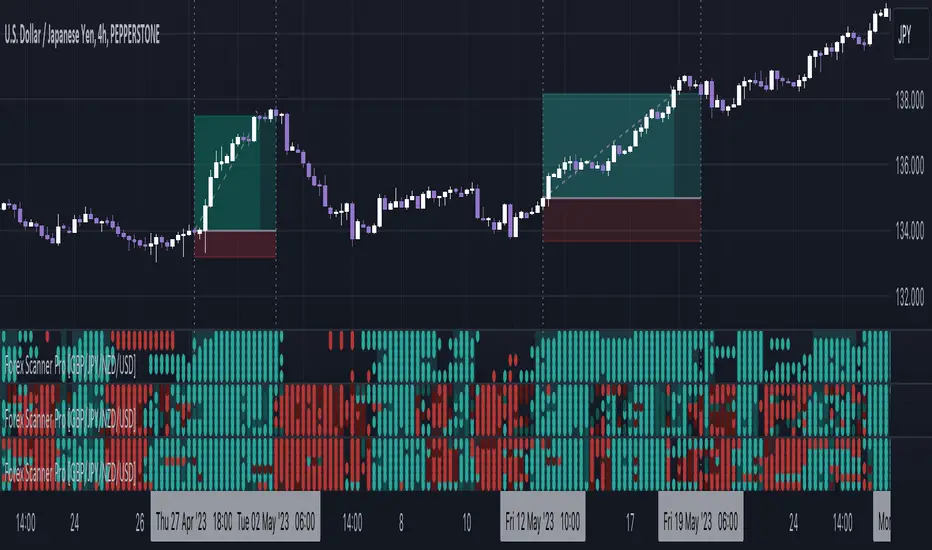
Forex Scanner Pro - GBP/JPY/NZD/USD [FxScripts]Forex Scanner Pro is both a multi-functional indicator and market scanner combined. The combination allows you to have multiple eyes across the market, all from a single chart.
The scanner is comprised of an intuitively designed 3-in-1 tool that tracks the key metrics that drive markets. Each use advanced algorithms to gather information from multiple data points, distilled into one simplified view.
***** TREND SCANNER *****
The first indicator featured on the chart is the Trend Scanner, this allows you to track price action across the wider market. Instantly see pattern shifts and emerging trends; when the market moves, you move with it.
***** MOMENTUM SCANNER *****
The second is the Momentum Scanner which offers a realtime representation of momentum shifts as they occur. This allows you to monitor false breakouts and catch the moves that matter.
***** VOLUME SCANNER *****
The third is the Volume Scanner which provides unique insight into where buy and sell volume is being placed across the market. It offers a further way of determining entry and exit points or simply confirmation that a trend is underway.
***** HOW IT WORKS *****
1. The scanner surveys the market looking for strengths and weaknesses in Trend, Momentum or Volume.
2. It displays the underlying strength or weakness as a series of dots with up to six green dots showing strength and up to six red dots showing weakness.
3. Lighter colored dots are displayed where the strength of the trend, momentum or volume is lesser; if a dot is missing this is a sign of market neutrality.
4. All scanners have a sensitivity setting plus a volatility filter which can be adjusted according to your style of trading and the underlying instrument (full details below).
5. The background can be set to color-fill when the majority of dots are coloured either red or green, with higher values denoting greater strength or greater weakness.
6. Alerts can be configured in the same way as the background to provide both entry and exit signals (further details below).
***** INSTRUMENTS *****
Due to computational restraints, the scanner is split across two different indicators. This one features GBP, JPY, NZD and USD; the other AUD, CAD, CHF and EUR. Both form part of the same package.
Forex Scanner Pro works effortlessly with any of the following major or minor crosses:
AUDCAD, AUDCHF, AUDJPY, AUDNZD, AUDSGD, AUDUSD, CADCHF, CADJPY, CADSGD, CHFJPY, EURAUD, EURCAD, EURCHF, EURGBP, EURJPY, EURNZD, EURSGD, EURUSD, GBPAUD, GBPCAD, GBPCHF, GBPJPY, GBPNZD, GBPSGD, GBPUSD, NZDCAD, NZDCHF, NZDJPY, NZDUSD, SGDJPY, USDCAD, USDCHF, USDJPY, USDSGD
***** SETTINGS OVERVIEW *****
The scanner features the following customizable settings:
~~ Trend Settings ~~
▶ Trend Filter - adjusting this will allow you to focus on short term trends (most suitable for scalping), medium or long term (best for swing trading).
▶ Countertrend Strength - increases the sensitivity of weaker vs stronger countertrends. As countertrends are trends that run against the main trend, this will assist in detecting the strength of a pullback or reversal and allow you to either hold, exit or reverse the trade with confidence.
~~ Momentum Settings ~~
▶ Momentum Filter - increase or decrease the sensitivity of the momentum scanner. Increase to avoid periods of low or weak momentum, decrease to highlight stronger surges in momentum.
~~ Volume Settings ~~
▶ Volume Filter - increase or decrease the sensitivity of the volume scanner. Increase to avoid periods where buy and sell volume can potentially cancel each other out.
~~ Volatility Settings ~~
▶ Volatility Offset - use this to fine tune the volatility filter. A higher value generally delays the volatility filter allowing for confirmation of stronger trends, a lower value will detect trend, momentum or volume movement sooner but may be less accurate.
▶ Each scanner has its own setting allowing you to adjust how you monitor the underlying volatility for each.
▶ As with all settings, we recommend adjusting this to your style of trading, instrument and timeframe.
~~ Alerts ~~
Alerts can be configured to send notifications when anything from 4-6 bullish or bearish dots are showing. Exit markers can be configured when anything from 2+ dots are revealed. This adds an extra layer of sensitivity for traders who appreciate complete control over their trade.
~~ Display Settings ~~
You have the ability to hide all colored dots and only show the background or, alternatively, hide the background and only show colored dots.
***** TRIAL PERIOD *****
We offer a FREE, no questions asked, 7-day trial with every new registration. Visit the link below to register.
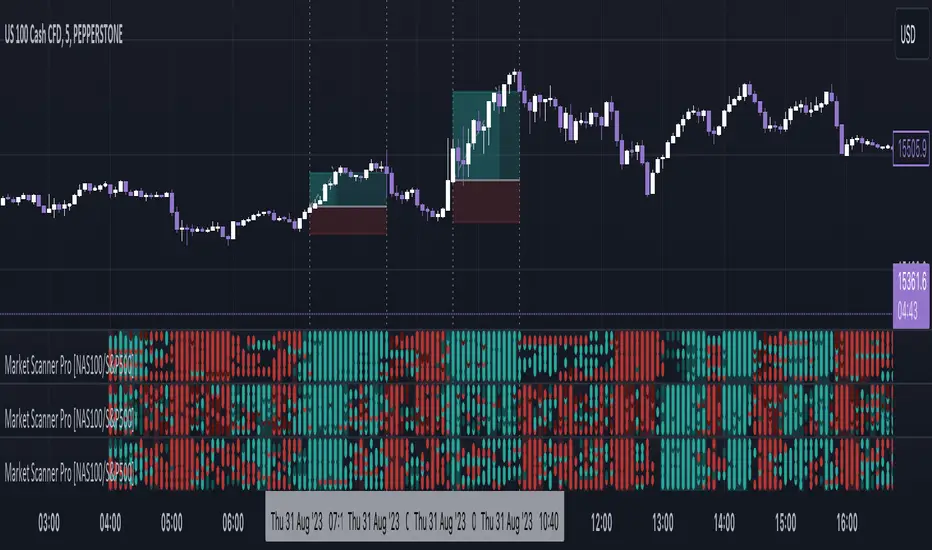
Market Scanner Pro - NAS100/S&P500 [FxScripts]***** OVERVIEW *****
Market Scanner Pro is both a multi-functional indicator and market scanner combined. The combination allows you to have multiple eyes across the market, all from a single chart.
The scanner is comprised of an intuitively designed 3-in-1 tool that tracks the key metrics that drive markets. Each use advanced algorithms to gather information from multiple data points, distilled into one simplified view.
***** TREND SCANNER *****
The first indicator featured on the chart is the Trend Scanner, this allows you to track price action across the wider market. Instantly see pattern shifts and emerging trends; when the market moves, you move with it.
***** MOMENTUM SCANNER *****
The second is the Momentum Scanner which offers a realtime representation of momentum shifts as they occur. This allows you to monitor false breakouts and catch the moves that matter.
***** VOLUME SCANNER *****
The third is the Volume Scanner which provides unique insight into where buy and sell volume is being placed across the market. It offers a further way of determining entry and exit points or simply confirmation that a trend is underway.
***** HOW IT WORKS *****
1. The scanner surveys the market looking for strengths and weaknesses in Trend, Momentum or Volume.
2. It displays the underlying strength or weakness as a series of dots with up to 10 green dots showing strength and up to 10 red dots showing weakness.
3. Lighter colored dots are displayed where the strength of the trend, momentum or volume is lesser; if a dot is missing this is a sign of market neutrality.
4. All scanners have a sensitivity setting plus a volatility filter which can be adjusted according to your style of trading and the underlying instrument (full details below).
5. The background can be set to color-fill when the majority of dots are coloured either red or green, with higher values denoting greater strength or greater weakness.
6. Alerts can be configured in the same way as the background to provide both entry and exit signals (further details below).
***** INSTRUMENTS *****
Market Scanner Pro is made up of both a European and US indices scanner, both forming part of the same package.
European features the DAX40 and FTSE100; US (this scanner) features the NAS100 plus S&P500. The US scanner works on futures and options such as ES, NQ, QQQ, SPX and SPY.
***** SETTINGS OVERVIEW *****
The scanner features the following customizable settings:
~~ Trend Settings ~~
▶ Trend Filter - adjusting this will allow you to focus on short term trends (most suitable for scalping), medium or long term (best for swing trading).
▶ Countertrend Strength - increases the sensitivity of weaker vs stronger countertrends. As countertrends are trends that run against the main trend, this will assist in detecting the strength of a pullback or reversal and allow you to either hold, exit or reverse the trade with confidence.
~~ Momentum Settings ~~
▶ Momentum Filter - increase or decrease the sensitivity of the momentum scanner. Increase to avoid periods of low or weak momentum, decrease to highlight stronger surges in momentum.
~~ Volume Settings ~~
▶ Volume Filter - increase or decrease the sensitivity of the volume scanner. Increase to avoid periods where buy and sell volume can potentially cancel each other out.
~~ Volatility Settings ~~
▶ Volatility Offset - use this to fine tune the volatility filter. A higher value generally delays the volatility filter allowing for confirmation of stronger trends, a lower value will detect trend, momentum or volume movement sooner but may be less accurate.
▶ Each scanner has its own setting allowing you to adjust how you monitor the underlying volatility for each.
▶ As with all settings, we recommend adjusting this to your style of trading, instrument and timeframe.
~~ Alerts ~~
Alerts can be configured to send notifications when anything from 6-10 bullish or bearish dots are showing. Exit markers can be configured when anything from 2+ dots are revealed. This adds an extra layer of sensitivity for traders who appreciate complete control over their trade.
~~ Display Settings ~~
You have the ability to hide all colored dots and only show the background or, alternatively, hide the background and only show colored dots.
***** TRIAL PERIOD *****
We offer a FREE, no questions asked, 7-day trial with every new registration. Visit the link below to register.
Market Scanner Pro - DAX/FTSE [FxScripts]***** OVERVIEW *****
Market Scanner Pro is both a multi-functional indicator and market scanner combined. The combination allows you to have multiple eyes across the market, all from a single chart.
The scanner is comprised of an intuitively designed 3-in-1 tool that tracks the key metrics that drive markets. Each use advanced algorithms to gather information from multiple data points, distilled into one simplified view.
***** TREND SCANNER *****
The first indicator featured on the chart is the Trend Scanner, this allows you to track price action across the wider market. Instantly see pattern shifts and emerging trends; when the market moves, you move with it.
***** MOMENTUM SCANNER *****
The second is the Momentum Scanner which offers a realtime representation of momentum shifts as they occur. This allows you to monitor false breakouts and catch the moves that matter.
***** VOLUME SCANNER *****
The third is the Volume Scanner which provides unique insight into where buy and sell volume is being placed across the market. It offers a further way of determining entry and exit points or simply confirmation that a trend is underway.
***** HOW IT WORKS *****
1. The scanner surveys the market looking for strengths and weaknesses in Trend, Momentum or Volume.
2. It displays the underlying strength or weakness as a series of dots with up to 10 green dots showing strength and up to 10 red dots showing weakness.
3. Lighter colored dots are displayed where the strength of the trend, momentum or volume is lesser; if a dot is missing this is a sign of market neutrality.
4. All scanners have a sensitivity setting plus a volatility filter which can be adjusted according to your style of trading and the underlying instrument (full details below).
5. The background can be set to color-fill when the majority of dots are coloured either red or green, with higher values denoting greater strength or greater weakness.
6. Alerts can be configured in the same way as the background to provide both entry and exit signals (further details below).
***** INSTRUMENTS *****
Market Scanner Pro is made up of both a European and US indices scanner, both forming part of the same package.
European (this scanner) features the DAX40 and FTSE100; US features the NAS100 plus S&P500. The US scanner works on futures and options such as ES, NQ, QQQ, SPX and SPY.
***** SETTINGS OVERVIEW *****
The scanner features the following customizable settings:
~~ Trend Settings ~~
▶ Trend Filter - adjusting this will allow you to focus on short term trends (most suitable for scalping), medium or long term (best for swing trading).
▶ Countertrend Strength - increases the sensitivity of weaker vs stronger countertrends. As countertrends are trends that run against the main trend, this will assist in detecting the strength of a pullback or reversal and allow you to either hold, exit or reverse the trade with confidence.
~~ Momentum Settings ~~
▶ Momentum Filter - increase or decrease the sensitivity of the momentum scanner. Increase to avoid periods of low or weak momentum, decrease to highlight stronger surges in momentum.
~~ Volume Settings ~~
▶ Volume Filter - increase or decrease the sensitivity of the volume scanner. Increase to avoid periods where buy and sell volume can potentially cancel each other out.
~~ Volatility Settings ~~
▶ Volatility Offset - use this to fine tune the volatility filter. A higher value generally delays the volatility filter allowing for confirmation of stronger trends, a lower value will detect trend, momentum or volume movement sooner but may be less accurate.
▶ Each scanner has its own setting allowing you to adjust how you monitor the underlying volatility for each.
▶ As with all settings, we recommend adjusting this to your style of trading, instrument and timeframe.
~~ Alerts ~~
Alerts can be configured to send notifications when anything from 6-10 bullish or bearish dots are showing. Exit markers can be configured when anything from 2+ dots are revealed. This adds an extra layer of sensitivity for traders who appreciate complete control over their trade.
~~ Display Settings ~~
You have the ability to hide all colored dots and only show the background or, alternatively, hide the background and only show colored dots.
***** TRIAL PERIOD *****
We offer a FREE, no questions asked, 7-day trial with every new registration. Visit the link below to register.

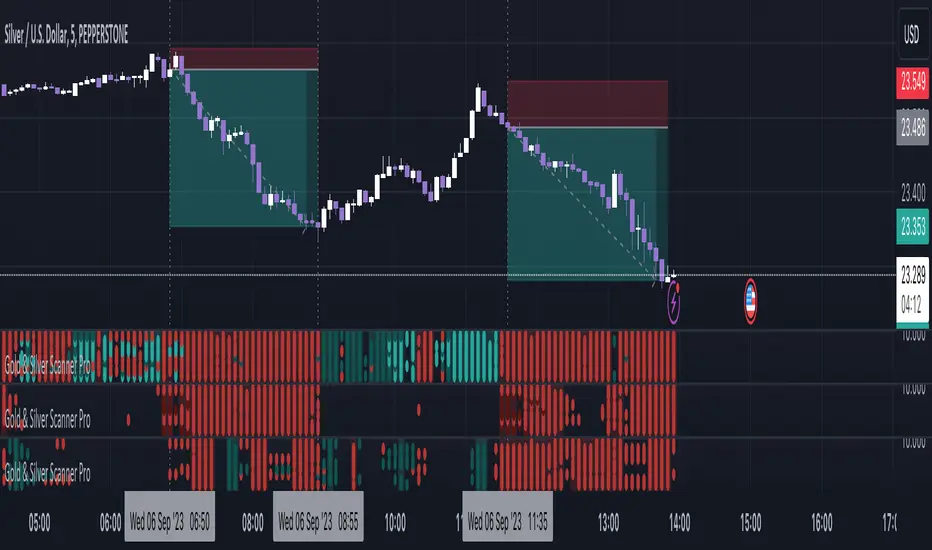
Gold & Silver Scanner Pro [FxScripts]***** FEATURES *****
Gold & Silver Scanner Pro is both a multi-functional indicator and market scanner combined. The combination allows you to have multiple eyes across the market, all from a single chart.
The scanner is comprised of an intuitively designed 3-in-1 tool that tracks the key metrics that drive markets. Each use advanced algorithms to gather information from multiple data points, distilled into one simplified view.
***** TREND SCANNER *****
The first indicator featured on the chart is the Trend Scanner, this allows you to track price action across the wider market. Instantly see pattern shifts and emerging trends; when the market moves, you move with it.
***** MOMENTUM SCANNER *****
The second is the Momentum Scanner which offers a realtime representation of momentum shifts as they occur. This allows you to monitor false breakouts and catch the moves that matter.
***** VOLUME SCANNER *****
The third is the Volume Scanner which provides unique insight into where buy and sell volume is being placed across the market. It offers a further way of determining entry and exit points or simply confirmation that a trend is underway.
***** HOW IT WORKS *****
1. The scanner surveys the market looking for strengths and weaknesses in Trend, Momentum or Volume.
2. It displays the underlying strength or weakness as a series of dots with up to nine green dots showing strength and up to nine red dots showing weakness (nine data points in total).
3. Lighter colored dots are displayed where the strength of the trend, momentum or volume is lesser; if a dot is missing this is a sign of market neutrality.
4. All scanners have a sensitivity setting plus a volatility filter which can be adjusted according to your style of trading and the underlying instrument (full details below).
5. The background can be set to color-fill when the majority of dots are coloured either red or green, with higher values denoting greater strength or greater weakness.
6. Alerts can be configured in the same way as the background to provide both entry and exit signals (further details below).
***** INSTRUMENTS *****
Gold & Silver Scanner Pro works effortlessly with any of the XAG and XAU major or minor crosses:
XAGAUD, XAGCHF, XAGEUR, XAGGBP, XAGJPY, XAGUSD, XAUAUD, XAUCHF, XAUEUR, XAUGBP, XAUJPY, XAUUSD
Plus the following gold and silver futures:
GC, SI
***** SETTINGS OVERVIEW *****
The scanner features the following customizable settings:
~~ Trend Settings ~~
▶ Trend Filter - adjusting this will allow you to focus on short term trends (most suitable for scalping), medium or long term (best for swing trading).
▶ Countertrend Strength - increases the sensitivity of weaker vs stronger countertrends. As countertrends are trends that run against the main trend, this will assist in detecting the strength of a pullback or reversal and allow you to either hold, exit or reverse the trade with confidence.
~~ Momentum Settings ~~
▶ Momentum Filter - increase or decrease the sensitivity of the momentum scanner. Increase to avoid periods of low or weak momentum, decrease to highlight stronger surges in momentum.
~~ Volume Settings ~~
▶ Volume Filter - increase or decrease the sensitivity of the volume scanner. Increase to avoid periods where buy and sell volume can potentially cancel each other out.
~~ Volatility Settings ~~
▶ Volatility Offset - use this to fine tune the volatility filter. A higher value generally delays the volatility filter allowing for confirmation of stronger trends, a lower value will detect trend, momentum or volume movement sooner but may be less accurate.
▶ Each scanner has its own setting allowing you to adjust how you monitor the underlying volatility for each.
▶ As with all settings, we recommend adjusting this to your style of trading, instrument and timeframe.
~~ Alerts ~~
Alerts can be configured to send notifications when anything from 5-9 bullish or bearish dots are showing. Exit markers can be configured when anything from 2+ dots are revealed. This adds an extra layer of sensitivity for traders who appreciate complete control over their trade.
~~ Display Settings ~~
You have the ability to hide all colored dots and only show the background or, alternatively, hide the background and only show colored dots.
***** TRIAL PERIOD *****
We offer a FREE, no questions asked, 7-day trial with every new registration. Visit the link below to register.
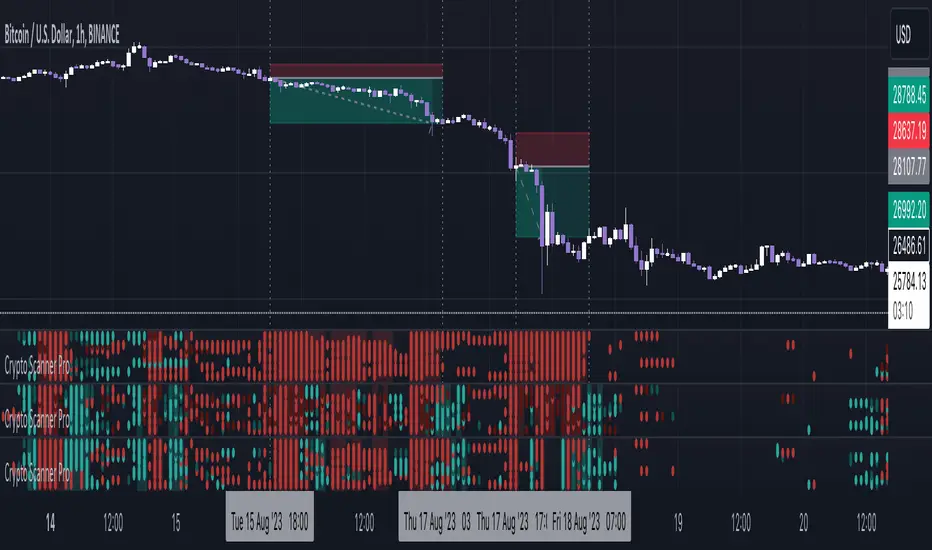
Crypto Scanner Pro [FxScripts]***** FEATURES *****
Crypto Scanner Pro is both an indicator and market scanner combined. The combination allows you to have multiple eyes across the market, all from a single chart.
Each scanner is comprised of an intuitively designed 3-in-1 tool that tracks the key metrics that drive markets.
They each use advanced algorithms to gather information from multiple data points, distilled into one simplified view.
***** TREND SCANNER *****
The Trend Scanner allows you to track price action across the wider market. Instantly see pattern shifts and emerging trends; when the market moves, you can move with it.
***** MOMENTUM SCANNER *****
The Momentum Scanner offers realtime insights into momentum shifts as they occur. This allows you to monitor false breakouts and catch the moves that matter.
***** VOLUME SCANNER *****
The Volume Scanner provides unique indications into where buy and sell volume is being placed. It offers a further way of determining entry and exit points or simply confirmation that a trend is underway.
***** INSTRUMENTS *****
Crypto Scanner Pro works effortlessly with the following large cap coins:
Avalanche, Bitcoin Cash, Bitcoin, BITO, BNB, Cardano, Chainlink, Dogecoin, Ethereum, Litecoin, Polkadot, Polygon, Shiba Inu, Solana, Stellar, Toncoin, XRP (Ripple) *
***** SETTINGS OVERVIEW *****
The scanner features the following customizable settings:
~~ Trend Settings ~~
Trend Filter - adjusting this will allow you to focus on short term trends (most suitable for scalping), medium or long term (best for swing trading).
Countertrend Strength - increases the sensitivity of weaker vs stronger countertrends. As countertrends are trends that run against the main trend, this will assist in detecting the strength of a pullback or reversal and allow you to either hold, exit or reverse the trade with confidence.
~~ Momentum Settings ~~
Momentum Filter - increase or decrease the sensitivity of the momentum scanner. Increase to avoid periods of low or weak momentum, decrease to highlight stronger surges in momentum.
~~ Volume Settings ~~
Volume Filter - increase or decrease the sensitivity of the volume scanner. Increase to avoid periods where buy and sell volume can potentially cancel each other out.
~~ Volatility Settings ~~
Volatility Offset - use this to fine tune the volatility filter. A higher value generally delays the volatility filter allowing for confirmation of stronger trends, a lower value will detect trend, momentum or volume movement sooner but may be less accurate.
Each scanner has its own setting allowing you to adjust how you monitor the underlying volatility for each.
As with all settings, we recommend adjusting this to your style of trading, instrument and timeframe.
~~ Alerts ~~
Alerts can be configured to send notifications when anything from 6-10 bullish or bearish dots are showing. Exit markers can be configured when anything from 2+ dots are revealed. This adds an extra layer of sensitivity for traders who appreciate complete control over their trade.
~~ Display Settings ~~
You have the ability to hide all colored dots and only show the background or, alternatively, hide the background and only show colored dots.
***** TRIAL PERIOD *****
We offer a FREE, no questions asked, 7-day trial with every new registration. Visit the link below to register.
* list subject to change as coins increase or decrease in popularity
Zaree - FX Index RSI IndicatorDescription:
The "Zaree - FX Index RSI Indicator" (FIRI) is a technical analysis tool designed to provide insights into the relative strength of two selected currency indices using the Relative Strength Index (RSI). It allows traders to compare the RSI values of a primary currency index and a secondary currency index, helping them identify potential overbought and oversold conditions in the currency market.
Details of the Indicator:
The indicator calculates the RSI for both the primary and secondary currency indices based on the user's selections.
Traders can choose from a variety of currency indices to use as the primary and secondary indices for comparison.
The indicator offers settings for customizing the calculation of the RSI, including selecting the type of moving average (SMA, EMA, WMA, SMMA) and adjusting the length of the RSI and moving average.
Upper and lower RSI bands are displayed on the chart to highlight potential overbought and oversold conditions.
The RSI values and their corresponding moving average values are plotted on the chart, allowing traders to visually analyze the relative strength of the indices.
How to Use the Indicator:
Select the primary and secondary currency indices you want to compare from the provided dropdown menus. These indices will serve as the basis for RSI calculation.
Choose the type of moving average (SMA, EMA, WMA, SMMA) to use for RSI calculation and set the desired length for the moving average.
Decide whether you want to visualize the RSI and moving average values for the primary and secondary indices on the chart.
Observe the RSI values and moving averages plotted on the chart. The indicator's upper and lower bands can help you identify potential overbought (above the upper band) and oversold (below the lower band) conditions.
Pay attention to the intersections between the RSI values and the moving average lines. These intersections can provide insights into potential trend changes or reversals in the currency market.
Example of Usage:
Let's say you're a swing trader focusing on currency pairs involving the US Dollar (USD) and Euro (EUR). You want to compare the relative strength of the USD Index (USDINX) and the EUR Index (EURINX) to identify potential trading opportunities. Here's how you can use the FIRI indicator:
Select "USDINX" as the primary index and "EURINX" as the secondary index.
Choose "SMA" as the moving average type and set the RSI length to 14.
Enable the visualization of RSI values for both the primary and secondary indices.
Observe the chart to identify instances where the RSI values of the indices cross above the upper band (potential overbought) or below the lower band (potential oversold).
Look for intersections between the RSI values and the moving average lines. A bullish signal may occur when the RSI crosses above the moving average, indicating potential upward momentum, while a bearish signal may occur when the RSI crosses below the moving average, indicating potential downward momentum.
Remember that the FIRI indicator is a tool to assist you in your analysis. It's important to consider other technical and fundamental factors before making trading decisions.
Feel free to adjust the settings of the indicator based on your trading preferences and strategy. Keep in mind that no indicator is foolproof, and it's recommended to use the FIRI indicator in conjunction with other analysis techniques for a comprehensive trading approach.

Velocity Indicator [CC]The Velocity Indicator was created by Scott Cong (Stocks and Commodities Sep 2023, pgs 8-15). This is my variation of his formula designed to capture the overall velocity of the underlying stock by applying the typical velocity formula. This indicator is visually similar to a typical stochastic indicator but uses a different underlying calculation. This works well as a momentum indicator, and the values are completely unbounded, so the best ways to determine bullish or bearish trends is either by using a crossover or crossunder between the indicator and the midline or to buy or sell the indicator when it reaches a high or low point and starts to fall or rise respectively. For my default version, I used the zero line to help determine the bullish or bearish trends. I have also included multiple colors to differentiate between very strong signals and normal signals, so very strong signals are darker in color, and normal signals use lighter colors. Buy when the line turns green and sell when it turns red.
Let me know if there are any other indicators or scripts you would like to see me publish! I will have some more new scripts in the next week or so.

Anit Momentum IndicatorAnit Momentum Indicator: A Powerful Trend Continuation Tool for Long-Only Strategies
The "Anit Momentum Indicator" (AMI) is a powerful technical analysis tool designed to assist traders in identifying potential trend continuation opportunities in the financial markets. Unlike traditional trend reversal indicators, AMI is specifically crafted for long-only strategies, making it an ideal tool for traders seeking to capture sustained uptrends.
Concepts and Functionality:
1. Momentum Calculation:
The Anit Momentum Indicator begins by calculating the momentum of the closing price over a specified period. Momentum represents the rate of price change, offering clues about the strength and direction of price movements during the chosen duration.
2. RSI for Trend Continuation:
The script then applies the RSI to the previously computed momentum values. The RSI is a well-known oscillator used to measure the speed and magnitude of price changes. By utilizing the RSI on momentum data, the Anit Momentum Indicator gains a distinct advantage in gauging the strength of price momentum, leading to more accurate trend evaluations.
3. Rescaling for Better Visualization:
To enhance visual clarity and maintain consistent representation, the RSI on Momentum is rescaled to range from 0 to 100. This normalization ensures that the indicator's values remain within a fixed range, making it easier for traders to identify crucial overbought and oversold regions.
How to Use the Indicator:
Long-Only Strategy:
The AMI is most effective in long-only strategies. Traders can deploy the indicator to identify promising opportunities to go long on a stock or asset. A long position is established when the AMI crosses above 50, signaling a robust upward momentum.
Trend Continuation Confirmation:
The AMI's ability to capture trend continuation opportunities allows traders to stay invested in an uptrend for an extended period. As long as the AMI remains above 50, the uptrend is considered intact, and traders may continue to hold the position.
Higher Timeframe Advantage:
The AMI's effectiveness is further enhanced on higher timeframes. Longer timeframes provide a more reliable and sustained view of the underlying trend, giving traders greater confidence in their long-only strategies.
Conclusion:
The Anit Momentum Indicator is a valuable tool for traders pursuing trend continuation strategies, specifically long-only approaches. By leveraging the concept of momentum and RSI, the AMI helps traders identify and participate in sustained uptrends. With its focus on trend continuation rather than reversals, the AMI can be a key component in building successful long-only trading strategies, especially on higher timeframes. Traders can use this indicator to stay invested in robust uptrends, maximizing their profit potential while minimizing exposure to counter-trend moves by staying long till AMI value is greater than 50,it is better to stay away or exit from the asst class when AMI value is less than 50.

ATR Momentum [QuantVue]ATR Momentum is a dynamic technical analysis tool designed to assess the momentum of a securities price movement. It utilizes the comparison between a faster short-term Average True Range (ATR) and a slower long-term ATR to determine whether momentum is increasing or decreasing.
This indicator visually represents the momentum relationship by plotting both ATR values as lines on a chart and applying color fill between the lines based on if momentum is increasing or decreasing.
When the short-term ATR is greater than the long-term ATR, representing increasing momentum, the area between them is filled with green.
Conversely, when the short-term ATR is less than the long-term ATR line, the area between them is filled with red. This red fill indicates decreasing momentum.
Don't hesitate to reach out with any questions or concerns.
We hope you enjoy!
Cheers.

[volfgang] WAVEA compass to the financial charts.
The Volfgang WAVE Indicator helps you to decode complex market trends and make informed decisions in your trading.
Quick Summary
The WAVE has a signal line which alternates between Red or Blue.
Red is bearish and Blue is bullish.
It turns Blue when the WAVE line crosses above the signal and holds for 1 bar.
it turns Red when the WAVE line crosses below the signal and holds for 1 bar.
(You can change the signal line’s length in the settings, the default is 3 which is suited towards Day Trading – For Swing Traders I recommend 4 or 5 – For Investors 6 to 9).
The WAVE line will change colour to alert you when price is potentially pivoting.
When the WAVE is WHITE, the trend is currently Bearish but could flip bullish soon.
When the WAVE is GREEN, the trend is Bullish and there is strong Bullish momentum.
When the WAVE is ORANGE, it means trend is bullish but there is danger of a Bearish Reversal.
When the WAVE is PINK it means there is strong Bearish Momentum.
WAVETrend Scanner
The WAVETrend Scanner can be enabled in the settings and gives you a quick overview of the current trend across 8 potential timeframes:
You can use this to make sure the trades you are taking on lower timeframes align with the current bias on higher term timeframes, thus ensuring a higher chance of success.
WAVE Colours
The background colour of the WAVE also changes according to the current trend across multiple timeframes. The scanner is constantly measuring the current trend across 7 timeframes;
When 4 timeframes line up Bullish, the WAVE is LIGHT BLUE (Cyan)
When 5 timeframes line up Bullish, the WAVE is DARK BLUE (Navy)
When 6+ timeframes line up Bullish, the WAVE is GREEN
When 4 timeframes line up Bearish, the WAVE is ORANGE
When 5 timeframes line up Bearish, the WAVE is RED
When 6+ timeframes line up Bearish, the WAVE is PINK
Divergence Checker & Buy/Sell Signals
The BUY and SELL Signals are represented by a BLUE or RED Histogram line that extends from the WAVE to the 0 Line.
A BUY signal shows when a Crossover occurs & there is a Bullish Diversion Present within the last 50 bars.
A SELL signal appears when a Crossunder occurs & there is Bearish Diversion present within the last 50 bars.
You can change the length of the Divergence Checker in the settings, default is 50 bars.
Under The Hood
The WAVE pulls information from multiple sources within a set period such as;
Close Price
Highest Price
Lowest Price
EMA
The script applies a set of complicated algebraic equations. Which essentially measures the and of recent price action.
Then it uses EMA's to measure from the and , whilst applying more weight to recent price action.
The functions then calculate more averages which measure the difference from and .
Next, it uses all of these calculated averages to create a value that represents the current WAVE condition. This calculation will determine whether the WAVE is in a bullish or bearish trend.
This sum is then smoothed out to get one more value, which is used to display the info box content that allows us to see exactly at what price the WAVE will keep rising or keep falling.
One final calculation also predicts the point at which the WAVE will flip trend. It uses similar calculations to the "Keep Rising/Falling" prediction function, but its aim is to predict the exact price at which the WAVE will cross.
What gives the WAVE indicator an edge over most Stochastic Indicators, is how it uses Pinescript's "request.security" function to pull information from multiple timeframes in order to generate plots, info data and colours to add much more relevant information to the chart which you can use to make informed trading decisions. This is what allows the WAVETrend Scanner to work.
The WAVE indicator is designed to work with all markets and asset types.
