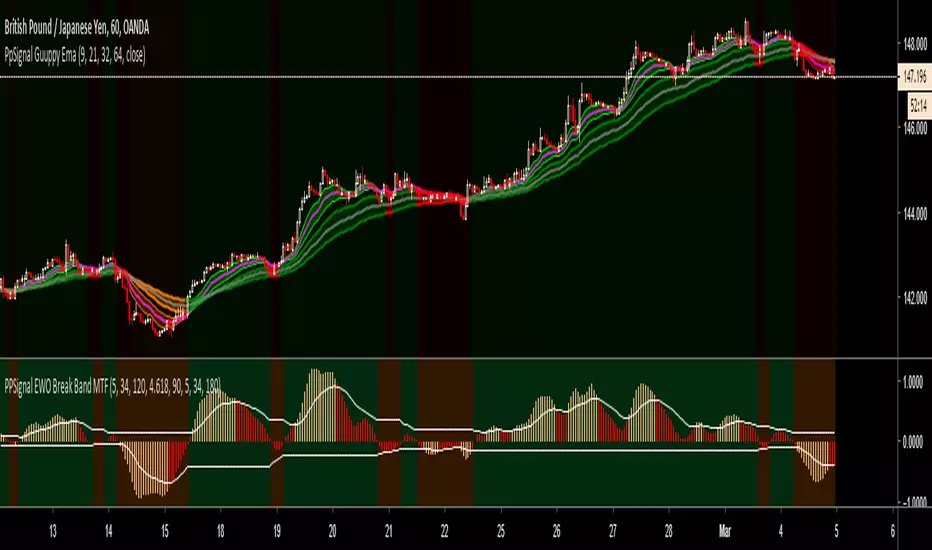
PpSignal Guppy with EMAThis the gruppy ema indicator. I changed the period ema 9 and 21 for the short time and 32 64 for the long time.
M-forex
Darvas Box/Turtle Way Breakouts v.2 by ZekisFor those who never heard about these two huge strategies:
* * * Darvas Box Strategy - www.netpicks.com
* * * Turtle Way Strategy - www.investopedia.com
In very short terms, both strategies are based on breakouts, probably the easiest way to trade (with proper education, obviously)
I created this indicator based on highs and lows, which will create support and resistance line, which will create a channel/box.
There is the possibility to :
- change channel/box size
- ride it till it will enter again into the channel/box
- set TPs and SL targets
- set alerts for Long, Short, Close when price enter into the channel, SL
- enable or disable 2 TP targets
- enable or disable 1 SL
- enable or disable middle line
Rules are simple:
1. Go Long when price breaks the upper line
2. Go Short when price breaks the lower line
3. Exit Long/Short when price enter into the channel/box
4. Stop Loss are added for safety
5. Added 2 layers for Take Profits
6. Added middle line that can act as Stop Loss
Legend:
1. White line - channel/box
2. Upper white line followed by green line - price cracked the channel/box - Go Long
3. Lower white line followed by red line - price cracked the channel/box - Go Short
4. Red zone - Stop Loss zone
5. Dotted red line - Stop Loss line
6. Dark green zone - first Take Profit zone
7. First dotted dark green line - first Take Profit target
8. First dotted dark green line followed by dotted lime line - price touched first Take Profit
9. Bright green zone - second Take Profit zone
10. Second dotted dark green line - second Take Profit target
11. Second dotted dark green line followed by dotted lime line - price touched second Take Profit
12. Dotted gray line - channel/box middle line
*** Don't use any indicator without knowing whatyou are doing, there is no such a magic lottery winning ticket
Trade safe!
Enjoy!
@Zekis

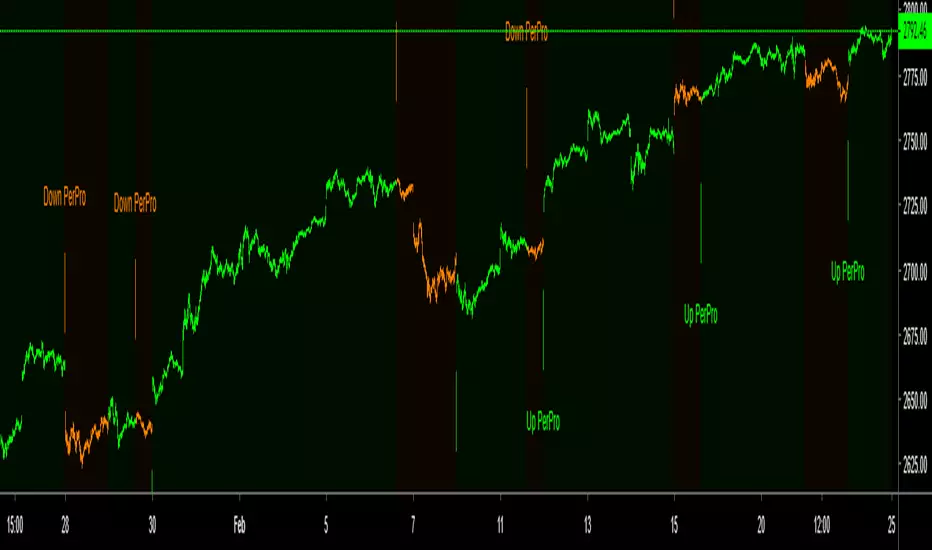
PerPro V5 Publish updatedSend me a private message to be enabled
Algorithmic system with 80% assertiveness. DO NOT REPAINT
Please read
Use the system using other trend indicators. I attach some.
ideal for use in channels, resistances supports and Fibonacci levels.
Setting recommendation
- "For 1min TF = 15min"
- "For 5min TF = 60"
- "For 1H Forex TF = 4H Or D, for stock 1H TF = D"
- "For Day use TF = W"
- "For Week TF = M"
COINBASE:BTCUSD
Attached some indicators that may be useful

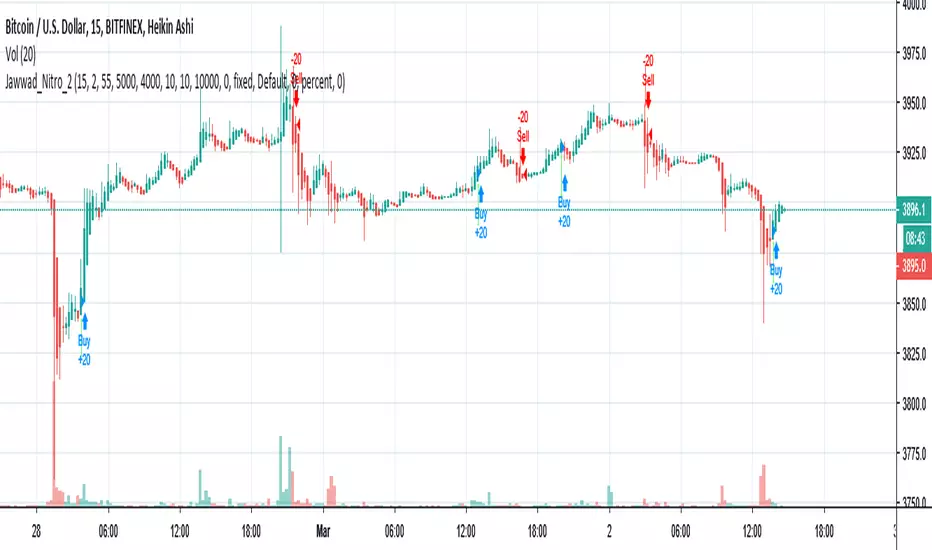
Jawwad Nitro_2 Crypto Forex Strategy - Highly ProfitableThis strategy is tested on selected crypto and forex pairs. It seems to be highly profitable and non-repainting. You can make some good money until you are following it properly and not playing with the settings.
1. Use 15 minute Heiken-ashi chart.
2. Apply the strategy.
3. Enjoy!!!
If this strategy works for you, please don't forget to buy me a cup of coffee... If you find anything wrong, please let me know. I shall be happy to fix it for you.
Cheers,
Jawwad
LetsTrendShortThis Special Indicator pairs great with kiki, and it is meant to let you know when a high probability short opportunity arises.
Only one rule to this indicator, Only enter a short trade when the signal candle is below the purple line.
Comments? Concerns? Post them in the comments below, really just looking for feedback from traders.
Happy Trading!
Bitcoin: 3M8cMjWXCbMBRbgMPS95wZGDZXXecL5q9v
Litecoin: MWd2E3T2BwZrPbS3DdYx2vvuapwoPQmvFo

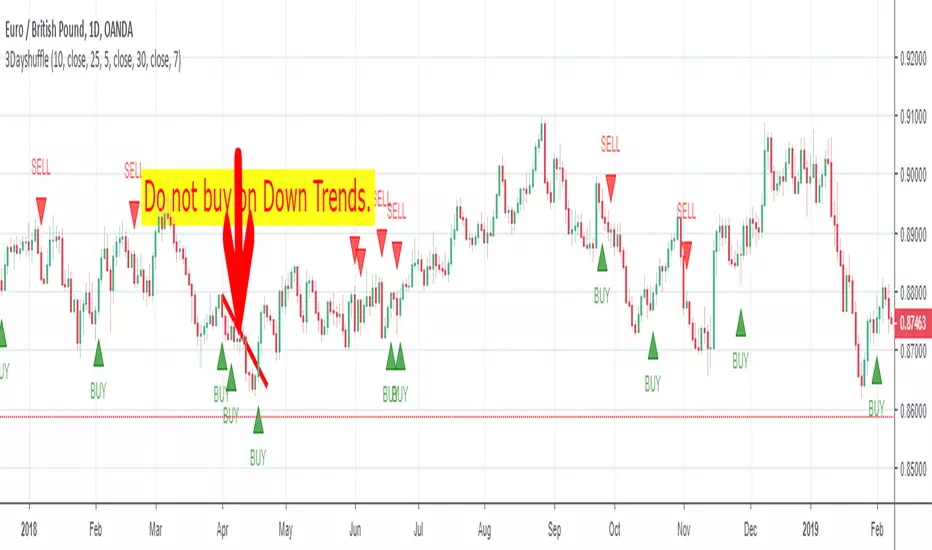
3DayshuffleThe 3 Day Shuffle Indicator indicates the best time to buy and sell based on a secret sauce. This is an Indicator not a strategy. Quick tip, keep the profits small(30-40pips) or Trail Stop it and keep the SL around 30-50 pips. Any comments Appreciated!
Any Tips are appreciated!
Bitcoin: 3M8cMjWXCbMBRbgMPS95wZGDZXXecL5q9v
Litecoin: MWd2E3T2BwZrPbS3DdYx2vvuapwoPQmvFo

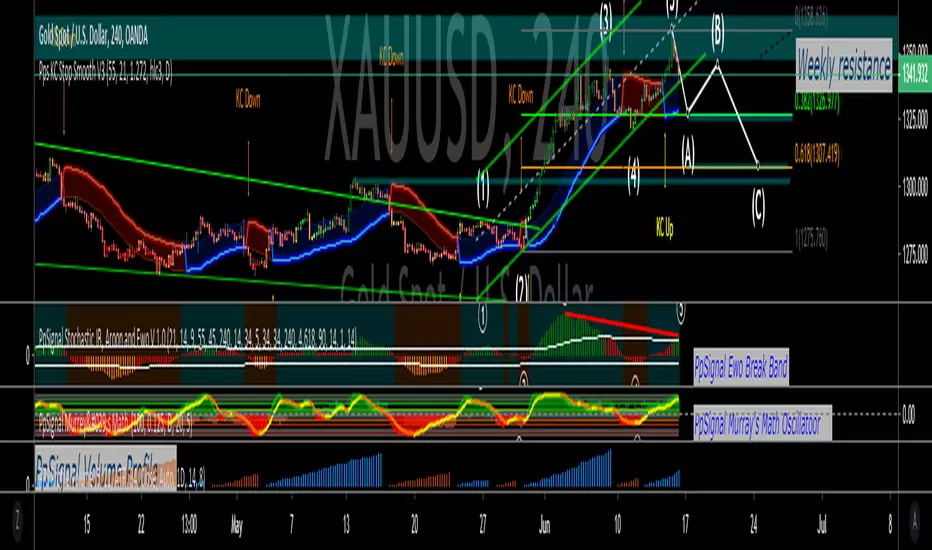
PpSignal KC Band Stop SmoothKeltner Channels 9KC) are a popular technical indicator that traders use to help assess the current trend, spot potential reversals and provide trade signals. The channels use volatility and average prices to plot upper and lower lines, as well as a middle (or average) line. All three of these lines move with the price, creating a channel-like appearance. Day traders can create multiple strategies using Keltner Channels; some of those strategies and uses are discussed below.
Please read this article which is very interesting for the use of KC
www.thebalance.com
We have soft the KC, we also added PpSignal CFB and PpSignal Nuke, to closely follow the short trend.
Another remarkable point we have added the PerPro to look for long-term trend.
enjoy
Heikin Ashi MTFHikin Ashi MTF
The Heikin-Ashi technique – meaning "average bar" in Japanese – can be used in conjunction with candlestick charts to spot trends and to predict future prices. ... Heikin-Ashi charts can also be used to keep traders in trades while a trend persists but get them out when the trend pauses or reverses.

PpSignal ATR MA Band V2We present the new atrMA V2, we have improved the volatility and escape bands to take better advantage of trading.
Buy when price rises from upprband
sell when price below lower band.
Combine it with an ema of 200.

PpSignal ATR MA BandPpsignal Atr Move Average Band is my self development.
Trading:
- Buy when the price break out the upper band and W% is green.
- Sell when the price break out the lower band and W% is orange.

PpSignal Acceleration BandsAcceleration Bands
Description:
Adaptive bands that contain 95% of price action usually used in 20 or 80 bar periods. Trading signals occur when price action is confirmed outside the bands.
This indicator targets the top 5% of moves, keeping traders focused on the best trends.
The 20 Bar Acceleration Band Expert Advisor (SPX chart below) shows buy and sell signals based on my system. Notice
hat in the 14 months shown, the &P500 only exposed a signal 4 times, each was profitable. This depicts the 5% theory sell - Acceleration Bands highlight only the extreme moves for option traders. The issue many traders face is really two-fold; many traders want more signals and the entry point can use some refinement. Like the Yin & Yang relationship, I've developed a system that combines Acceleration bands with Williams' Percent R% to remove any weaknesses and refine trading signals. Let's take a look at how it works.
Willams' %R with two separate systems based on breakout and retest (lower risk entries) methods. We have smoothed out and modified Williams' Percent R to make it a better and more usable trading vehicle.
Description: Larry Williams created the Percent Range oscillator to highlight overbought versus oversold levels in securities. Traditionally overbought connotates a long exit or sell short entry as oversold would insinuate the opposite, however, we in general consider overbought to be bullish and oversold to be bearish. The Big Trends Percent R system targets the top 20th percentile and bottom 20th percentile.
Signal
Buy when the price breaks the upperline and W5 overblows.
Sell when the price breaks the lower band and W5 oversold
www.bigtrends.com

PpSignal Williams %R SmoothWe have smoothed out and modified Williams' Percent R to make it a better and more usable trading vehicle.
in blu you can see the smooth w%, yellow normal w%.


PPSignal PROBABILITY FIBONACCI ZONE ANALYSIS V2The ROBERT KRAUSZ'S HIGH PROBABILITY FIBONACCI ZONE ANALYSIS™ Indicator
(www.academia.edu)
www.fibonaccitrader.com
[ b]Setting
TF=Time Frame
If you are in:
From 1H to 1 W:
- TF 1W: set in 6M | 12M (best)
- TF 1D : set in 1M
- TF 1H : set in 1440 ( 24H)
F or 5 minutes
Forex
- TF 5: set in 720 (=12H)
Futures (es, sp, cl, etc.
-TF 5: set in 1D

PerPro V3 We have agreed PerPro Strategy and PerPro Indicator.
Remember to use other indicators, oscillators, fibonacci levels, support, resistances, etc. to confirm entries. THIS IS NOT THE HOLY GRAIL .
We adde EMA 64 /200 and Ppsignal Nuke too.
Recommendations.
Forex:
- Graphics 5 minutes TF 60 to 240
- Graphics 60 Minutes D
- Graphics 240 D or W.
Stock
-Graphics 5 minutes Tf 120 to D
-Graphics 1 H TF D or W
-Graphics 1D W Or M
You can look for the best combination. Remember that stocks or currencies do not all move the same.

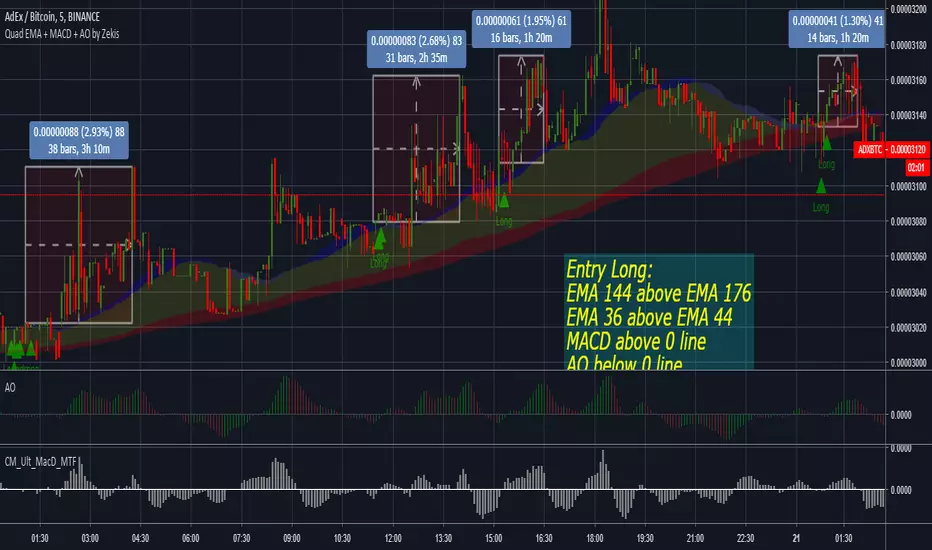
Quadruple EMA + MACD + Awesome Oscillator by ZekisThis strategy is based on quadruple EMAs, MACD and Awesome Oscillator, developed by Nenad Kerkez and simplified by me.
Scalping strategy (lower time frames)
Entry Position
Before we take a buy trade the two above criteria must be met. The 144 EMA must be above the 176 EMA and the 36 EMA must be above the 44 EMA. We then wait for AO to fall below the 0. The final „trigger‟ to the entry is when the MACD closes above the 0 line.
Sell trade is vice versa. 36 EMA must be below 44 EMA and 144 EMA must be below 176 EMA.
TAKE PROFIT and STOP LOSS
10-40 pips. Pivot Point targets.
STOP LOSS above/below last highest high
Enjoy!
@Zekis
PerPro IndicatorThis is the version PerPro Strategy but in indicator, in this version you can configuration 1 minutes or 5 minutes time with 60 multi time frame set...
Try with your self what is the best configuration for you trading.