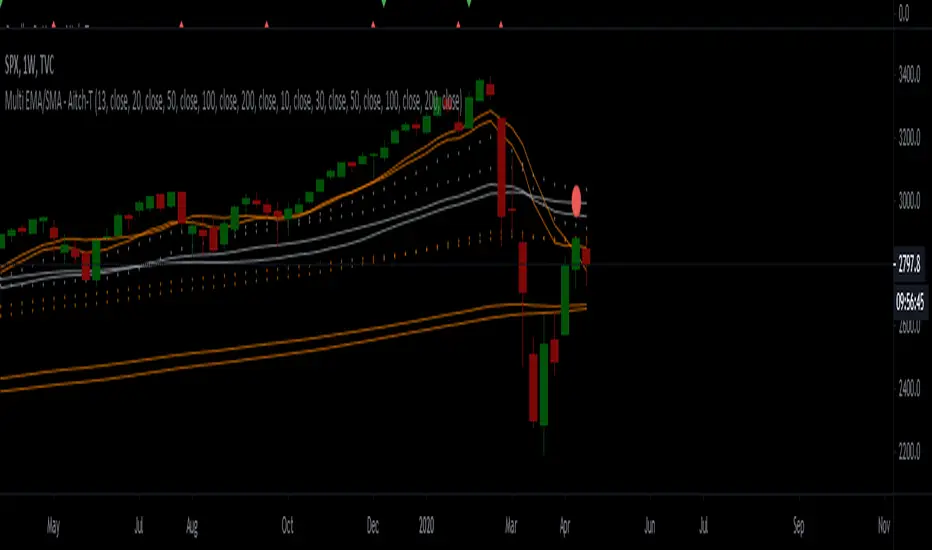
Multi-EMA | 5 EMAs in 1 ScriptAdd up to 5 EMAs to your charts with this script.
Fully Customizable.
----------------------------------------
Wanna try my other scripts?
Histogram with Divergence Finder:
Willams %R with 13 EMA and Divergence Finder:
More scripts here:
www.tradingview.com
M-forex
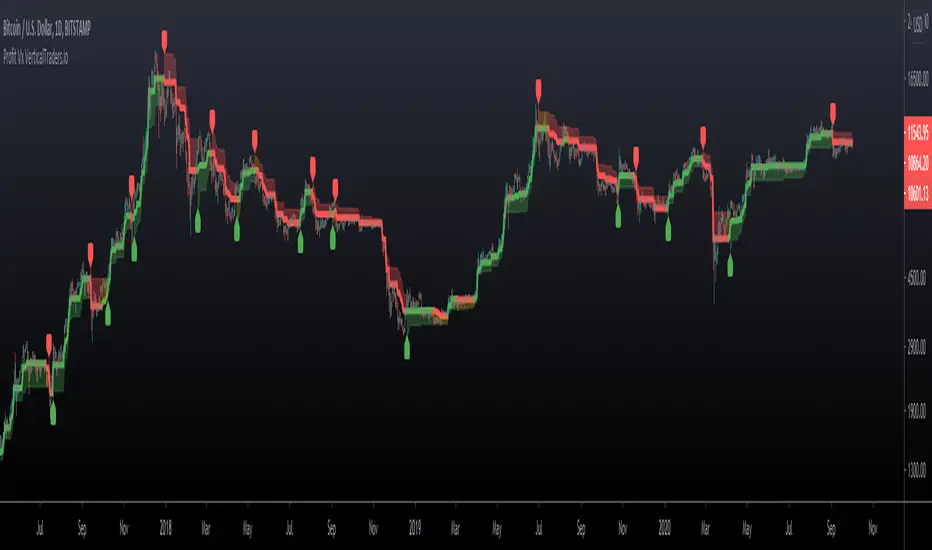
Profit VxProfit Vx
- Labels for Long and Short entries
- Take Profit point base on %
- Candlestick color, orange is warning or not trending zone
Run.Trader by Boris SchlossbergThis is a short term scalping indicator from BK Forex that buys retraces in an uptrend and sells rallies in a downtrend at oversold/overbought points using 1 hour or 15-minute timeframes.
It can be traded on all the majors including EURUSD GBPUSD and USDJPY using 10 points take-profit targets and it can be traded on higher volatility pairs such as GBPJPY and EURNZD with wider stops and about 20 pip targets. By making the entry process highly visual this script makes timing the day trades much easier.

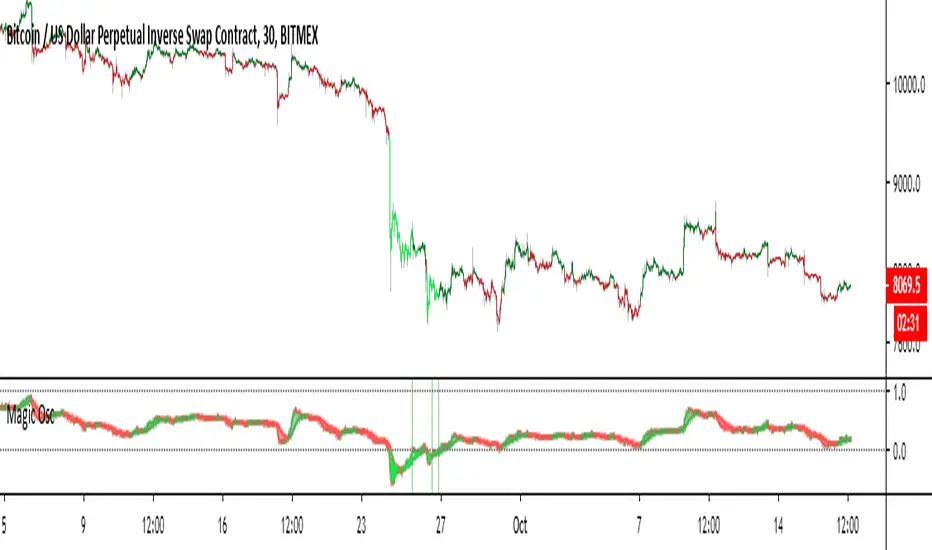
Magical Onion Oscillator V1This script is a oscillator that has many features. It is designed to give infrequent but super high quality signals. The basic concept is that when the fast line goes over 1, price is overbought, and when the fast line dips below 0, price is oversold. This is reflected by both the fill color on the oscillator, and by coloring the bars. When the area between the two lines is green, the trend is up, and when the fill color is red, the trend is down. The trend feature is not the primary use for this oscillator, the overbought/oversold signals are much more powerful.
Signals
When the bars are colored bright red or green, that means the price is overbought/oversold.
When the fill color is green, the trend is up. When the fill color is red, the trend is down.
Entry signals are given by the vertical green or red stripes in the oscillator window.
Settings
Timeframes 1-4 These settings are to change the time frames the oscillator uses to do calculations. The defaults should work fine for most time frames, but I allow you to modify these for extremely small or large timeframes. The input needs to be a multiplied minute, day, week, or month. For example if you would like to use this on the 1min chart, a possible setup could be 60,240,720,D. This would correspond to 1hr, 4hr, 12hr, D. If you wanted to use it on a larger timeframe like the daily, you could use M,2M,3M,4M. Which would mean 1,2,3,4 months. The default timeframes are very good for the charts in the range of 30min to 4hr.
Fast Length This is the smoothing factor for the fast line. The default is recommended, but you are free to customize as needed. Note that a higher value here will decrease the amount of signals.
Slow Length This is the smoothing factor for the slow length. It will work similarly to the short length, smaller values will increase signal frequency, but also make the trend signal choppier.
Adjustment Lag Turning this value down will cause the indicator to remain oversold and overbought for shorter periods. This will decrease the amount of signals. Turning it up will have the opposite effect.
Color Bars Toggling this turns on and off the bar coloring.
Color Lines According to Trend Toggling this option colors the oscillator lines according to the trend direction.
Please send me a message or leave a comment if you have any questions, good luck.
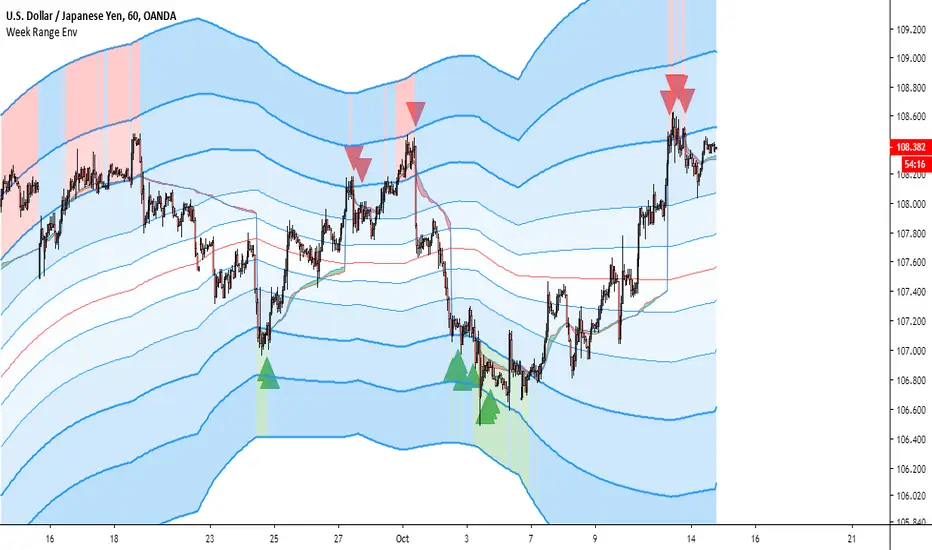
Dynamic Weekly Price Envelope
This is a indicator that I have been developing and personally using for over a year. The basic concept is a dynamic range that is derived from the previous weeks range. The main philosophy followed when designing this indicator was that it should be applicable to all asset classes, and it should provide objective price levels of support and resistance that do not change when price approaches them. This indicator is most useful in range bound price action, but gives a lot of useful information on any market condition at a glance. The indicator also generates a custom vwap that reflects the volume weighted price since the price broke significant levels.
Indicator Description
The indicators most important price levels are the top 3 lines and the bottom 3 lines. These lines are distinguished by their wider line thickness with default settings. These levels act as support and resistance, and the price entering these regions indicates that the asset is overbought or oversold. A setting is available to highlight in red or green when price is overbought or oversold. Here is an example:
This example also demonstrates one of my personal favorite signals, which is when the price reenters the central channel, then retests the overbought/oversold region, as it does in the example, shown by the second set of red arrows.
Timeframes
This indicator reacts dynamically, so the levels will look different on different timeframes. The hourly chart works best from my experience in forex and crypto with default settings, but in general lower timeframes will give a more accurate picture during extreme price action. Note: assets that have shorter sessions generally should use a smaller timeframe. I like to use 15min on stocks, this is similar to the hour chart in crypto or forex. Take this GBPUSD chart for example:
As you can see the price has a very extreme impulse, and all resistances are passed. You can see that the lines still act as support when price falls back into the range, but the indicator is not very useful when price exits the range. The solution for this is to drop down to a lower timeframe that will adjust faster to the extreme price movement.
Here you can see that the range shifts with the price movement, indicating support levels throughout the entire price impulse.
I will also drop down to lower timeframes if I want to utilize the price levels within the channel as support and resistance levels for intraday trading. Here is an example with price level interactions indicated by red and green arrows.
THe most significant levels are still the centerline and the top and bottom three levels, but the inner lines also are nice for intraday support and resistance.
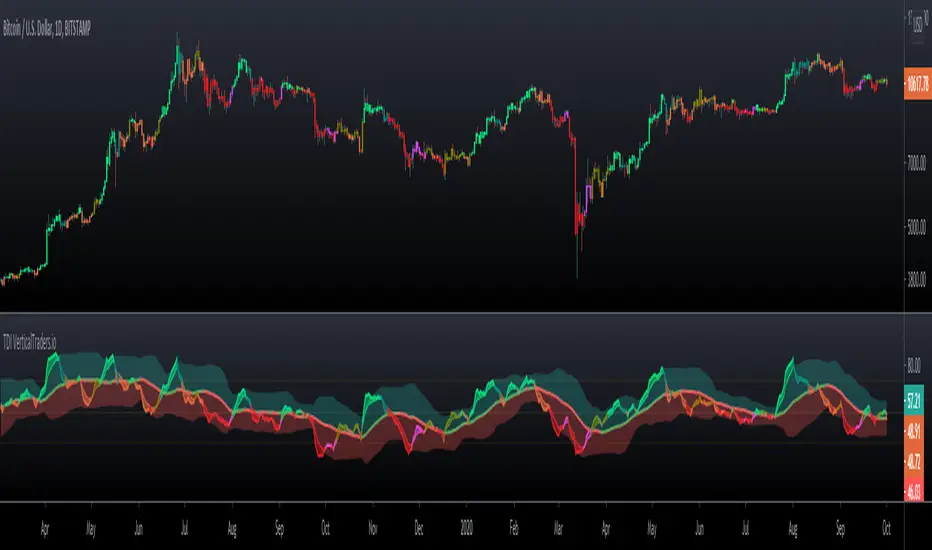
Larger time frames like the daily chart also are useful. Let's take the daily Bitcoin chart as an example:
On larger timeframes,
If price is below the central red line price is trending down, and if price is above central red line, the trend is up
The asset trading outside of the entire range indicates that the trend is very strong, reentry into the channel indicates that price is likely to consolidate.
The outer lines still serve as significant support and resistance.
Settings
I have configured the default settings to perform well for most assets, but I allow the user to change settings as they desire.
Line Color - this setting changes the color of the lines.
Fill Color - this setting changes the fill color used for the indicator
Line Transparency - The transparency of the lines, set to 100 to completely hide all lines
Base Fill Transparency - This setting changes the base transparency for the channel, this transparency will be used for the outermost bands
Transparency Gradient Step - each band will become this amount more transparent as they come closer to the centerline
Adjustment Lag - this adjusts how quickly the channel adjusts when the top and bottom levels are breached. I have always used 100, but using much higher or lower values gives interesting results.
Show Signals - This enables basic swing signals to be shown by red and green triangles. Note that this is only one signal, and the system actually has many signals outside of these triangles. They only indicate optimal entries for a swing trading technique based on the indicator.
Show Oversold/Overbought Price - ticking this box results in the fill color changing to green when price is oversold, and red when the price is overbought.
That about covers all the basics for using this indicator, please reach out with comments or messages if you would like to know anything more. Thanks for reading, and I hope you can use this tool to help your analysis. A monthly version and a refined strategy are in the works and will be published soon.
TDITDI
- Calculate strength and market direction by analyzing relative strength
- Ribbon mode, according to the TDI conditions
- Candlestick same as TDI Ribbon colors
- 6 colors to define market strength
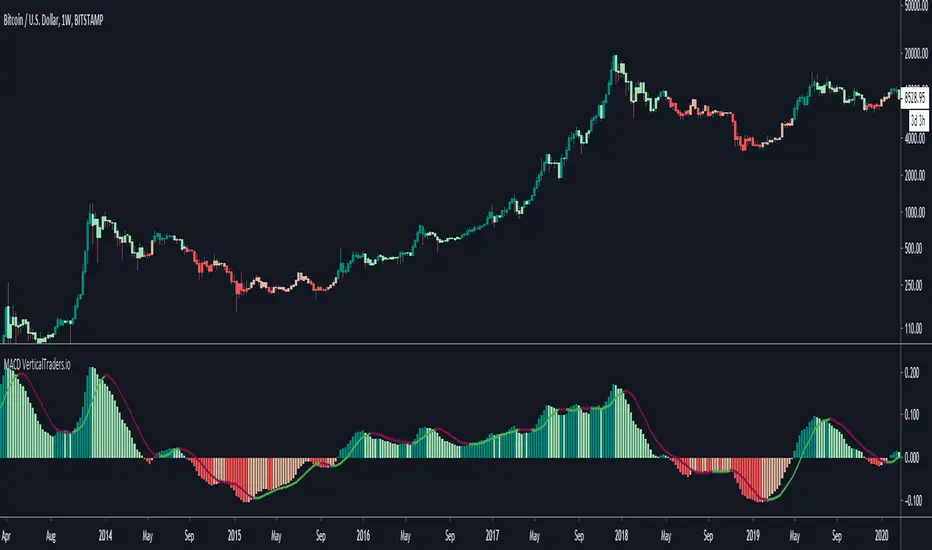
MACDMACD
- Enhanced MACD
- Shows the MACD in a simple way, to facilitate its analysis
- Histogram mode and Normal mode
- MACD color depends on its values
- Candlestick same as MACD colors
- Calculate the MACD with EMA or SMA
- Allow to use the RSI Source for calculations
- Log chart option
Pro Ribbon Multi MAPro Ribbon Multi MA
- A simple way to see the movements of several MA
- Ribbon of many types of MA: sma , ema , dema , smma , hull, etc
- Trend Color
- Custom Period of 10 MA

HL ChannelHL Channel
- The channel shows the trend based on highs and lows, and possible points of take profit and exists
- Trend Indicator for Long and Short entries
- It can be used as a trend indicator or as a trailing stop loss
- Long and Short Labels and Alerts
- Configurable in Periods and Simple Mode
Simple Mode:

Simple TrendSimple Trend
- Show levels to continue on Trend
- Trend Indicator for Long and Short entries
- It can be used as a trend indicator or as a trailing stop loss
- Long and Short Labels and Alerts
- Configurable in Periods and the type of MA for the calculation

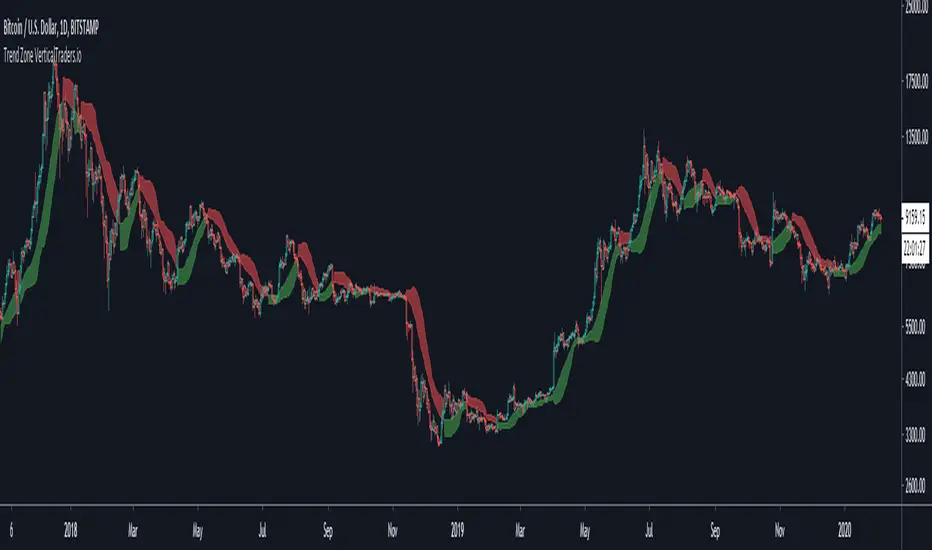
Trend ZoneTrend Zone
- Shows the risk areas to continue in a trend
- Trend Indicator for Long and Short entries
- It can be used as a trend indicator or as a trailing stop loss
- Long and Short Labels and Alerts
- Configurable in Periods and the type of MA for the calculation
Trend ProTrend Pro
- Trend Indicator for Long and Short entries
- It can be used as a trend indicator or as a trailing stop loss
- Long and Short Labels and Alerts
- Configurable in volatility values and periods

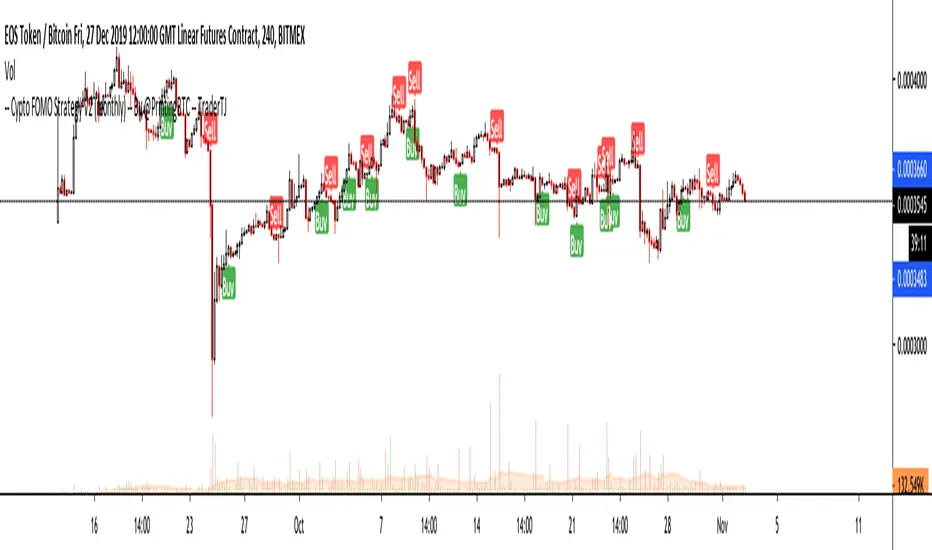
Crypto FOMO Strategy (monthly-access)PLEASE READ THE ENTIRE POST BEFORE PURCHASING & USING THE FOMO INDICATOR. Saves you and me some time in emails and messages. :)
This is the NEW MONTHLY ACCESS Version of the Crypto FOMO Strategy
Please check the links at the bottom of this post, so you find the way to our shop.
1 Month access is set at $25
10% Disount --> "FOMO25"
Any question, DM me here or on Twitter , check for link on the bottom.
The FOMO Buy Sell Indicator is a very specific strategy, cut down to its roots and made perfect for the volatile crypto market.
Many indicators focus only on one aspect, one side, one specific rule. As you know, this is not how life, the market or anything else works.
FOMO combines many different aspects at the same time, scans multiple other indicators and comes to a conclusion based on over 950 lines of code.
It is based on Divergences, Elliott Waves , Ichimoku , MACD , MACD Histogram, RSI , Stoch , CCI , Momentum, OBV, DIOSC, VWMACD, CMF and multiple EMAs.
Every single aspect is weighted into the decision before giving out an indication.
Most buy/sell indicators FAIL because they try to apply the same strategy to every single chart, which
are as individual as humans.
To conquer this problem, FOMO has a wide range of settings and variables which can be easily
modified.
To make it a true strategy, FOMO has as well settings for Take Profit Points, Multiple Entries and Stop Losses. Everything with an Alert Feature of course.
I know from experience that many people take one indicator and are simply too LAZY to add multiple indicators to make a rational choice.
The result of that is that they lose money, by following blatantly only one indicator.
FOMO has additional 7 indicators, perfect for the crypto market, which can be turned on and off.
FOMO Signals Settings
“Show Signals?” - On/Off to show the Buy/Sell Signals. “Aggressiveness” - Increase to make the signals less aggressive
and decrease to make them more aggressive.
“Show Custom FOMO Timeframe?” - On/Off to show FOMO Signals of a different timeframe in addition to the normal ones.
“Custom FOMO Timeframe?” - Choose the timeframe for the custom FOMO signals.
“Use Safe FOMO?” - On/Off to show only “safe” (less but more exact) FOMO signals.
“Safe FOMO Sells” - Settings for the “safe” FOMO Sell Signals. Decrease number for “less safe” Signals.
Increase number for “more safe” Signals.
“Safe FOMO Buys” - Settings for the “safe” FOMO Buy Signals. Decrease number for “more safe” Signals.
Increase number for “less safe” Signals.
FOMO Strategy Settings
“Take Profit 1 ” - On/Off to show TP1 points.
“Take Profit After %” - Set the percentage after which TP1 is
active.
“Take Profit 2 ” - On/Off to show TP2 points.
“Take Profit 2 After %” - Set the percentage after which TP2 is active.
“Take Profit 3 ” - On/Off to show TP3 points.
“Take Profit 3 After %” - Set the percentage after which TP3 is
active.
“Second Entry” - On/Off to show Second Entry points.
“Second Entry After %” - Set the percentage after which Second Entry is active.
“Third Entry ” - On/Off to Third Entry points.
“Third Entry After %” - Set the percentage after which Third
Entry is active.
“Stop Loss ” - On/Off to show Stop Loss points.
“Take Profit After %” - Set the percentage after which Stop Loss is active.
The FOMO Lifeguard is a special feature made to cancel out the “noice” of the signals and show only signals with a great technical significance.
For this FOMO uses the default settings of +7 and - 7. This references to an index value of multiple settings of almost all indicators used in this script.
+7 cuts out all sell signals below the index value of 7.
- 7 cuts out all buy signals above the index value of - 7.
Using the FOMO Lifeguard is a key element for a sustainable and profitable strategy.
As the normal FOMO Signals, the Lifeguard Signals are also bound to the “Aggressiveness”. Should the cut out of signals with the Lifeguard on be too big, try adjusting the “Aggressiveness”.
With this, once can choose and make this indicator PERFECT for his own strategy and trading style. Day Traders would use no “Lifeguard” and aggressive signals.
Swing Traders would use “Lifeguard” and aggressive signals.
To make the life of the FOMO user even easier, I have added all adjustable Take Profit Points, Multiple entry points and Stop Loss points.
Simply choose how many Take Profit points you would like to have and choose the percentage after which you would like to see the Take Profit point appear on the chart and notify you to take profits.
Are you a Trader who likes multiple entries? Also no problem with FOMO. Select how many additional entries you would like to have and after how many percent you would like them to appear on the chart and remind you of adding to the position.
What would a Strategy be without a Stop Loss? Same settings apply here as on the TPs and MEs .
Crypto Modified Indicators
“Show Divergences?” - On/Off to show Divergences on the Chart based on the data of 10 different indicators.
“Show Custom Divergences?” - On/Off to show Divergences on the chart of a custom timeframe.
“Custom Divergence Timeframe?” - Choose the Timeframe for which the Custom Divergences should appear on the chart.
“Show Oversold/bought?” - On/Off to change the colour of the chart in Oversold/bought conditions.
“Oversold/bought value?” - Choose a value for which the chart is Oversold/bought.
“Show Fibonacci Levels?” - On/Off to show automatic Fibonacci Levels.
“Fibonacci Lookback Lenght” - This value states how many candles from right now are taken into account to paint the Fibonacci Levels.
“Fibonacci Lookback Lenght” - Choose a custom Timeframe that should be used to paint the Fibonacci Levels.
Crypto Modified Indicators 2
“Show EMAs?” - On/Off to show three EMAs on the chart, after the example of @Teddycleps
“EMA Lenght 1” - Choose a value for the first EMA Lenght
“EMA Lenght 2 ” - Choose a value for the second EMA Lenght.
“EMA Lenght 3” - Choose a value for the third EMA Lenght.
The area between the first and third EMA is filled. Is EMA1 above 21, it’s filled green. Is it below, it’s filled red.
“Show Ichimoku? ” - On/Off to show Ichimoku on the chart.
“Show Tenkin?” - On/Off to show Tenkin on the chart.
“Tenkin” - Set the lenght of the Tenkin.
“Show Kijun?” - On/Off to show Kijun on the chart.
“Kijun” - Set the lenght of the Kijun.
“Show Senkou?” - On/Off to show the Senkou on the chart. “Senkou” - Set the lenght of the Senkou.
“Displacement” - Set the value of the Displacement.
“Show ZIG ZAG Lines?” - On/Off to show ZigZag Lines on the chart, used to identify short-term trends and EW counts.
“ZZ Lenght 1” - Set the first lenght of the ZigZag Lines.
“ZZ Lenght 2” - Set the second lenght of the ZigZag Lines.
FOMO without any doubt has Custom Alerts for all Signals that it is painting on the chart. This goes for the “Normal Signals” as well as for the “Lifeguard Signals”.
One can even choose to receive custom notifications for Take Profit points, Multiple Entry points and the Stop Loss points.
The signals appear on the chart DURING the candle, not at the end of the candle. Therefore, the alerts do this as well. These appear during the candle.
Here we can see all of the possible Alerts that can be chosen to be displayed. In total it is 30 different custom alerts, based on what the trader is looking for and how he is trading.
Personally, I have 10-15 coins that I trade the most and for these I have custom notifications, mostly though only the SAFE FOMO Buy and Sell Signals.
To activate Alerts for FOMO
1) Go to the “ALERT” icon on the top tool bar of your Tradingview.
2) Select “CONDITION” as “—Crypto FOMO Strategy—“
3) Then choose ONE condition from the list of conditions.
4) On “OPTIONS” you can set how many times it appears, I have “Once per Bar”.
4.1) If you want to make sure that the signal is truly there and not just a condition for a second during the candle, choose “ONCE PER BAR CLOSE”.
5) “Expiration Time” sets the time until the alert expires. PRO users have no expiration for alerts.
6) “Alert Actions” give you a row of choices what happens and how you want to be notified.
7) “Message” is the message that you receive inside the notification.
AFTERWORD/DISCLAIMER
FOMO has been created after my goal to #MakeCryptoProfessionalAgain. Every aspect of it has its own and very specific use, which traders have shown to find useful in their trading.
This Indicator is meant to help new and experienced traders to understand the various aspects of this market and access all of the most important and most commonly used tools, with JUST ONE CLICK.
FOMO should be used responsibly and treated as an indicator. Signals, scripts, algorithms can NEVER be 100% exact. It is up to the trader to make a well thought and educated decision, wether to follow a signal or not. Our brains are way more advanced than any indicator and algorithm.
I advise especially for this reason to have not just the signals turned on. Please do not use the SAME settings for each chart. Look which Aggressiveness and Lifeguard Settings fit your chart the most, you will be amazed how well some charts work with FOMO.
FOMO should NOT make you FOMO into a trade anymore. It should teach you to make more educated decisions and especially for margin trading reduce the risk of liquidation.
Should you have problems with being liquidated multiple times, I advise to use the “STOP LOSS” function.
Most importantly, enjoy the indicator and trading in general.
Session P4L SNIPERSsession separator only for the operation of the academy. by its time margin. added the asian range for a power of three

DAY separator P4L FOREX
day separator for better orientation of neutralizations in the graph. with the possibility of choosing day and color to show in the graph

Extreme ScalpingThis is a test of an easy scalping method: buy if actual close is below forecast close and sell if actual close is above forecast close. Take profit and stop loss shall be very small (few pips) as in most of scalping strategies.
No filter is used for only long or only short positions, but you can select buy only or sell only based on other indicators or whatever you feel is the direction of trading.
NOTE: you can add this strategy to your chart but you should modify the backtest day otherwise you will get an error due to calculation limits of pine script. For example, on one minute chart, you should set the backtest day from today only. For past days, set both start day and and day.
I have also a study with alarms.
Please use comment section for any feedback.

InfoPanel Divergence IndicatorThis panel spots divergences of some well knonw indicators. It may be usefull because you have all indicators in one panel only.
Also, you can check on chart which indicator gives better results of each pair on stock or index or crypto.
TO DO: to add custom indicators.
thanks to: RicardoSantos for his script of panel coding
Tradingview scripts
Other members of TV community (I cannot remember the source and inspiration of all snipets)
Please use comment section for any feedback.

Strategy based on the principles of Price ActionIt is considered the percentage of candles with low and high closure for a certain period. Then, a moving average is built from these values. When the moving average of the ratio of tall candles to low candles is greater than the ratio of low candles to high, then long (that is, when the green line crosses the red). And vice versa - a condition for short. It also works on crypto with other settings. Idea for improvement: you can make partial exit by taking, at certain profit levels, the chart will be more stable. Result with a commission of 0.004% You can create an optimizer, and use this strategy on any liquid asset. (Sorry for google translator)

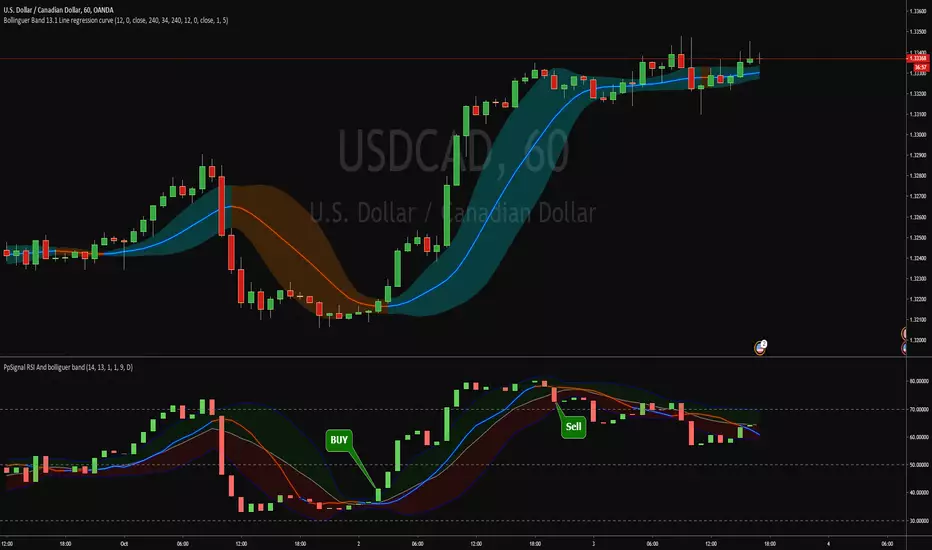
PpSignal RSI and bollinguer bandRSI bollinguer band oscillator, buy when the Ma is blue and the rsi is on the upper band and sell when de ma is red and rsi is cross down the lower band..
Windmill ForexWindmill strat tuned for Forex
Buy and sell postions shown along with signals that are rejected


trend_ultimateCan be used in any market , preferably 15 min. timeframe , take every signal and it will generate positive returns .
Note ** : Use it with anything which has daily standerd deviation gtreater than 2 for more positive result.
