Nuvem de Ichimoku


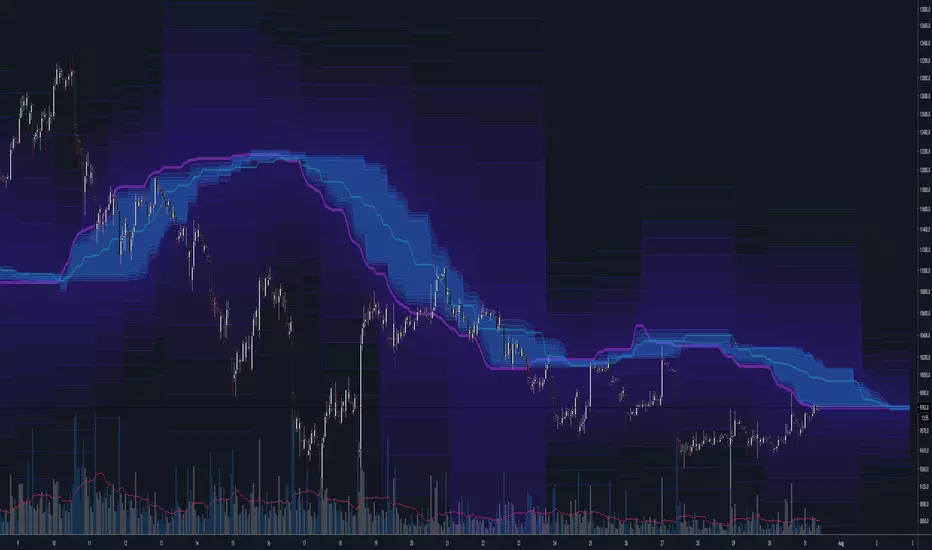
Filtered Waves [NXT2017] #Linda Raschke #basics on Arthur MerrilHI BIG PLAYERS,
this script I wrote for an enquiry of a tradingview-user. It should represent the Filtered Waves idea from Arthur Merril and used by Linda Raschke.
It's similar like a visualization of Elliott Waves.
On YouTube title "MTA UK Chapter Presentation with Linda Raschke" between 34-36 minutes Linda Raschke shows the rules for her Filterd Waves.
Any questions? Ask me!
King regards
NXT2017
========
TO MY PERSON
I'm the second winner of the official German Forex Trading Competition in 2018.
Look here to the ranks:
deutsche-trading-meisterschaften.de
I speak german, english and russian.
My strength in trading are Wolfe Wave pattern.

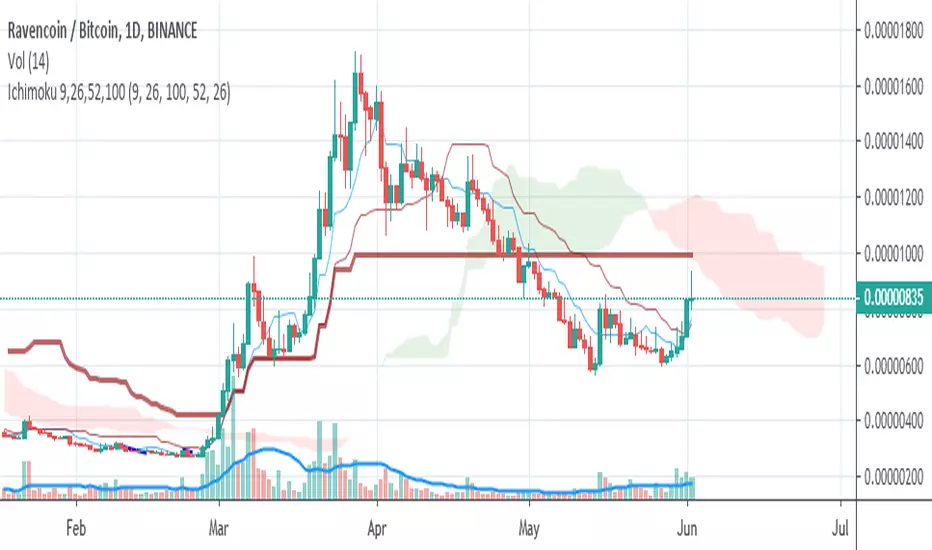
Ichimoku Cross Indicator [Mehdihz]This script shows tenken & kijen lines position to better detection of crosses.

Ichimoku Cloud setup OualidIchimoku Cloud setup Oualid
plus sûr dans les trades
Mieux addapté non agressif

The Rumpy CloudSimilar basic principle to Ichimoku cloud, more sophisticated implementation.
I've exposed cloud width multipliers in the setting in case anyone wants to experiment with them, there are likely to be other widths of significance.
Lots of lines so settings includes easy batch way of altering color settings.
--------------------------------------
If you find it useful please consider a tip/donation :
BTC - 3BMEXEDyWJ58eXUEALYPadbn1wwWKmf6sA
--------------------------------------
Tenkan Kijun Cross AlertTenkan Kijun cross alert, best used alongside a Volume indicator to help aid with finding those trend continuation patterns.
I prefer to use the Chaikin Money Flow, when it indicates and holds above the 0 line then you will bias Longs, and when below then you will Bias shorts
If you like this then please donate
BTC: 1LRbUgrkvFLQ5Mt7C62EJRD9aMvhDNT22K
ETH: 0xa509b89bccb788234278eFE63470c10946E26F3c
LTC: LV7MUr6arvCffS5N6pbTWgav5S3Yi1Eejp

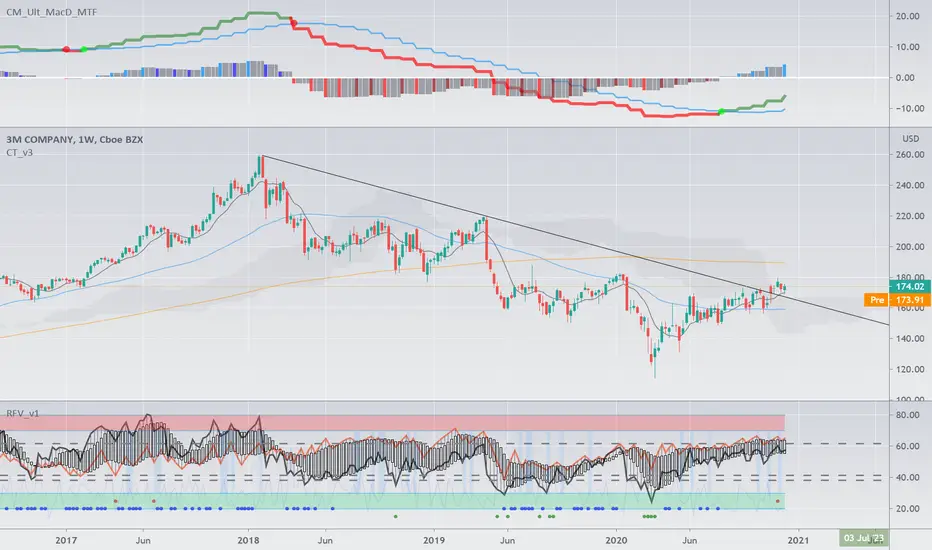
Skipz multi-indicatorMaking my own indicator pack based on several indicators used by my mentors.
Would love feedback

Bollinger bands/Lagging span crossHello my dear ambitious traders
I'm working hard this week to publish some great indicators this week and open sourced. Hope you'll enjoy, learn and use them.
This will be my greatest reward but comments showing appreciation are also very welcomed (actually likes too) :)
For today, I'll share a simple indicator but it's coming along with some insightful knowledge ^^
Anyway, I'm not here to ask you to this but to share a very cool indicator I made a few months ago and wanted to share for FREE with the community today
The indicator is related to this educational post : What-a-Bollinger-Bands-Lagging-span-cross-can-tell-us/
This trading technique was invented by Robbytrade, a famous french trader twitter.com
I wanted to have those visual signals on the chart so I coded it.
The advantage of being a developer is that you can litteraly code what you miss and get your life better in the process. The one that will find a way to code a new form of money will be rich... wait.... that guy is called Satoshi Nakamoto...
That's all for me today my friends
PS
Trying to update the Trade Manager shared yesterday with some cool features. More to come in the upcoming days
Enjoy
Dave

Volume Weighted Ichimoku (Cleaned Up Visuals)Ichimoku with cleaned up appearance on chart and volume-weighted highs / lows. Publishing this final version with open script.

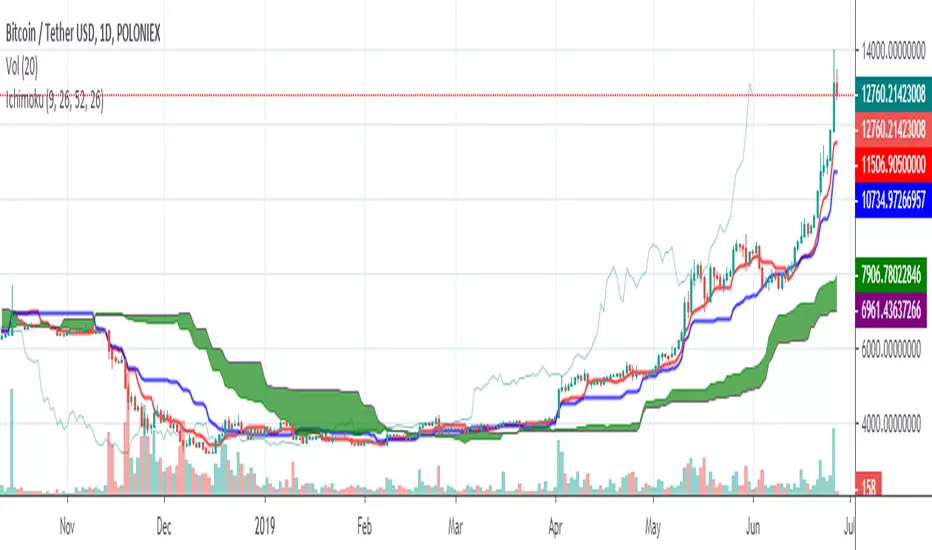
Kijun-sen Colored [aamonkey]I isolated the Kijun-sen from the Ichimoku Cloud and colored it.
You can do major damage by just entering when the price closes above the Kijun-sen and sell when it is the other way around.
Add some other confirmation indicators to filter some false breakouts and you are good to go.

Ichimoku Double Cloud + AutoFibCombined indicator using an ichimoku double cloud derivative.
Ideal use is option swings, using traditional ichimoku rules, targets are adjusted to the current ATR.
Appropriate strikes closest to one of these lines for assisted price targeting.
Ichimoku JrTenkan Jaune suis le prix
Kijun Orange effet elastique
Chikou ici est maintenant projeter dans le passe
SSA moyenne de tenkan et kijun projeter dans le futur
SSB moyenne des 52 dernieres bougie projeter dans le futur

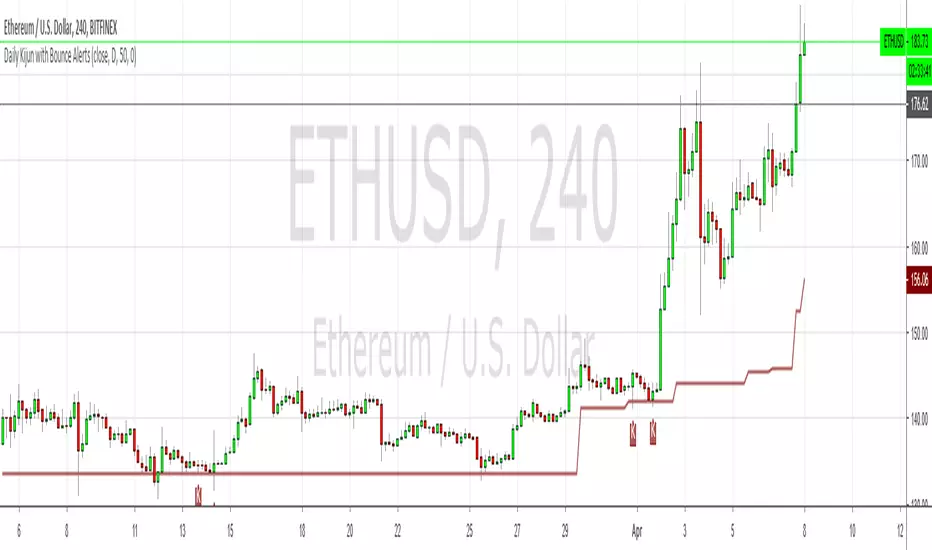
Daily Kijun with Bounce AlertsShows the daily Kijun on all timeframes using a period of 50, which makes it into a dynamic 50% fib of sorts, especially when it's flat. Also shows Kijun bounces labeled with Ks, and allows you to set alerts for bullish, bearish or bi-directional bounces.
It doesn't show any of the other Ichimoku components.
(YEK) Combo(YEK) Combo is a combination of several indicators (listed below). You can use them together or one by one. Just click settings, and choose which of them to be shown.
Here are the indicators included in this script:
- Ichimoku Cloud
- Bollinger Bands
- Moving Average 1
- Moving Average 2 (In case of detecting golden crosses or death crosses)
- Exponential Moving Average
- T3 Tillson
- MavilimW
Enjoy!

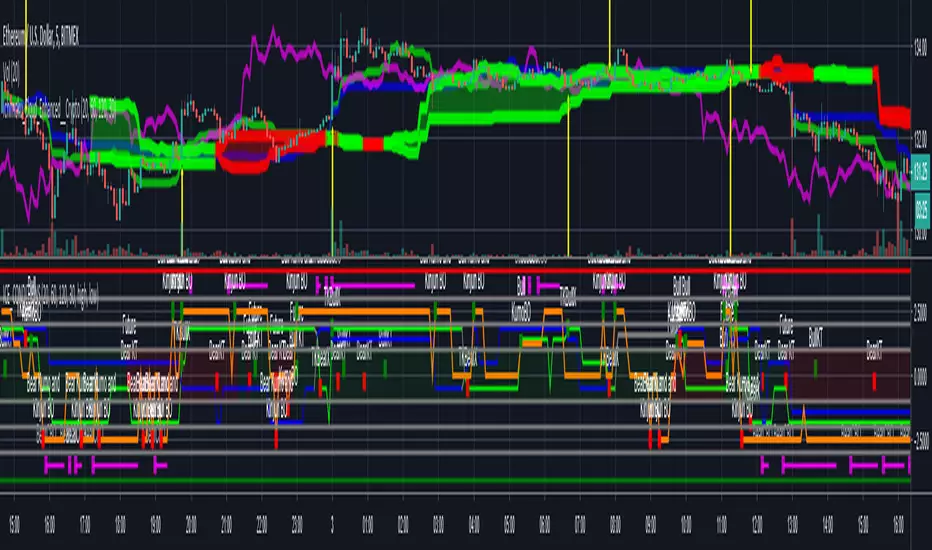
Ichimoku Cloud Enhanced - Conditions IndicatorOriginal Cloud code base from "Ichimoku Cloud Enhanced For Crypto"
Link here
At a glance simplified rendering of ichimoku cloud elements and algorithmic detection of all ichimoku cloud events. Has alert conditions for all/most events you would want.
Central red/green band represents the cloud and the current "future" cloud colour.
Kumo Twists are shown for when they are both below/above the current candle and for when they first appear in the "future" cloud.
Orange line represents close and it's relative position to the cloud and Kinjun.
Tenkan and Kinjun, crosses and relative position to the cloud (blue/green lines). Will show crosses if they occurred above/in/below the cloud etc.
Chikouspan Breakouts (above/below cloud & price action) fuchsia lines.
It should have all the logic required to build a strategy from IC conditions by combining them however you want.
-------------------------------------------------------
If you find it useful please consider a tip/donation to the rumpy liquidation recovery fund : BTC - 3BMEXEDyWJ58eXUEALYPadbn1wwWKmf6sA
Daily, Monthly & Weekly Clouds (use on day chart)This indicator offers Ichimoku clouds for periods 1, 7, and 30. When used on the DAILY chart these correspond to the D, W & M time frames respectively.
The indicator just has the clouds right now because that's all I use. It doesn't have tenken, kijun or anything right now.

Complete Ichimoku Trader *modified*I just found this script from @kingthies here and like it. So i just made some changes and added some little code into it.
Reduced some noise for the signals. Hope anyone can enjoy it. But keep in mind, did not test it on live trading! Had just some time and love to work in pine :)
Original
Happy Trading

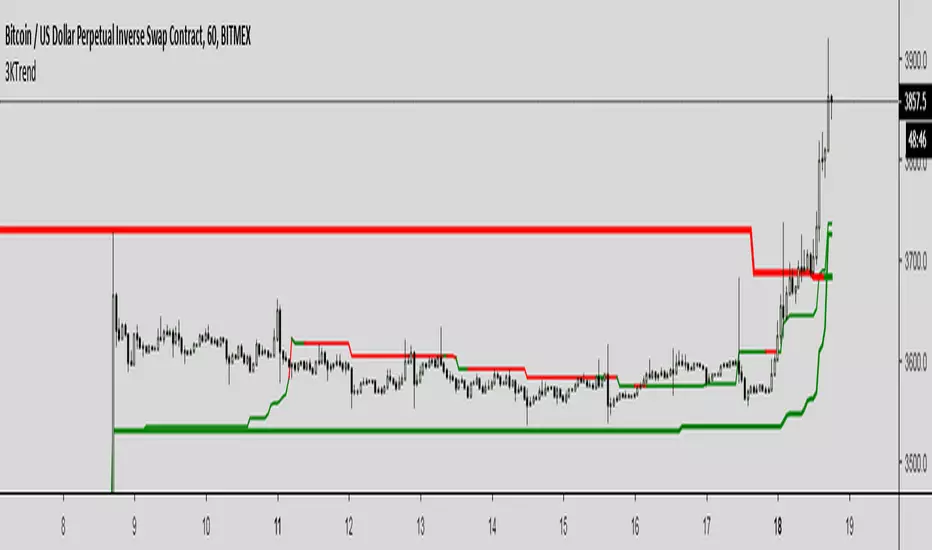
Triple Kijun Trend by SpiralmanIspired from "Oscars Simple Trend Ichimoku Kijun-sen" by CapnOscar
Script displays 3 kijun lines: one for current TF, second one emulates it for TF 4 times higher, third one for x16.
For example on 1H chart there will be 3 kijuns: one for 1H, second one for 4H (emulated), third one for 16H (emulated).
Kijuns change colors based on their position relative to price.
Kijun Sen
The base line, the slower EMA derivative, and a dynamic representation of the mean. With that said, the Kijun serves as both critical support and resistance levels for price. How does it work, and why would the Kijun be superior to commonly used moving average indicators? Fun fact: The Kijun dynamically equalizes itself to be the 50% retracement (or 0.5 Fibonacci level) of price for any given swing, and price will ALWAYS gravitate to the Kijun at some point regardless of how far above or below it is from it. By taking the median of price extremes, the Kijun accounts for volatility that other MAs or EMAs do not. A flat horizontal Kijun means that price extremes have not changed, and that the current trend losing momentum. Crypto-adjusted calculation: (highest high + lowest low) / 2 calculated over the last 60 periods.
[OZ]MTF Ichimoku CloudBased on this script from RicardoSantos:
This script can display Ichimoku cloud , SSA , SSB , Chikou, Kijun and Tenkan from another time frame.
With it you can apply Karen Péloille's MTF Ichimoku Kinko Hyo advanced trading techniques on TradingView.
By default Tenkan is not displayed (fully transparent).
The original script has been enhanced to draw the full cloud beyond the price and to draw the Chikou.
