Double HULL Moving AverageTHIS IS A COMBINATION OF TWO HULL MOVING AVERAGE LINES
-ONE WITH LONGER PERIOD
-OTHER WITH SHORTER PERIOD TO INDICATE BUY/SELL SIGNALS
AS THE KNOWN GENERAL RULE;
IT WOULD BE A BUY SIGNAL WHEN SHORTER(BLUE LINE) HULL CROSSES ABOVE LONGER (RED LINE) ONE
AND CONVERSELY A SELL SIGNAL WHEN LONGER HULL CROSSES ABOVE SHORTER ONE
THIS STUFF IS USEFUL FOR USERS COMPLAINING ABOUTREACHING THE MAXIMUM NUMBER OF INDICATORS :)
KıvanÇ
@fr3762 on twitter (only tweeting in TURKISH)
fr3762 on youtube for indicator explanations in TURKISH)
TURKISH EXPLANATION:
2 HULL hareketli ortalaması aynı grafikte:
Kısa periyotlu (mavi) olan uzunu yukarı kestiğinde AL
Uzun periyotlu (kırmızı) olan kısayı yukarı kestiğinde SAT sinyalleri üretir
Varsayılan periyotlar, birer Fibonacci sayıları olan 8 ve 21 olarak belirlenmiştir, değiştirilebilir.
İndikatör sayısı sınırlamasının önüne geçmek amacıyla geliştirilmiştir.
Hullmovingaverage

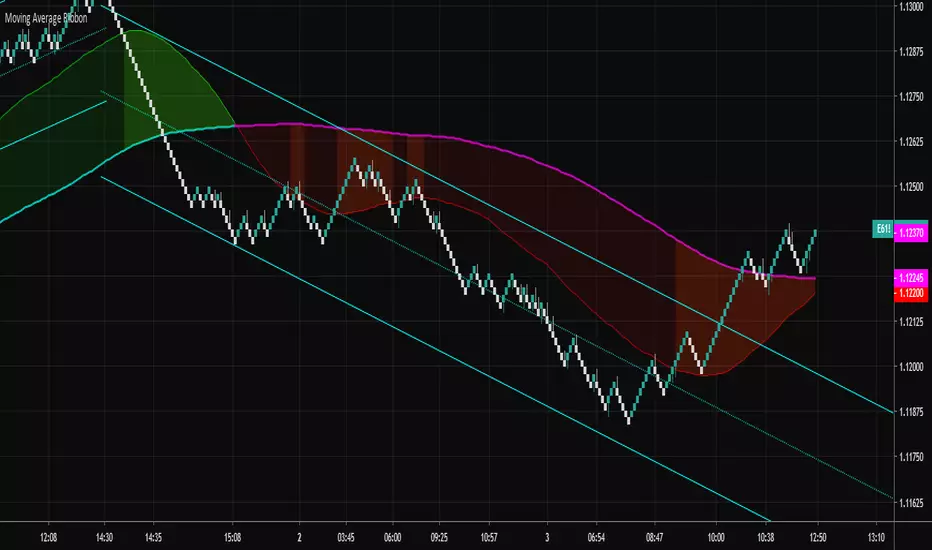
Moving Average RibbonA ribbon that uses a fast EMA, a slow EMA, and a signal EMA. By default the signal EMA is invisible.
When the fast EMA > slow EMA the default fill is green, and then red when the fast EMA < slow EMA. The signal EMA adds a 2nd flavor to the ribbon. When the fast EMA > slow EMA, if the signal is beneath the fast EMA, the ribbon fill changes its color to a brighter green. When the fast EMA < slow EMA, if the signal is above the fast EMA, the ribbon fill changes its color to a brighter red. Many times these little "fishhook" pullbacks are buying/shorting opportunities in the dominate trend.
Try settings of 8/21/8 Fast/Slow/Signal, with the "Zero-Lag Signal" check box checked. Zero-Lag is a simple algorithm that tries to remove as much lag as possible from an EMA. An 8 EMA will run "slower" than an 8 Zero-Lag EMA.
Additionally, 2 simple alerts are available for whenever the fast EMA crosses above the slow EMA, and the opposite.
Cheers.