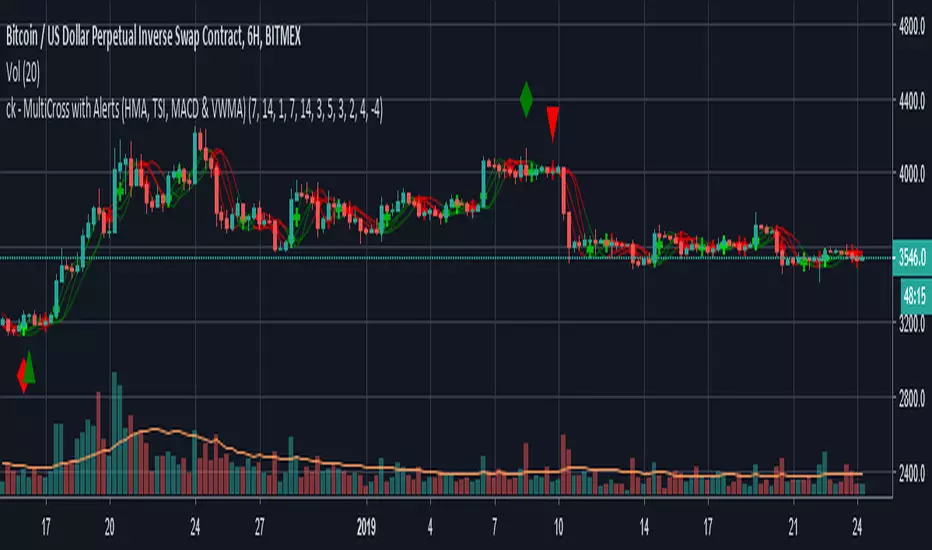
ck - MultiCross with Alerts (HMA, TSI, MACD & VWMA)Hello again everyone!
I hope you enjoy this "Multicross" Indicator.
Feature packed indicator with Alerts, that includes:
Double Hull MAs (fast and slow)
TSI (fast, slow, Long trigger & Short triggers definable)
VWMA
MACD (fast and slow)
Visual output plots line crosses from the indicators and provides visual Long and Short triangles and Alerts for bot users!
Enjoy!
Special thanks to Magnus Söderberg for the idea behind this.
Hullmovingaverage
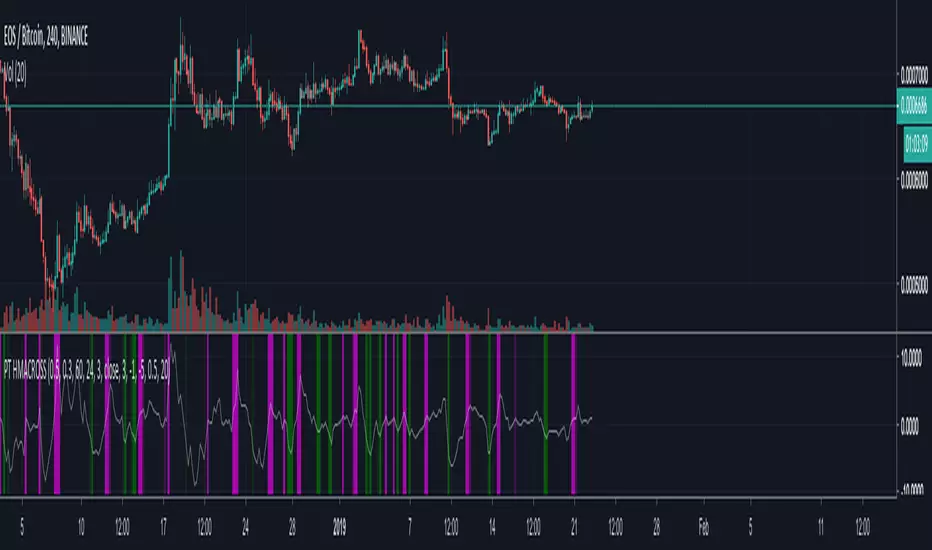
[ProfitTrailer] HMACROSS Buy/Sell StudyProfitTrailer buy/sell study for HMACROSS strategy.
The script highlights the region where trailing is most likely to succeed.
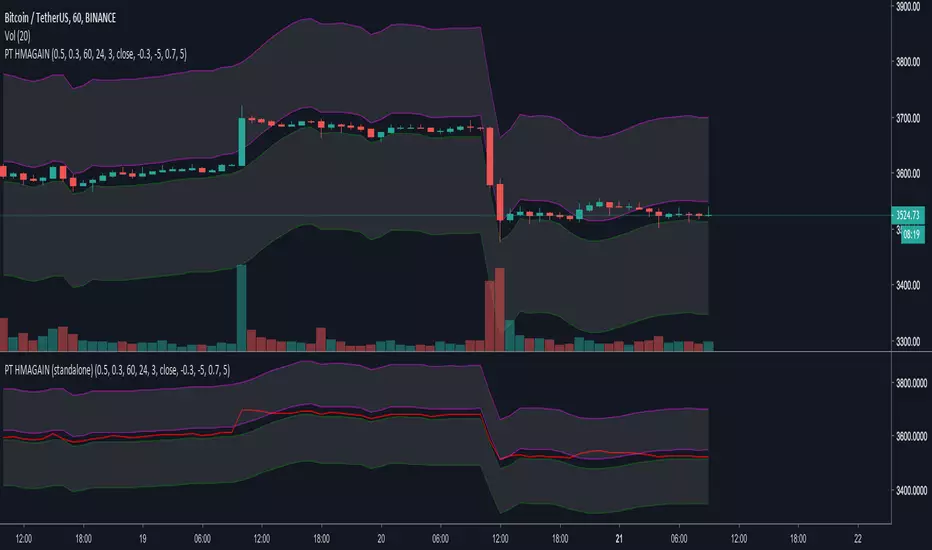
[ProfitTrailer] HMAGAIN Buy/Sell Study (standalone)ProfitTrailer buy/sell study for HMAGAIN strategy (standalone indicator).
The script highlights the region where trailing is most likely to succeed.
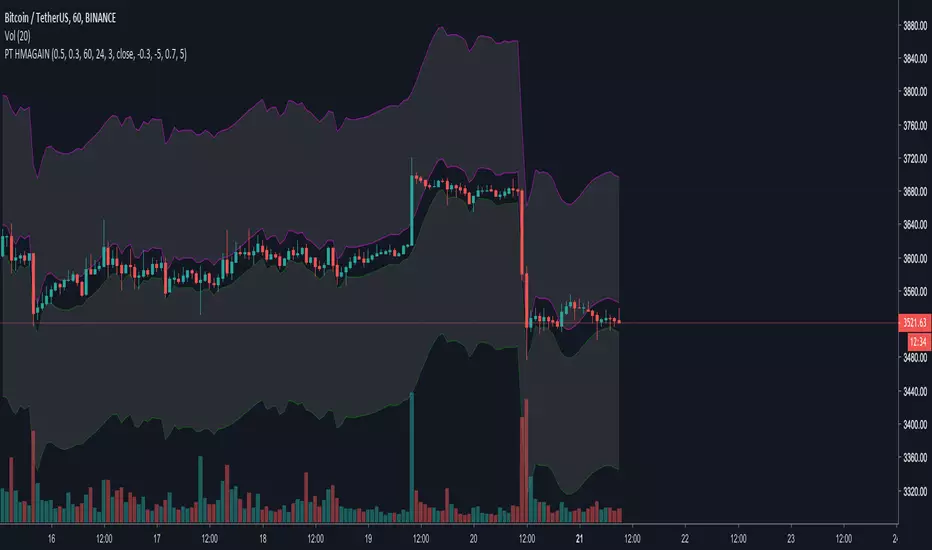
[ProfitTrailer] HMAGAIN Buy/Sell StudyProfitTrailer buy/sell study for HMAGAIN strategy.
The script highlights the region where trailing is most likely to succeed.
CryptoCoyns HullMA [v2018-12-10]CryptoCoyns Hull Moving Average
This indicator implements the Hull moving average.
The Hull Moving Average (HMA), developed by Alan Hull, is an extremely
fast and smooth moving average. In fact, the HMA almost eliminates lag
altogether and manages to improve smoothing at the same time. A longer
period HMA may be used to identify trend. If the HMA is rising, the
prevailing trend is rising, indicating it may be better to enter long
positions. If the HMA is falling, the prevailing trend is also falling,
indicating it may be better to enter short positions. A shorter period
HMA may be used for entry signals in the direction of the prevailing trend.
The Source for price can be defined. i.e. Close, Open, High, Low, etc.
The period length used can be defined.
MA Line colour is fully configurable.
If you get some value out of this indicator please consider making
a small donation to my favourite charity the Save the Childrens Fund.
Every donation will make a difference to the lives of children.
All donations over $2 are tax deductable. You can donate here:
savethechildrenfundraising.org.au
Copyright (c) 2018, Grant Cause aka CryptoCoyns

Multiple Moving Average Colors7 moving averages in 1 indicator, including the Hull Moving Average.
I've updated with some graphics that print at the top of the chart (you can change color and placement on the indicator settings page)
All 7 MAs Up - Green and up triangle
All 7 MAs Down - Red and down triangle
4, 5 or 6 MAs Up - Dark green and a square
4, 5 or 6 MAs Down - Maroon and a square

5 Moving Averages ( 7,30,50,100,200 ) ( sma ema wma hullma )5 Moving Averages
Stock: works best on dark layout
7 Ma lime
30 Ma orange
50 Ma red
100 MA aqua
200 White
You can switch between
1 sma
2 ema
3 wma
4 hullma
5 vwma
6 rma
Change the coler and Ma value line with, ext

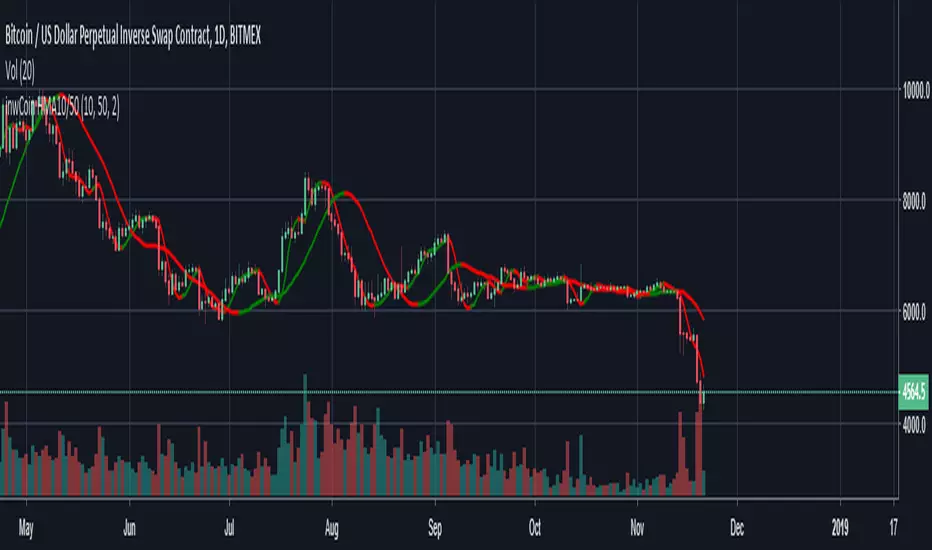
inwCoin HMA10/50Just simple HMA 10/50 with color change when trend change ( Red = downtrend / Green = uptrend )
Hull50Signals are based on Hull 50 length
You can change the length if you want it to buy more or less
have fun

HMA 55/80 Crossover Strategy - Multiple Crossing OptionsThis strategy concept is from ismail_tarim on TradingView, and on Twitter as @ismailtarim977. It is intended to be implemented on the daily chart . The original strategy is reflected, to the best of my ability and understanding, in the default settings.
There is an option to toggle plots being displayed. The plots accurately indicate when the events take place, rather than the delay from the strategy display.
// SYMBOL LEGEND //
Green 'X' indicates when price crosses up the desired HMA .
Green 'Up Arrow' shows the pullback entry on the crossed HMA .
Red "Down Arrow" shows the exit when prices closes below the HMA 55, or "Fast HMA".
If you notice something that needs to be changed or that could be added, please share it in the comments below. Thanks!

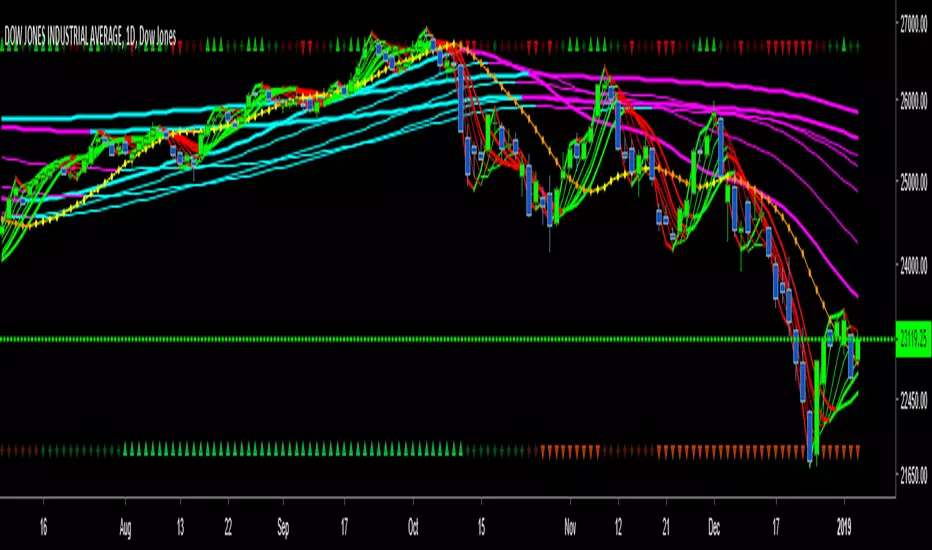
📊 Advanced Charts Suite v2.1 by 🇨🇷🇾🇵🇹🇴🇷🇹🇭🇾🇭🇲🇸📊With the advanced charts suite you get multiple indicators you can overlay on your charts, while only using one indicator slot.
🎁We made this after requests from our members, to assist those who use a free TV account. Its not advised to use them all at once, use them in combinations and see what works for you!
🕥 It can take a minute or more to load... be patient! I wanted to include more indicators, but hit some of the limits imposed by pine script. All options are off by default.
📊 Indicators Included are:
✅Ichimoku Cloud
✅Support Resistance Fractal
✅Trailing Long/Short Stoploss
✅Bull Bear Squares
✅Triple Hull Moving Average
✅Standard Hull Moving Average
✅Fibonacci Daily
✅Advance Decline Lines
👍If you enjoy the Charts Suite, please like the indicator, and follow me on TradingView!
💬Come chat with us in telegram (link in signature) if you have any questions or would like a trial of a premium indicators (linked below).

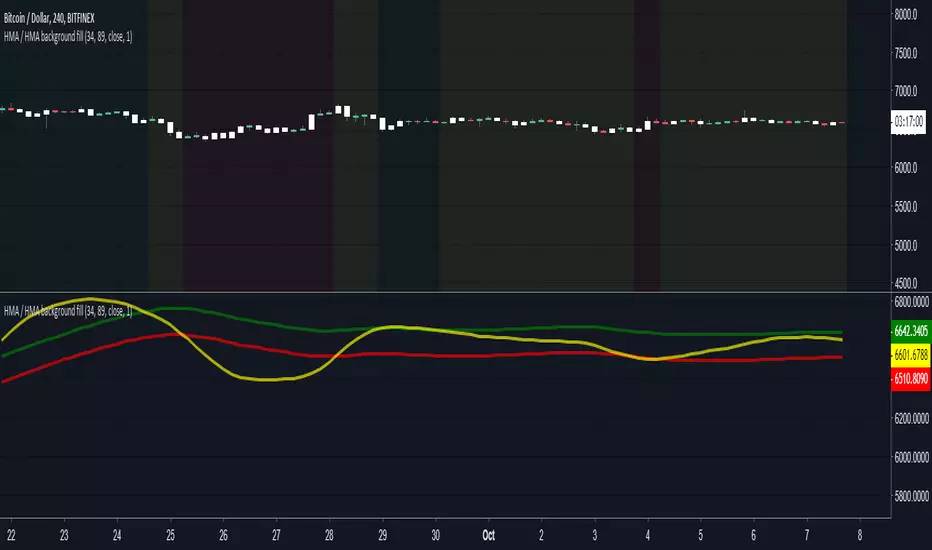
HMA + HMA + Dispersion background fill (ver 2.0)fast HMA • slow HMA • Dispersion Zone| background color's
---
Background colors: Red, Green and Yellow. Default transperent = 5%
• Green background: fast HMA above the dispersion zone
• Red background: fast HMA below the dispersion zone
• Yellow background: fast HMA inside the Dispersion Zone
---
# Alerts only for cross Yellow to Green and Yellow to Red zones.
---
• The dispersion zone is calculated relative to the slow HMA.
Fast - Slow HMA background fillfast HMA • slow HMA | background
---
Background colors: Red and Green. Default transperent = 2%
• Green background: "fastHMA" crossover "slowHMA"
• Red background: "fastHMA" crossdown "slowHMA"

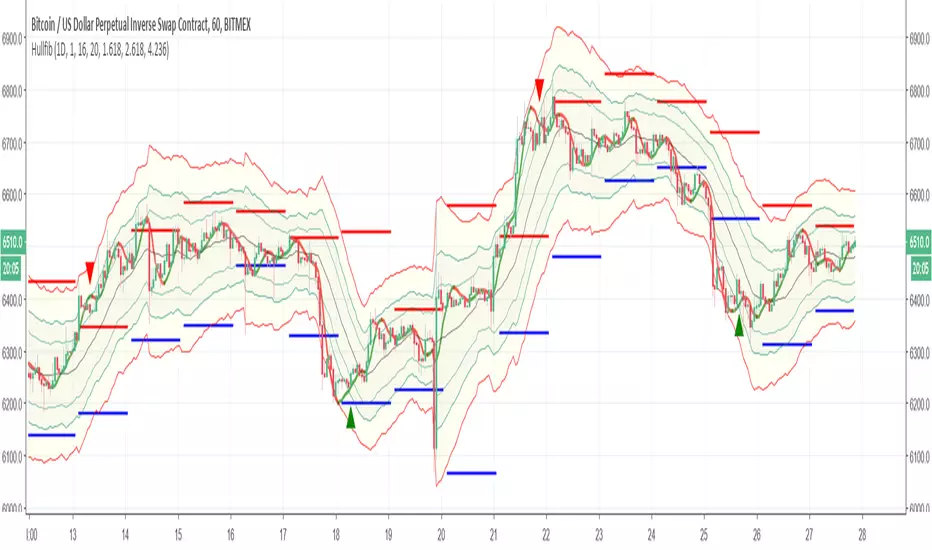
HullfibSo this indicator is just to show a concept
it based on Bollinger type of fibs with regular daily fibs (upper =red,lower= blue) and the signal produce by the Hull moving average
the idea is to compare the regular fibs and the Bollinger type of fibs so it easy in this way to see where the real low and where the real high
the hull moving average can be set to be faster or shorter for the buy signal. since it open code you can add or change what ever you want
have fun
Uncle Mo's Ultimate Ichimoku V1Main features:
2 x Ichimoku Cloud
5 x EMA
2 x MA
1 x HullMA
Williams Fractals
Study is based around trader @br0qn 's Ichimoku script.
Credits also go to:
@RicardoSantos for the Bill Williams Fractals
@EmilianoMesa for the EMAs/MAs
@mohamed982 for the HullMA
The script is open source so please feel free to change it around. I'd greatly appreciate it if you could suggest ways to improve it.
Happy trading!

BottomFinder Adv. Charts Suite V2.0With the advanced charts suite you get multiple indicators you can overlay on your charts, while only using one indicator slot. We made this after requests from our members, to assist those who use a free TV account. IT can take a minute or more to load... be patient! Its not advised to use them all at once, use them in combinations and see what works for you! I wanted to include more indicators, but hit some of the limits imposed by pine script. All options are off by default.
Included are:
Ichimoku Cloud
Support Resistance Fractal
Trailing Long/Short Stoploss
Bull Bear Squares
Triple Hull Moving Average
Standard Hull Moving Average
Fibonacci Daily
Advance Decline Lines
This indicator is available to all our members at no extra charge. If you would like access join us in the link from my signature. You can get a trial of our paid indicators and access to the free ones as well.
Please also like this indicator, and follow me on TradingView for access! We have many more great free indicators coming in the future!

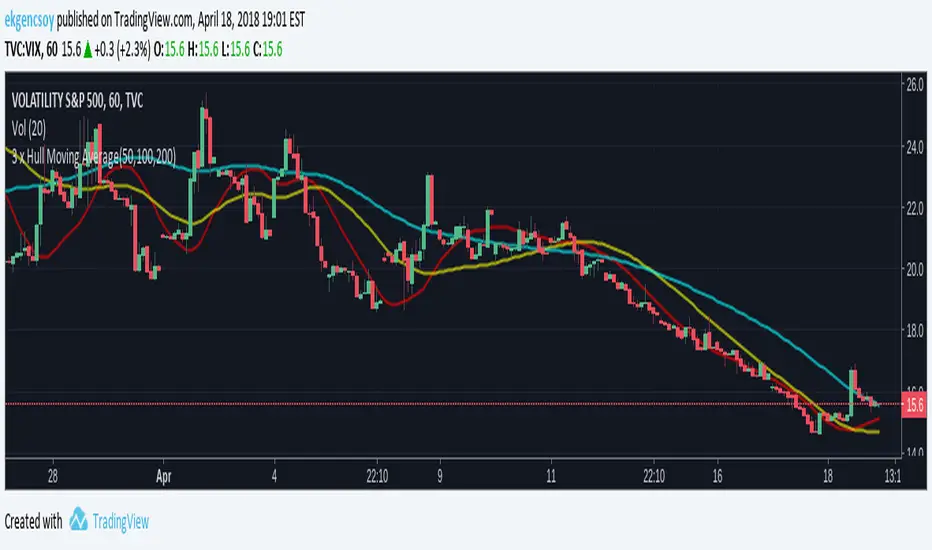
CryptogramTR with OPEN CODEIndicator is obtained by importing RSI(14) into HULL moving average source with 2 different periods, as one is long period and the other is short.
When green line (short period) cross upward the red line (long period) , this is a BUY; vice versa it is a SELL.
When HMA Short Period is set to 1 (one), yielding line is absolutely the same line of RSI (14). You can change it into 8(eight) preferably.
İndikatör, RSI(14) indikatörünün, hull hareketli ortalamasının kod kaynağı olarak atanması ile elde edilmiştir. Uzun ve kısa olmak üzere 2 ayrı periyot kullanılmıştır.
Yeşil çizgi yani kısa periyotlu çizgi, kırmızı yani uzun periyotlu olanı yukarı keserse AL, tersi durum SAT olarak düşünülmelidir.
Hull Kısa Periyodu 1 iken oluşan yeşil çizgi, RSI(14) indikatörünü vermektedir. Kısa periyot olarak tercihinize göre bu değeri 8 olarak da kullanabilirsiniz.

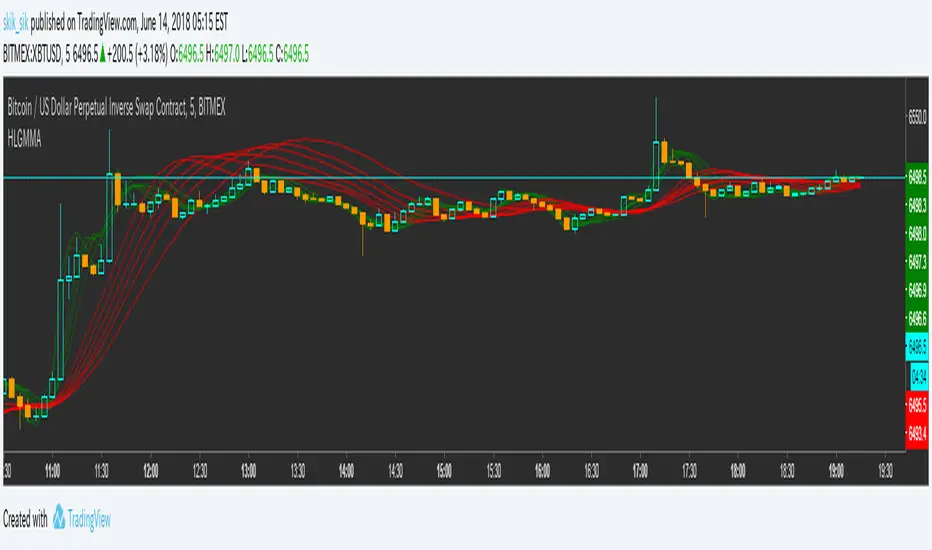
Hull Guppy Multiple Moving Average 名前のとおり
GMMAの説明は自分でお探しくだいさい
As the name implies
Please explain GMMA by yourself
andrei_ATBB(hullma) indicatoreIndicator for the ATBB strategy (hullma) to be able to use alerts
use only the first BUY and not the intermediate ones until the first SELL
use only the first SELL and not the intermediate ones until the first BUY

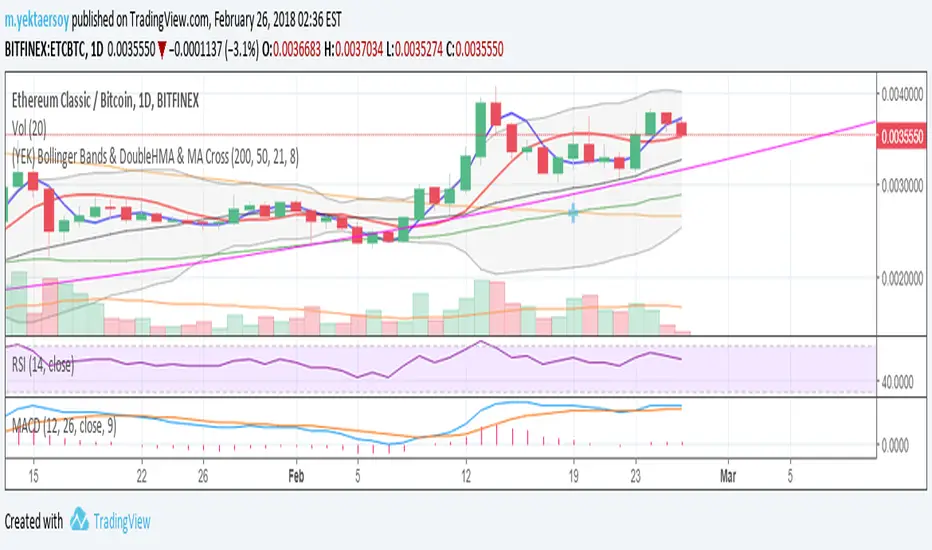
(YEK) Bollinger Bands & DoubleHMA & MA CrossMy favorite indicators ALL-IN-1: Bollinger Bands, Double Hull Moving Average (21,8), Double Moving Average (200,50)
Hull Moving Average + Bollinger BandsThis study make use of Hull Moving Average and Bollinger Bands.
The crosses give signal about HMA and BB crossovers, they are a bit lagging, if you stare well you will spot them a little earlier. It look like a good idea to buy and sell when HMA is near or on the outside of the outer bands.
By default the Bollinger Bands uses Simple Moving Average with 21 periodes, and Hull Moving Average use 9 periodes. You can alter the settings in the format dialog.
Please use as pleased, and if you do something clever with it I'll be happy to know :D
