Goldencross

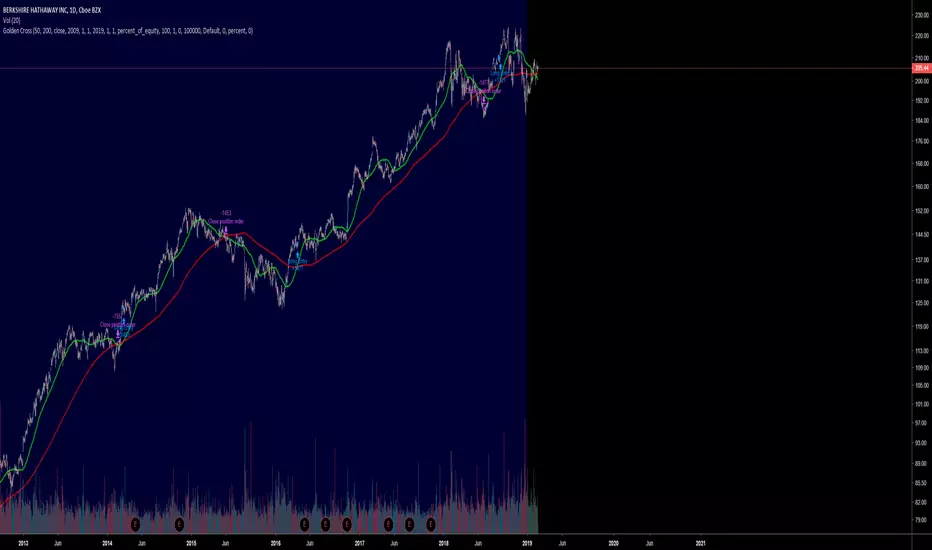
Death & Golden Cross IndicatorThis script will plot three EMAs and give alerts for death cross and golden cross buy & sell strategy.
The death cross signals a possible shift in trend sentiment from bullish to bearish. Golden Cross signals a shift in a bearish trend to a bullish trend.
Death Cross = 50 Day EMA crosses under 100 Day EMA
Double Death Cross = 50 Day EMA crosses under 200 Day EMA
Golden Cross = 50 Day EMA crosses over 200 Day EMA
Moving Average Cross = 50 Day EMA crosses over 100 Day EMA
Entry Points:
Entry on Golden Cross & VWMA
Entry on 50 EMA Cross 100 EMA
Exit Points:
Exit on Death Cross, Double Death Cross, 200 Day EMA crosses under VWMA
Early Entry and Exit Points:
Uses 50 Day VWMA crossing with 200 Day EMA
As always, trade at your own risk. Best to confirm entry and exits with other strategies and oscillators.

Ultra Trabalza EMA/MA + crosses,rejectionsEMA/MA crosses
Bullish cross = green "^"
Bearish cross = red "x"
Golden cross (50EMA > 200EMA) = Golden circle
Death cross (50EMA < 200EMA) = Red circle
Bullish Wick through support = Gold candle
Bearish Wick through resistance = Purple candle

Dumb Strategy 2 - Golden CrossThe Golden Cross is one of the simplest market indicator who helps long term investors to entry a position.
With that in mind, I made a very easy to understand backtest showing how much we could earn if we entered in a Golden Cross and exit when Death Cross happening.
Take this code and try in your favorite market.
Of course, never use only this indicator to trade.

ASX300 Golden Cross stock alerts (A2M-ANZ)Golden Cross happens when the SMA50 crossover the SMA200, which usually signals profitable bullish trend and good buy entry. For example, for Aurelia Metals the Golden Cross buy signal had 250% buy and hold profit in about a year.
This indicator hunts for the Golden Cross of the first 20 stocks in the ASX300 (A2M to ANZ), once it it happens the indicator plots the name of the stock that had Golden cross which could be use as entry for that stock. As you can see various stocks were plotted in the chart, those had crossedover at the time of plotting.
Due to TradingView Pinescript limitations, only 20 stocks can be watched in one indicator. Therefore 15 Golden Cross indicators are required to watch the entire ASX300.
This can also be applied to crypto coins with some adjustments in the script, so you can be alerted of the Golden Cross in crypto coins and buy bullish coins.

Custom Time Frame Moving Aver Cross w/Alerts - VWAP - BBandsWork in progress
- made the VWAP really small because it is only used on the shorter time frames, but it is nice to have at times
- BBands are great for showing me when to pay even more attention, when they are squeezing
Open to suggestions


dmw_3SMACross3 SMA set to 5 10 20 used to find the crossing points for pattern reversals or breakouts.

DEMA Crossover Strategy_01_SARThis is used to do trade based on golden cross and death cross. It uses SAR.

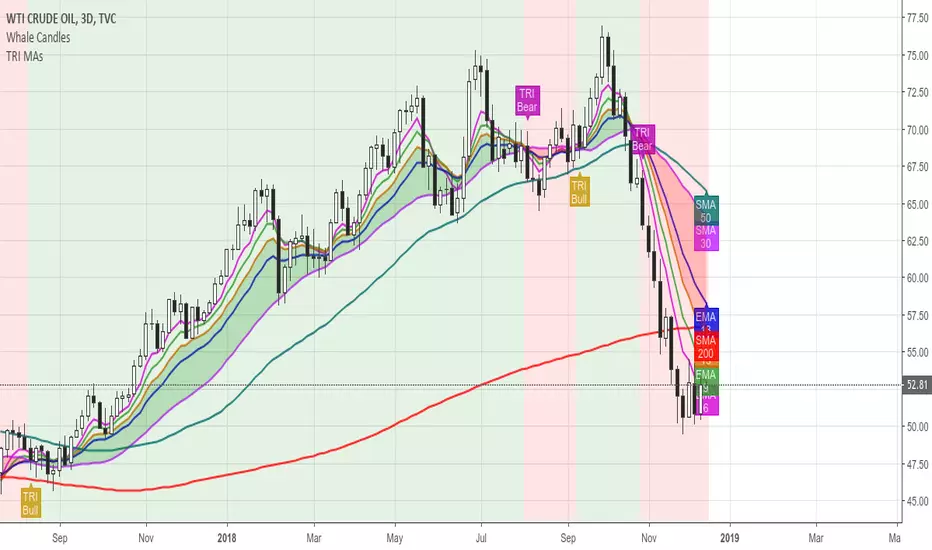
Ultimate TRI MAsThis is a helper tool to get deeper into TRI's Moving Average Studies.
The indicator allows for:
Show/Hide all MAs
Show/Hide each one of the MAs
Label the MAs for quicker identification
Select Bias Mode: Institutional or Brian's
Draw a Cloud based on Bias Mode
Highlight Crosses based on Bias Mode
Color the Background based on Bias Mode
Show/Hide the Cloud, the Crosses and the Background
Hope you find it useful!
EMA 50, 100 and 200Draw a set of 3 EMA: 50, 100 and 200. It highlight with a circle the crossing of EMA(50) with other EMAs

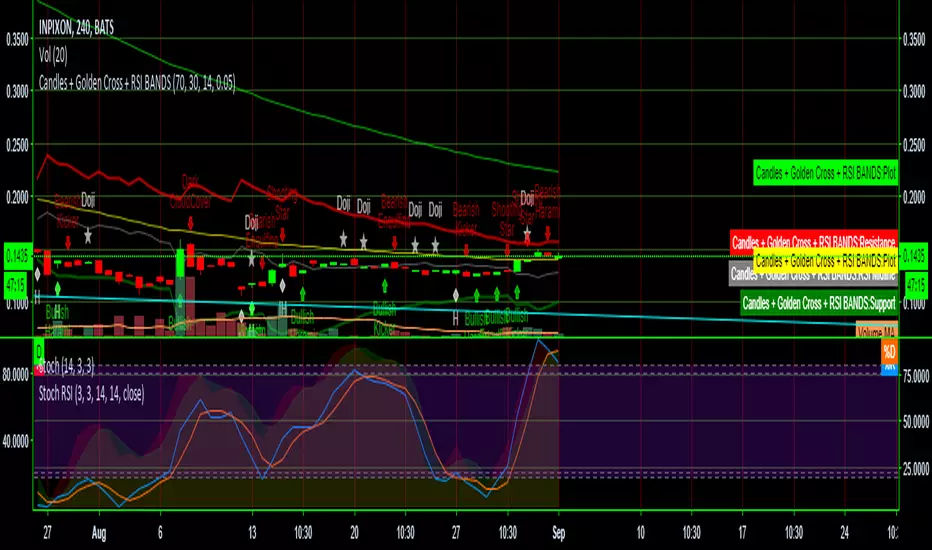
Candles + Golden Cross + RSI BANDSThis script combines three scripts for ease of use
RSI Bands LazyBear
Golden Cross MichMexTrading
Candlestick patterns identified repo32
I combined them because they work exceptionally well together in identifying reversals and other potential changes
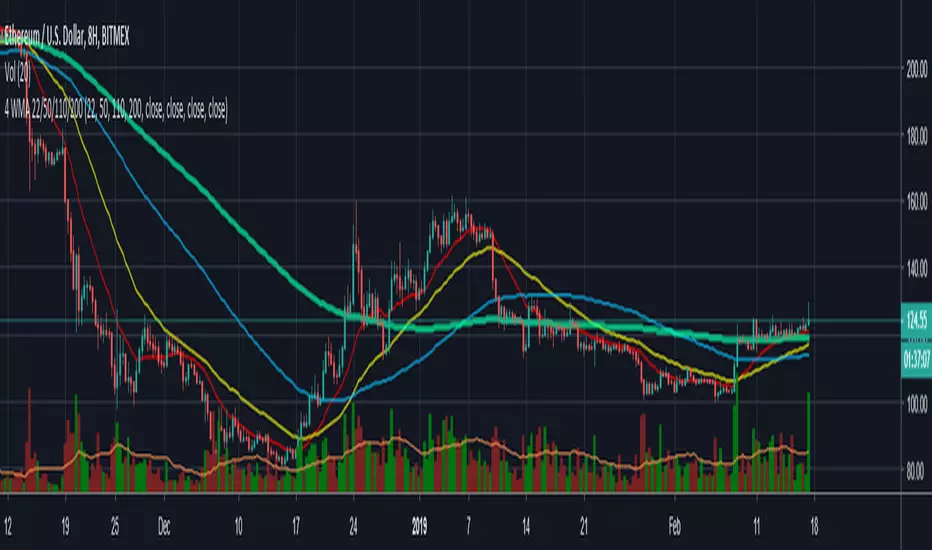
Cyatophilum Golden X - RSI [INDICATOR] [ALERT SETUP]This indicator is a custom combo of Ema crosses, RSI divergences and Support/resistance, designed to make the most profit possible.
It is a pretty solid indicator for trading BTC in 4H.
There are two kind of buy signals : Green and Blue triangles, that are two great Buy/Long entries.
There are also two kind of sell signals: Red and Orange triangles, that are two great Sell/Short entries.
The indicator comes with automatic Alerts that trigger on Green and Blue triangles for a Buy Alert, or that trigger on Red and Orange triangles for a Sell Alert.
If you are interested in purchasing the indicator and want to try it, then please leave a comment.
A strategy version should follow on my profile soon.
-----------------------------------------------------------------------------------------
I am also available for PineScript Development and Reverse Engineering.
Join my discord:
discord.gg

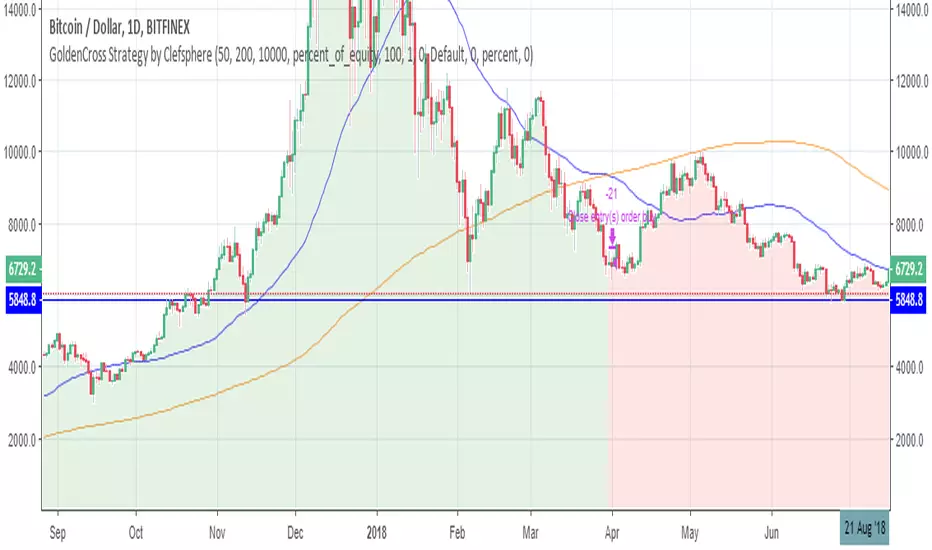
GoldenCross Strategy by ClefsphereGolden cross when 50SMA crosses 200SMA. Can be used for any market. Day time frame is ideal.
5x EMA RSI Candles, Price action candles
Hi all
Build in functions:
1. Price candle recognition;
a) Dark shadow cover,
b) Piercing line,
c) Doji, bearish and bullish
d) Bullish and bearish engulfing
e) Inside and outside bars
f) Up Reject Green Pin & Down Reject Red Pin Bar
g) Hammer & Inverted Hammer
2, RSI overbought and oversold candles
a.) Red = Overbought
b.) Geen = Oversold
3. EMA Background change:
a) Light green is Ema 21 greater than EMA 55 and above EMA 200 (In up trend)
b) Dark green is EMA 21 greater than EMA 55 and below EMA 200 (Start of up trend)
c) Light red is EMA 21 less than EMA 55 and above EMA 200 (Start of Down trend)
d) Dark red is EMA 21 less than EMA 55 and below EMA 200 (In Down trend)
4. Alerts:
a.) RSI Overbought
b.) RSI Oversold
c.) EMA Buy = Light green
d.) EMA Sell = Light red
e.) Price candle alerts
I would recommend to use
RSI - CM_Ultimate RSI MTF
MACD CM_MacD_Ult_MTF
For confirmation of trades.
Please take note this is invite only via BTC donation, keep the donation in mind when asking for access.
Thanks

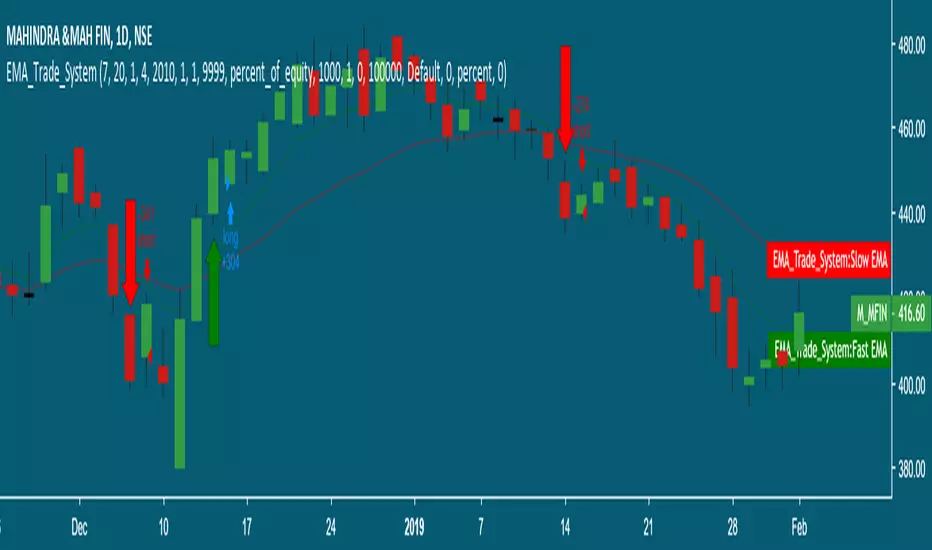
Moving Average Cross Strategy Simply define your fast and slow M then backtest the strategy.
*First script, work in progress. Will allow you to combine two TV indicators into one.

Multicross - golden/death cross indicator with inside barThis script utilizes five exponential moving averages, golden/death cross flags and inside bars. The EMAs are: 8,13,21,55 and 100. The cross flags appear when: 1st fastest crosses the 2nd fastest, 2nd fastest crosses the 3rd fastest and so on and so forth. Inside The script originated after I watched the youtube video with Philakone talking about swing trades. I started the the four EMAs he used and then decided to add the 100 to add a little more weight to the projected movements. I've noticed sometimes when inside bars and a golden crosses happen simultaneously the movements are more explosive.

Moving Average 50/200 Golden Cross or Dead CrossA strategy is to apply two moving averages to a chart, one longer and one shorter. When the shorter MA 50 day scrosses above the longer term MA 200 days it's a buy signal as it indicates the trend is shifting up.This is known as a "golden cross."
When the shorter MA crosses below the longer term MA it's a sell signal as it indicates the trend is shifting down. This is known as a "dead/death cross"
For cryptocurrencies use 4 hour charts.

Multiple EMAs [CryptoFuturo]Enjoy viewing multiple Exponential Moving Averages (EMA) on your chart? Want to use only one indicator to display up to 5 EMAs? Then you've come to the right place!
FEATURES:
Configure and use up to 5 Exponential Moving Averages (EMA) using a single indicator.
Default lengths for the 5 EMAs are 10, 20, 50, 100, 200.
Length values, plot line colors and source data are all configurable.
