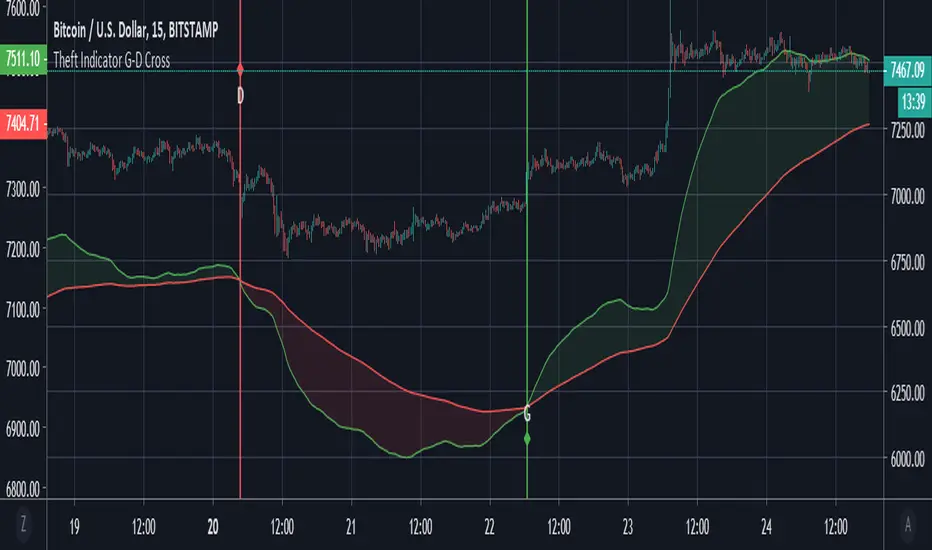
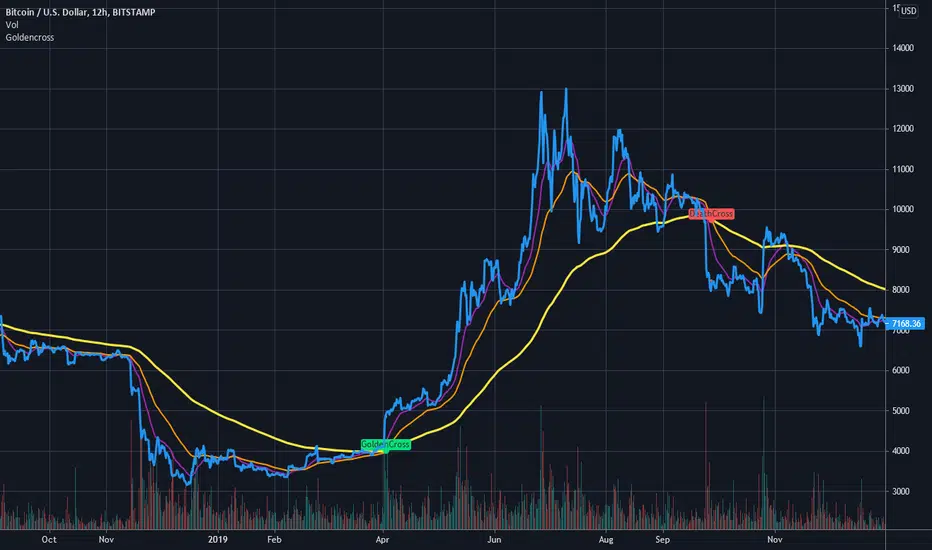
Theft Indicator - Golden/Death CrossThe golden cross and death cross used here is favorable for low time frames. We believe it is a good scalping option to use it. It works well with forex, stocks and crypto.
How is it used? - Just apply it to the chart, and take trades on the labels signaled. G = Golden cross || D = Death Cross.
The indicator is open for public use, but the source code is protected.
Enjoy it.
Goldencross
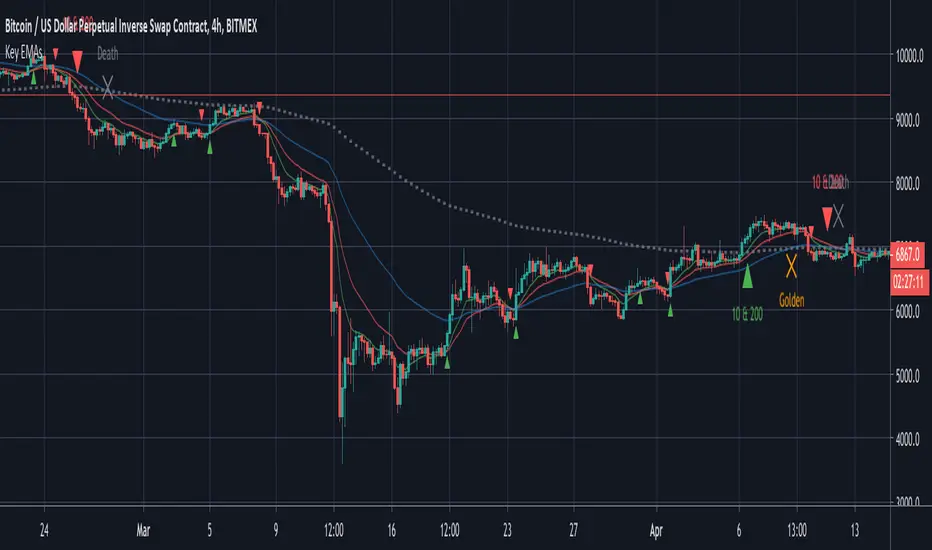
Key EMAsSimple trade helper script that plots:
- 10 & 20 EMA crosses for fast moves
- 10 & 200 EMA crosses for trends
- 50 & 200 EMA golden and death crosses
Alerts built in.
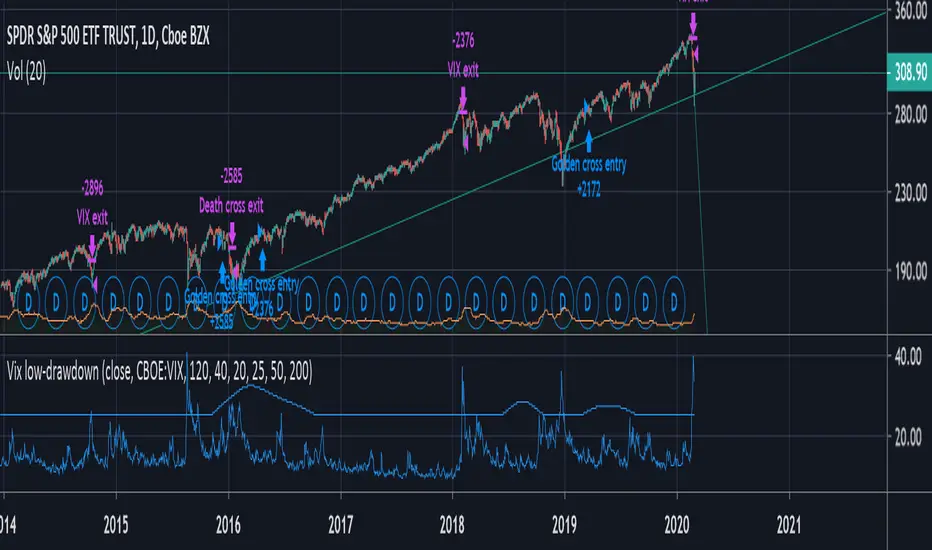
VIX + moving average low-drawdown SPY strategyAims to be a simple way to avoid recessions by combining two complementary tools that work well together: A simple moving average crossover (death cross & golden cross) to detect a bull markets and run with it, and a crossover between the VIX and a moving average of its previous peaks to get out as quickly as possible during periods of volatility.
The Death cross gets you out of slow drawn-out bear markets. The VIX gets you out of sudden rapid crashes.
unRekt - The MachineThis is a combined script of Welcome to the Machine and Kiss Cross. A moving average crossover was added with the golden cross '50 n 200' being most noticeable.
Up to 5 editable moving averages can be selected on their own or all displayed with varying type of your choice SMA, EMA, WMA, VWMA and LSMA.
Bollinger bands can be disabled to just show the moving average.
Image of bollinger bands off:

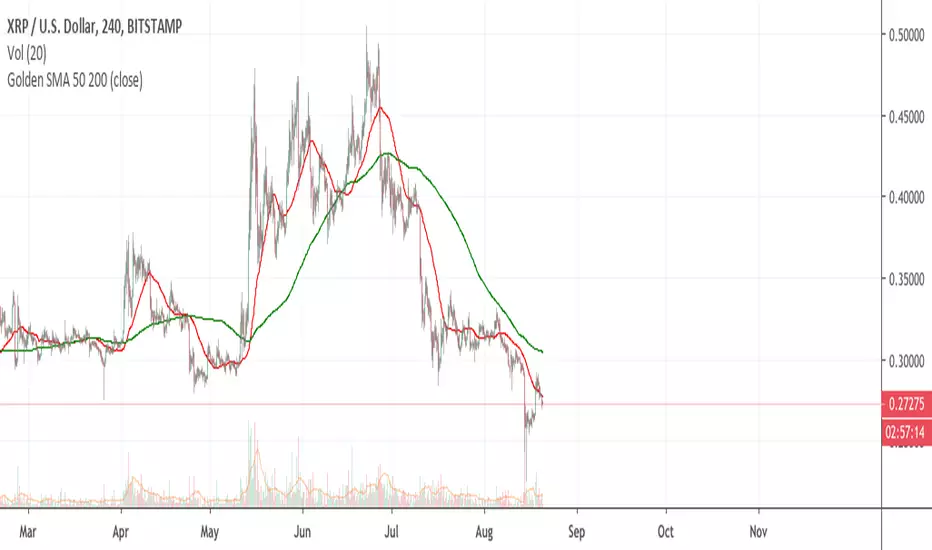
Moving Averages CrossThis Indicator helps you spot crosses between moving averages.
Thought to combine short term and long term strategies.
A complementary element for your trading tool belt.
The First study (short term):
Helps you visualise the relation between two simple moving averages (9,21) by default.
The Second study (long term):
Helps you identify the relation between three simple moving averages (50,100, 200) by default.
Spot Golden Crosses and Death Crosses from far.

ANN BTC MTF Golden Cross Period MACDHi, this is the MACD version of the ANN BTC Multi Timeframe Script.
The MACD Periods were approximated to the Golden Cross values.
MACD Lengths :
Signal Length = 25
Fast Length = 50
Slow Length = 200
Regards.

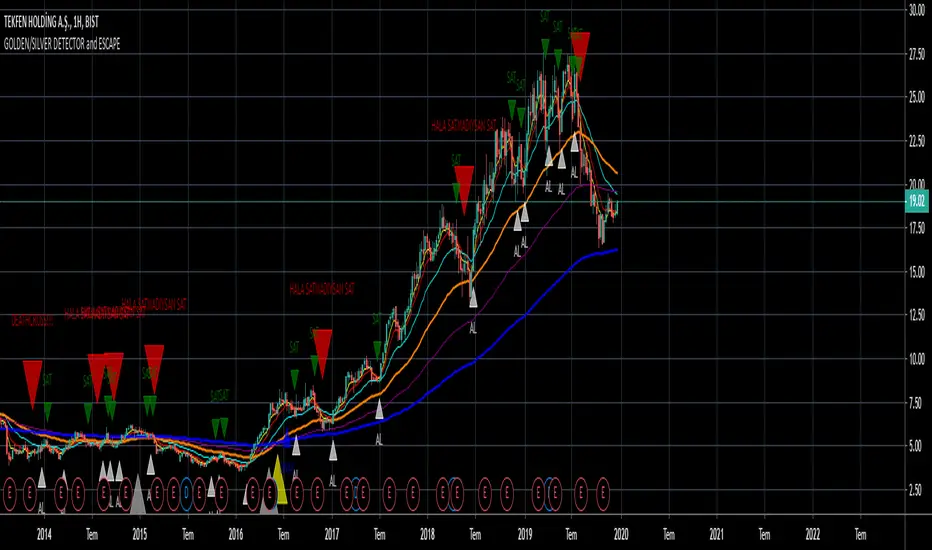
GOLDEN/SILVER DETECTORFind golden and silver crosses with using EMA.
Note
Colors are depends on you.
Translation
AL = BUY
SAT = SELL
ONAY = CONFIRMATION
Juicy Golden/Death CrossThis script shows you if we are in a downtrend or uptrend using the golden/deathcross strategy. It is fully costumizable and we have been able to code in cosum alerts. This indicator should not be used to buy or sell, but determin scalps or swingtrades in the direction it is going.

LIVIDITIUM [BTC] {PREMIUM}The LIVIDITIUM is a set of indicators centered around a series of parallel bands call the LVDT guide bands, defined by lines call the LVDT levels. Major LVDT levels have thicker line-widths.
LVDT levels are constructed from a mathematical conjugation of the complex golden ratio solutions.
>> Useful to determine critical levels, indicates possible support levels, as well as major and minor tops/bottoms.
Look at historical interactions to work out key levels for any particular chart, and adjust the displacement offset value to get the LVDT levels to conform better to a particular chart at a particular time-frame.
Major BUY/SELL indicators for top/bottom levels were added specifically for BTCUSD and optimised for the 1D chart (disabled at lower time-frames). These are based on the interaction of the candlestick with various emas and smas as well as with the LVDT levels.
A scoring algorithm also analyses the significance of major and minor death crosses, base on the presence of other indicators in its vicinity to suggest potential local buy/sell prices, and should still work relatively well at lower time-frames.
Various triggers are also implemented, including golden/death cross indicators, as well as pivot and potential reversal points -- labelled with either text-markers, or colored vertical bands.
Signal markers that are only valid for the BTCUSD chart are automatically disabled when LIVIDITIUM is being used on other charts.
~ * ~ * ~ * ~ * ~ * ~ * ~ * ~ * ~ * ~ * ~ * ~ * ~ * ~ * ~ * ~ * ~ * ~ * ~ * ~ * ~
Note:
In no way is this intended as a financial/investment/trading advice. You are responsible for your own investment/trade decisions.
Please exercise your own judgement for your own trades base on your own risk-aversion level and goals as an investor or a trader. The use of OTHER indicators and analysis in conjunction (tailored to your own style of investing/trading) will help improve confidence of your analysis, for you to determine your own trade decisions.
Please PM me for access information.

Rhaps SMAEMA Combo v1.1There's many versions of this sort of thing around the Tradingview library, but i guess we all like things to our own specifications.
So this is my take on the SMA and EMA version combined.
Bunch of SMA's & EMA's, with labels, and G&D Cross Labels and Alerts.
These values can of course be changed to any you may prefer.
Rhapsodyy's Combo SMAEMA's v1.1
SMA's with Painted Labels : 10/30/50/80/200
EMA's with Painted Labels : 21/50/89/200/377
50SMA / 200SMA Golden & Death Crosses on Current Timeframe & Alerts
Daily 50SMA / 200SMA Golden & Death Crosses overlayed onto Current Timeframe & Alerts
50EMA / 200EMA Golden & Death Crosses on Current Timeframe & Alerts
Daily 50EMA / 200EMA Golden & Death Crosses overlayed onto Current Timeframe & Alerts

Golden X BF StrategyThis is a Strategy version of my Golden X/Death X indicator.
The strategy goes long on a golden cross and short on a death cross. You can change the MA types and periods in settings.

FUSIONGAPS V5Market bullish/bearish phase indicator , with trend-reversal and golden/death cross indicators.
This the re-implementation of my old script, now allowing the selection between different moving-averaging modes.
Note: In no way is this intended as a financial/investment/trading advice. You are responsible for your own investment decisions and/or trades.
~ JuniAiko
(=^~^=)v~

Golden/Death X BF 🚀A golden cross occurs when the 50 MA crosses above the 200 MA.
A death cross occurs when the 50 MA crosses below the 200 MA.
You can adjust the following settings for each Moving Average:
Source - open, high, low, close, hl2, hlc3, ohlc4
Type - sma, ema, swma, wma
Period - integers greater than 0
The chart background turns green or red upon a cross.

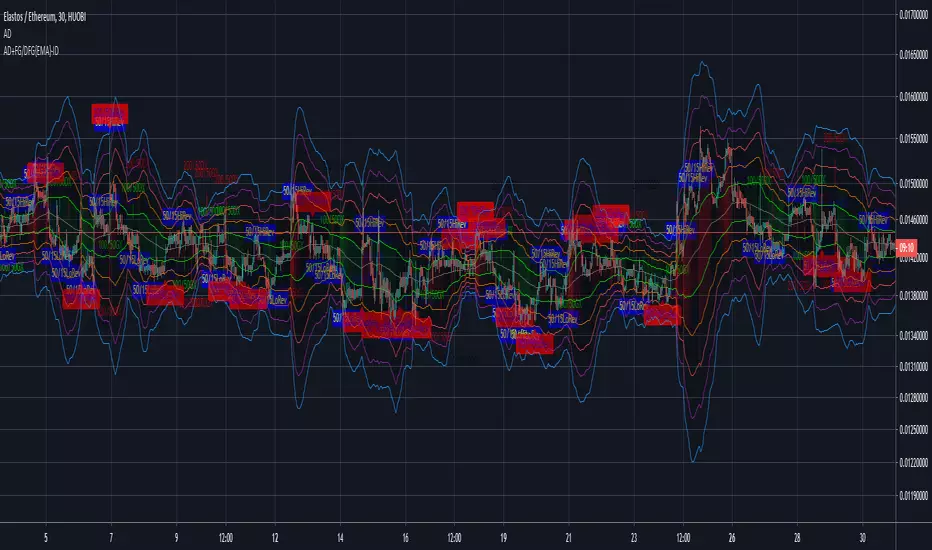
AEONDRIFT with FG & DFG {EMA} indicatorsAEONDRIFT with {EMA} implementation of FUSIONGAPS (FG) and DIFFERENTIAL FUSIONGAPS (DFG) derived indicators.
~JuniAiko
(=^~^=)v~
Check out the other analytical tools that I had published.
AEONDRIFT:


4 EMA en 1 Indicador y Cruce Dorado 50:200 Luis AlvarezA disposicion de todos este humilde aporte, donde hay comparacion de las EMAS mas importantes para una vision integral del movimiento del mercado
@LuisMerida @malkarma2
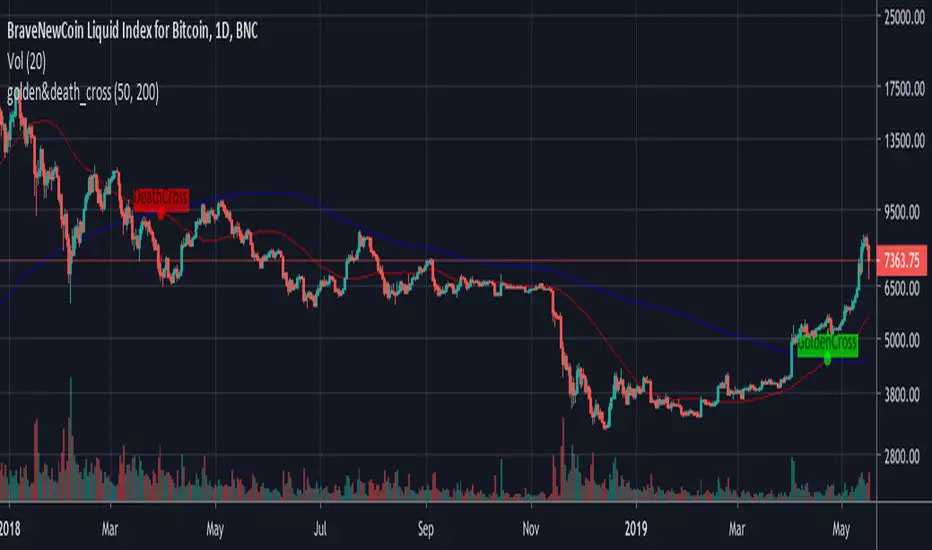
GoldenCross & DeathCrossBNC:BLX
Its a simple Golden- and Death-Cross Indicator BNC:BLX
... it highlights the Crosses and labels them. It also highlights the bar where the cross happend.
Enjoy and buy me a coffee if you liked it.
ETH: 0x4F27c7eC42b898E0B79fA9a35dC9b585e4c56579
Eagle-CrossingThis is Arcane Bears First Script Which charts your Golden Cross and Death Cross, You can update the settings as you see fit!
If you have any questions please join us at www.arcanebear.com


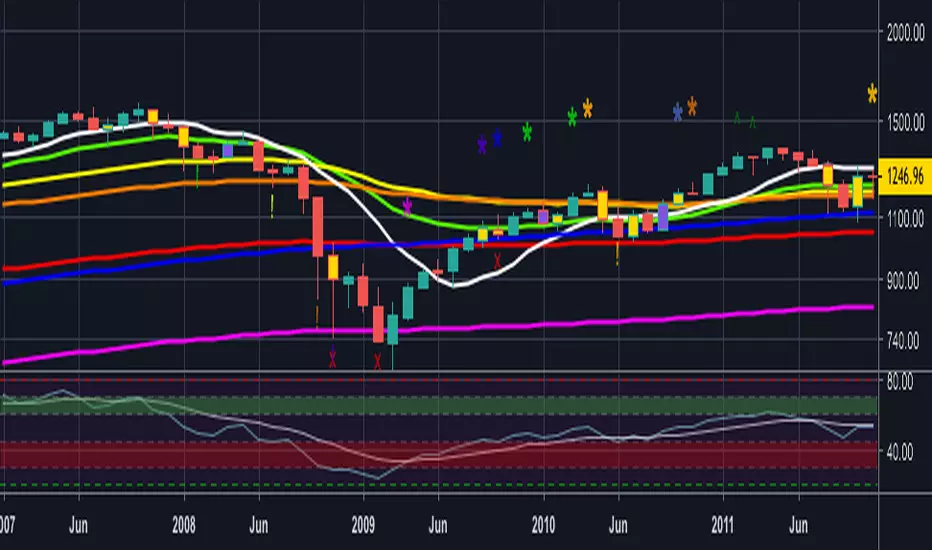
Trabalza Special
EMA/MA crosses
Bullish cross = green "^"
Bearish cross = red "x"
Golden cross (50EMA > 200EMA) = Golden circle
Death cross (50EMA < 200EMA) = Red circle
Rejections
Bullish Wick through support = Gold candle
Bearish Wick through resistance = Purple candle
Bull entries
1st candle to open and close above EMA/MA
marked by "*" above candle, colour co-ordinated to match moving average
Bear entries
1st candle to open and close below an EMA/MA
Marked by "!" below candle, colour co-ordinated to match moving average