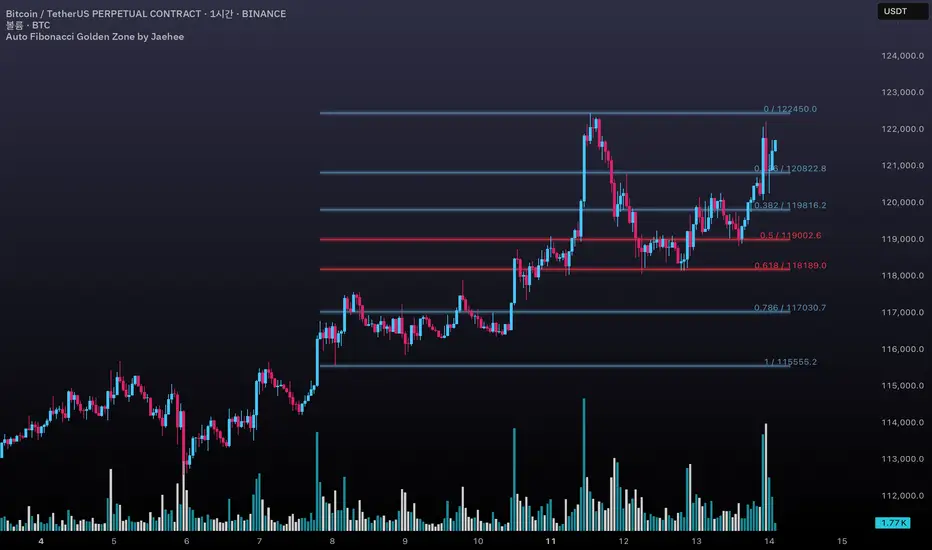
Auto Fibonacci Golden Zone by Jaehee📌 AUTO FIBONACCI GOLDEN ZONE — Auto Swing Detection with Key Level Highlights
WHAT THIS DOES
• Automatically detects the latest swing high and swing low within your chosen lookback range.
• Plots Fibonacci retracement levels: 1.000, 0.786, 0.618, 0.500, 0.382, 0.236, 0.000.
• Highlights 0.618 (“golden pocket”) and 0.500 as high-interest zones.
• Displays ratio + price labels to the right for quick reference without moving the cursor.
HOW IT WORKS
• Scans the last N bars (default 150) to locate the highest high and lowest low.
• Determines swing direction automatically: if the low forms first → up-leg, if the high forms first → down-leg.
• Calculates retracement prices and plots each level with a thin core line plus two glow layers (opacity adjustable).
• Clears and redraws lines and labels whenever a new swing is found — keeping the chart clean.
WHY THIS SETUP
• Saves time compared to manually anchoring Fib tools for each new swing.
• Highlights the golden pocket (0.618) and midpoint (0.500) — zones many traders watch for pullbacks or reactions.
• Positions labels to the right so they never overlap active candles.
HOW IT’S DIFFERENT FROM THE STANDARD FIB TOOL
• Automatic swing detection — no manual point selection.
• Built-in highlight logic for key levels.
• Clean redraw to prevent leftover lines or labels.
• Right-side label offset for readability in volatile price zones.
HOW TO READ IT (CONTEXT ONLY)
• In an up-leg, the 0.382–0.618 zone is often monitored for pullback reactions; 0.500 can act as a midpoint marker.
• In a down-leg, retracements into the 0.382–0.618 zone can be watched for selling pressure.
• Always confirm with structure, volume, and momentum tools — this indicator is not a standalone trade signal.
INPUTS
• Lookback Bars — swing detection range.
• Fib Line Color / Highlight Line Color — control standard vs. key level colors.
• Label Offset Bars — shift labels away from current price.
• Glow 1 & Glow 2 Opacity — adjust background glow visibility.
DESIGN NOTES
• Thin lines for precision, glow layers for visibility without overpowering candles.
• Overlay display — no extra panel needed.
• All elements clear and redraw automatically to avoid clutter.
LIMITATIONS & BEST PRACTICES
• Levels update whenever a new swing forms within the lookback range — historical lines are not fixed.
• Fib retracements are reference zones only, not guarantees of reversal.
• Best used with confluence factors like S/R flips, market structure, and volume analysis.
• No alerts, no performance claims — purely a market context tool.
DEFAULTS & SCOPE
• Works on all OHLCV instruments and timeframes.
• No repainting after swing confirmation.
AUTHOR’S NOTE FOR REVIEW
This is not a repackaged Fib tool. It combines automatic swing detection, golden pocket highlighting, and a clean redraw process to make retracement analysis faster and clearer. It provides context only, with no predictive or performance claims.
Retrações de Fibonacci
🔁 A.X.I.S Fibonacci Engine V2 – Smart Projected Pathway🔁 A.X.I.S Fibonacci Engine V2 – Smart Projected Pathway indicator
The A.X.I.S Fibonacci Engine V2 is a next-generation Fibonacci projection tool designed for traders seeking advanced, adaptive levels that respond to true multi-timeframe market structure. Built from the ground up for active traders—scalpers, swing traders, and position players—it fuses traditional Fibonacci logic with dynamic price projection and smart anchor logic.
How It Works:
Multi-Timeframe Anchoring:
Anchors your Fibonacci levels to High Timeframe (HTF) pivots for powerful bias and “macro” market structure, while also utilizing Low Timeframe (LTF) swing detection for precise “micro” projection and pathway analysis.
Dynamic Pathway Projection:
Beyond static lines, this engine allows Fibonacci levels to be projected forward, following the price path between significant swings—giving you projected targets and active “pathways” instead of just fixed retracement bands.
Trend-Adaptive Logic:
Determines bullish/bearish bias based on where HTF price closes relative to a moving average (HTF EMA-20), meaning the plotted fibs automatically adjust to uptrends or downtrends. No need to guess direction.
Auto-Cleanup & Smart Management:
Old lines and labels are deleted automatically to keep your chart clean, and levels are recalculated with every new significant swing (“leg”)—no manual intervention needed.
Key Features:
Multi-Timeframe Input:
Choose both HTF (for “anchor” pivots) and LTF (for “projection” pivots) independently.
Fine-tune swing sensitivity for both anchors and pathway pivots.
Classic + Projected Mode:
Choose between standard horizontal Fibs or enable Dynamic Pathway Mode to project levels diagonally into future bars, creating “fib pathways.”
Color Customization:
Individualize bullish/bearish fib colors, line style (solid, dashed, dotted), thickness, label position, and transparency.
Special “golden zone” highlighting for the most critical levels (0.618/0.786).
Visual Anchors:
Optionally plot markers for HTF swing pivots for extra clarity.
Chart Cleanliness:
Script manages and deletes its own objects—no more chart clutter!
Real-Time Auto-Update:
All levels and pathways update in real time as market structure changes.
User-Friendly Labels:
Toggle on/off fib level labels, with position and background adjustments.
Practical Trading Applications:
Swing/Position Trading:
Use HTF pivots for macro context, then project LTF fibs into the future for potential reversal/extension targets.
Scalping:
Deploy on lower timeframes with micro pivots for intraday levels and short-term projected moves.
Dynamic Take-Profit & Entry Zones:
Identify evolving TP and re-entry zones as price carves out new swings, even in choppy or trending conditions.
Trend Confirmation:
Let the engine determine trend direction, so your fibs are always aligned with prevailing momentum.
How to Use:
Add to Chart:
Apply the indicator to any chart or timeframe.
Set Your Anchors:
Pick the HTF (anchor) and LTF (projection) timeframes.
Adjust swing sensitivity (lookback) as needed.
Enable/Disable Dynamic Pathway:
For regular fibs, leave off.
For projected “pathways,” turn it ON—lines will project forward along the likely path of the next move.
Adjust Colors, Labels, and Styles:
Fine-tune everything for clarity and your personal style.
Watch for Changes:
As new pivots form, the script will update levels in real time, keeping your roadmap fresh.
(Optional) Show Macro Swings:
Toggle on/off to plot markers for the most recent HTF pivots.
Who Is It For?
Day traders, scalpers, and swing traders wanting true projected price targets—not just static fibs.
Traders tired of redrawing fibs after every new swing.
Anyone who wants a clean, dynamic, and truly adaptive fib tool that blends macro and micro market structure into one engine.
What Makes It Different?
True multi-timeframe awareness:
Adapts to both macro (HTF) and micro (LTF) structure.
Automatic trend recognition:
Fibs align with price action—no manual flipping.
Projected, not just static:
See where fib levels could land, not just where they were.
Cleanest chart management:
Deletes its own lines and labels on every update—no mess, ever.
Note:
This tool is for educational and informational purposes only. Not financial advice. Always use proper risk management!
Any issues or feature requests? Drop a comment below or reach out!
Happy trading and welcome to the A.X.I.S revolution.
— I5X-Albatross

Smart Money Trap Scanner [TradingFinder]🔵 Introduction
In many market conditions, what initially seems to be a decisive breakout often turns out to be nothing more than a false breakout or fake move. Price breaks through a significant structural level, such as a swing high or low or a key support and resistance zone, only to quickly return to its previous range. These moves, often driven by liquidity traps or market manipulation, typically signal structural weakness rather than the start of a new trend.
This screener is specifically designed to detect such situations. It focuses on identifying false breakouts and price returns to broken levels within a defined time window, and then looks for retracements into the Fibonacci zone. If price reenters the 0.618 to 1.0 retracement area and aligns with the time-based filters, the system flags a low-risk, high-probability entry opportunity.
To enhance the precision of signal detection, the screener categorizes setups into two distinct types based on the speed of the price reaction after a breakout. Type A signals occur when the price breaks a level and immediately returns to break-even within the very next candle indicating a sharp rejection and rapid invalidation of the breakout. In contrast, Type B signals involve a more gradual return to the broken level, typically taking between two to five candles. This differentiation allows traders to better assess the context and urgency of each trap, providing a clearer understanding of momentum and liquidity behavior behind the move.
Additionally, the screener includes a Signal Age feature, which displays how much time has passed since the last valid signal was generated. This allows traders to quickly assess signal freshness and avoid acting on outdated setups, especially in fast-moving market environments.
One of the key advantages of this tool is its ability to simultaneously scan multiple symbols and timeframes. It only triggers an alert when all conditions false breakout, structural return, and Fibonacci alignment are met. This allows traders to bypass the need for manually reviewing dozens of charts and instead concentrate on clean, valid, and structure-based setups with greater precision.
🔵 How to Use
This tool operates as a structure-based screener that continuously scans various symbols and timeframes. By combining price behavior analysis, structural breakout detection, and Fibonacci retracement zones, it only signals entries when the probability of reversal is significantly supported by liquidity logic and price correction depth.
The system doesn’t just monitor price movements beyond key levels like swing highs or lows. It also evaluates whether the move quickly reverses and absorbs liquidity. If so, Fibonacci is applied to measure the depth of the pullback and identify the most favorable entry zones.
🟣 Long Signal
A long setup is triggered when price temporarily breaks below a valid structural support or swing low. This initial move is typically designed to trigger stop losses and collect sell-side liquidity. If price returns to the broken level within five candles, it is considered a false breakout.
At this point, Fibonacci is drawn from the recent swing high to the new low. If price enters the 0.618 to 1.0 retracement zone within the next ten candles, a potential long entry aligned with Smart Money logic is activated. This deep retracement zone often offers the best low-risk entry, as it typically marks the area where liquidity has been absorbed and the breakout structure has failed.
The stop loss is placed slightly below the 1.0 level to account for minor fluctuations, while the target is set based on trend structure or risk-reward preferences.
🟣 Short Signal
A short setup begins with price temporarily breaking above a valid resistance or swing high. This breakout is often driven by buy-side liquidity collection or stop hunting. If price returns to the broken level within five candles, the move is marked as a breakout failure.
Fibonacci is then drawn from the recent swing low to the new high. If price enters the 0.618 to 1.0 zone within ten candles after the return, a short opportunity is confirmed. This area usually represents the maximum acceptable retracement before a continuation move to the downside and often triggers strong reactions.
The stop loss is placed just above the 1.0 level, and the target is defined based on the expected structure of the move or a predetermined reward ratio.
🟡 Advantages of the Screener
Unlike manual approaches that require constant monitoring of multiple charts, this tool functions as a fully automated screener across multiple symbols and timeframes. It continuously evaluates key levels, liquidity reactions, structural returns, and Fibonacci zones. An alert is only generated when all necessary conditions are met with high accuracy.
This ensures that traders avoid risky or misleading entries and stay focused on precise, verified, and logic-based setups — saving time, reducing noise, and improving consistency in decision-making.
🔵 Settings
🟣 Logical settings
Swing period : You can set the swing detection period.
Valid After Trigger Bars : Limits how many candles after a fake breakout the entry zone remains valid.
Max Swing Back Method : It is in two modes "All" and "Custom". If it is in "All" mode, it will check all swings, and if it is in "Custom" mode, it will check the swings to the extent you determine.
Max Swing Back : You can set the number of swings that will go back for checking.
🟣 Display Settings
Table on Chart : Allows users to choose the position of the signal dashboard either directly on the chart or below it, depending on their layout preference.
Number of Symbols : Enables users to control how many symbols are displayed in the screener table, from 10 to 20, adjustable in increments of 2 symbols for flexible screening depth.
Table Mode : This setting offers two layout styles for the signal table :
Basic : Mode displays symbols in a single column, using more vertical space.
Extended : Mode arranges symbols in pairs side-by-side, optimizing screen space with a more compact view.
Table Size : Lets you adjust the table’s visual size with options such as: auto, tiny, small, normal, large, huge.
Table Position : Sets the screen location of the table. Choose from 9 possible positions, combining vertical (top, middle, bottom) and horizontal (left, center, right) alignments.
🟣 Symbol Settings
Each of the 10 symbol slots comes with a full set of customizable parameters :
Symbol : Define or select the asset (e.g., XAUUSD, BTCUSD, EURUSD, etc.).
Timeframe : Set your desired timeframe for each symbol (e.g., 15, 60, 240, 1D).
🟣 Alert Settings
Alert : Enables alerts for SMT Screener.
Message Frequency : Determines the frequency of alerts. Options include 'All' (every function call), 'Once Per Bar' (first call within the bar), and 'Once Per Bar Close' (final script execution of the real-time bar). Default is 'Once per Bar'.
Show Alert Time by Time Zone : Configures the time zone for alert messages. Default is 'UTC'.
🔵 Conclusion
Many trading mistakes stem from misinterpreting price breaks and entering too early into deceptive moves. In a market environment where false breakouts, liquidity traps, and engineered movements are increasingly common, having a tool that accurately filters these events and frames them within a Fibonacci-based and time-filtered structure provides a real strategic edge.
This indicator merges market structure logic, false breakout detection, and precise retracement analysis to ensure trades are only taken when multiple technical factors are aligned. It not only enhances trade success rates but also helps avoid emotional or impulsive entries.
Moreover, with the ability to scan across several symbols and timeframes simultaneously, the tool goes beyond being just an indicator it becomes a semi-automated structural analysis system. For traders who base their decisions on price behavior, Smart Money logic, and structural retracements, this screener can become a key component of a disciplined and effective trading approach.
Script pago

ICT Smart Money Trading Suite [SwissAlgo]ICT/Smart Money Trading Suite - Technical Analysis Indicator
----------------------------------------------------------
OVERVIEW
The ICT/Smart Money Trading Suite is a technical analysis indicator that implements concepts from Inner Circle Trader (ICT) methodology and Smart Money Concepts (SMC).
ICT methodology was developed by Michael J. Huddleston (ICT) and focuses on understanding Institutional market behavior.
Smart Money Concepts builds upon these ideas to analyze how large Financial Institutions and/or Market Makers seem to operate in the markets.
This indicator combines multiple analytical tools into a single package for market structure analysis, imbalance detection, and the observation of institutional order flow.
----------------------------------------------------------
CORE COMPONENTS
Market Structure Analysis:
- External Structure : Major swing highs and lows that define broader price movement (these are the most significant structural points that institutions reference for their positioning and typically require substantial volume and momentum to break)
- Internal Structure : Shorter-term pivots showing micro-trend developments within the External Structure (these internal pivot highs and lows often represent areas where retail traders may be positioned on the wrong side of the market as they frequently form just before major structural breaks or trend continuations, creating liquidity that institutions can utilize)
- Structural Breakout Detection : Identification of structure breaks and potential trend changes ( 'Change of Character' which occurs when the External Structure shifts from bullish to bearish bias or vice-versa indicating a potential major trend reversal, and 'Break of Structure' which happens when price decisively takes out previous significant highs in a bearish trend or previous significant lows in a bullish trend confirming trend continuation or acceleration)
- EMA Cloud : Dynamic support and resistance zones with trend context (additional reference point)
Imbalance Zone Detection:
Fair Value Gaps (FVGs):
Price inefficiencies that occur between candles when sudden price moves create gaps in price delivery
Typically formed when the low of a bullish candle is higher than the high of the candle two periods prior, or when the high of a bearish candle is lower than the low of the candle two periods prior
These gaps represent areas where price moved too quickly without adequate two-way auction process
Institutions may return to fill these inefficiencies at a later time for proper price discovery
The theory suggests that all price ranges should eventually be traded through to complete the auction process
Gaps are automatically removed from the chart when price fully retraces back through the inefficient area
Order Blocks (OBs):
Specific candles that occur immediately before significant market moves and represent institutional decision points
Identified as the last opposing candle before a strong directional move (final bearish candle before major bullish move or final bullish candle before major bearish move)
These candles contain the orders and liquidity that institutions used as a foundation for their market manipulation
Represent areas where large institutional players positioned themselves to move the market significantly
Price may return to these levels to collect additional liquidity or test institutional resolve
The candle's full range (high to low) is considered the active zone where institutional interest may remain
Vector Candle Recovery:
Zones created by high-activity candles that demonstrate unusually large range and volume characteristics
These candles are interpreted as manipulative price pushes designed to hunt liquidity and trigger stop losses
Often used by institutions to induce retail traders into poor positions before reversing direction
Recovery zones represent the full range of these vector candles where price may retrace
The concept assumes that extreme moves often get partially retraced as the market corrects from artificial price displacement
Zones are invalidated when a significant portion of the vector candle range is retraced (typically 50% or more)
Support & Resistance:
Key price zones based on historical price reactions and pivot clustering analysis
Calculated through algorithmic identification of areas where price has repeatedly found buyers (support) or sellers (resistance)
Strength is determined by the number of times price has reacted from these levels and the volume of activity at these zones
Represent psychological and algorithmic reference points where institutional systems are likely to place orders
Create areas of increased probability for price reactions due to concentration of pending orders and decision-making activity
Zones are color-coded based on current price position: green for support (price above), red for resistance (price below), yellow for neutral (price within)
Liquidity Analysis:
- Liquidity Pools : Areas above or below key levels where stop orders may cluster
- Kill Zones : Time-based periods associated with increased market activity
- Daily/Weekly/Monthly Price Levels : Key institutional reference points (price highs/lows)
Vector Candles/Price Manipulation:
Advanced algorithm identifying statistically significant candles using volume delta analysis, range statistics, and persistence scoring.
----------------------------------------------------------
VISUAL INTERPRETATION - DETAILED GUIDE
MARKET STRUCTURE
External Structure (Thick Lines):
- Green thick lines: Major support levels (external lows) that define bullish structure
- Red thick lines: Major resistance levels (external highs) that define bearish structure
- These lines represent significant swing points that institutions may reference
- Lines extend from the swing point and update as the structure evolves
Internal Structure (Thin Lines):
- Green thin lines: Minor support levels showing internal market structure
- Red thin lines: Minor resistance levels showing internal market structure
- More frequent updates than external structure, showing micro-trend changes
Structure Markers:
- Small triangles with "H": External pivot highs (major resistance points)
- Small triangles with "L": External pivot lows (major support points)
- Small dots: Internal pivot points (minor structure without text)
- Markers appear with a 20-bar delay to confirm pivot validity
HIGHS/LOWS LEVELS
Daily Levels (Green Dashed Lines):
- Horizontal dashed lines marking the previous day's high and low
- Updates at the start of each new trading day
- Gradient effect shows historical importance (newer = more opaque)
- Acts as institutional reference points for intraday trading
Weekly Levels (White Dashed Lines):
- Horizontal dashed lines marking the previous week's high and low
- Updates at the start of each new trading week
- Typically more significant than daily levels for swing trading
- Often respected by institutional algorithms
Monthly Levels (Orange Dashed Lines):
- Horizontal dashed lines marking the previous month's high and low
- Updates at the start of each new trading month
- Highest significance levels for long-term institutional positioning
- Major psychological and algorithmic reference points
VECTOR CANDLES
Candle Body Coloring System:
- Lime Green Bodies: Ultra-bullish vector candles (Z-score ≥ 3.0)
- Blue Bodies: Abnormal bullish vector candles (Z-score 2.0-2.99)
- Bright Red Bodies: Ultra-bearish vector candles (Z-score ≥ 3.0)
- Purple Bodies: Abnormal bearish vector candles (Z-score 2.0-2.99)
- Faded Green/Red: Normal market activity candles
Vector Identification Criteria:
- Statistical significance based on range and volume delta
- Persistence scoring (how much directional pressure remained)
- ATR-based absolute detection (candles >2x ATR automatically qualify)
- These candles often precede significant market moves or reversals
EMA CLOUD
Purple Cloud Visualization:
- Central line: 50-period EMA (blue line)
- Upper boundary: EMA + dynamic standard deviation band
- Lower boundary: EMA - dynamic standard deviation band
- Cloud fill: Purple semi-transparent area between boundaries
Interpretation:
- Price above cloud: Bullish bias context
- Price below cloud: Bearish bias context
- Price within cloud: Neutral/transitional zone
- Cloud thickness adapts to market volatility automatically
KILL ZONES
Background Highlighting:
- Yellow background tint during active kill zone periods
- London Session: 08:00-11:00 (UTC+1 time)
- NY Open: 13:00-16:00 (UTC+1 time)
- NY Close: 19:00-21:00 (UTC+1 time)
- Times automatically adjust to the chart timezone
Purpose:
- Highlights periods of typically increased institutional activity
- Times when liquidity hunting and manipulation often occur
- Periods when significant directional moves frequently begin
IMBALANCE ZONES - DETAILED BREAKDOWN
Fair Value Gaps (FVGs):
- Green boxes: Bullish FVGs (gap between bear candle high and bull candle low)
- Red boxes: Bearish FVGs (gap between bull candle high and bear candle low)
- Gray dotted lines: Midpoint of each gap (50% retracement level)
- Text label: "Fair Value Gap" in top-right corner
- Auto-removal: Boxes disappear when the price fills the gap
Order Blocks (OBs):
- Green boxes: Bullish order blocks (demand zones from the last bear candle before bullish vector)
- Red boxes: Bearish order blocks (supply zones from the last bull candle before the bearish vector)
- Gray dotted lines: Midpoint of each order block
- Text label: "OB" in top-right corner
- Invalidation: Boxes removed when price breaks below (bull OB) or above (bear OB)
Vector Candles Recovery Zones:
- Green boxes: Recovery zones after bullish vector candles
- Red boxes: Recovery zones after bearish vector candles
- Gray dotted lines: Midpoint of the vector candle range
- Text label: "Vector Recovery" on the right side
- These mark the full range of significant vector candles where retracements may occur
Support & Resistance Zones:
- Green boxes: Support zones (price currently above the zone)
- Red boxes: Resistance zones (price currently below the zone)
- Yellow boxes: Neutral zones (price within the zone)
- Text labels: "Support", "Resistance", or "Support/Resistance"
- Based on historical pivot clustering and strength analysis
Liquidity Pools:
- Green boxes: Bullish liquidity pools (below recent lows where buy stops cluster)
- Red boxes: Bearish liquidity pools (above recent highs where sell stops cluster)
- Gray dotted lines: Key liquidity level within the pool
- Text label: "Liquidity Pool" on the right side
- Zones where institutional players may hunt stop losses before reversing
----------------------------------------------------------
CALCULATION METHODOLOGY
Vector Candle Algorithm:
- Statistical Analysis using 48-bar lookback period
- Z-score thresholds: 2.0 (abnormal), 3.0 (ultra)
- ATR-based significance filtering
- Volume Delta Integration with lower timeframe analysis
- Persistence scoring based on directional pressure sustainability
- Combined scoring system (delta + range)
- Absolute Vector Detection for candles exceeding 2x ATR
Market Structure Parameters:
- Swing Size: 20-period pivot detection
- Breakout Threshold: 3 consecutive breaks for structure confirmation
- EMA Length: 50-period with dynamic cloud sizing
Fair Value Gap Detection:
- Auto Threshold: Dynamic gap sizing based on asset volatility
- Manual Threshold: User-defined minimum gap percentage
- Mitigation Logic: Automatic removal when price fills gaps
----------------------------------------------------------
TARGET USERS
This indicator is designed for traders who:
- Study Inner Circle Trader concepts
- Apply Smart Money Concepts in their analysis
- Focus on market structure and institutional behavior
- Seek confluence-based trading approaches
- Use higher timeframe bias for decision making
Experience Level: Intermediate to Advanced
Requires understanding of market structure concepts and institutional trading theory.
Recommended Timeframes:
- Analysis: 4H, Daily for market structure context
- Execution: 1H, 15min for entry timing
- Lower timeframes: With higher timeframe alignment
----------------------------------------------------------
CUSTOMIZATION OPTIONS
Display Controls:
- Master toggle for all imbalance zones
- Individual controls for each concept type
- Market structure line visibility
- Kill zone highlighting
- EMA cloud display
Visual Settings:
- Automatic light/dark mode color adaptation
- Adjustable zone transparency levels
- Extension distance controls
- Descriptive text labels
Technical Parameters:
- Vector candle sensitivity thresholds
- Historical analysis lookback periods
- Maximum zone display limits
- Zone invalidation conditions
----------------------------------------------------------
EDUCATIONAL BACKGROUND
Inner Circle Trader (ICT): A trading methodology developed by Michael J. Huddleston that focuses on understanding how institutional traders and market makers operate. The approach emphasizes market structure, liquidity concepts, and timing based on institutional behavior patterns.
Smart Money Concepts (SMC): An evolution of ICT principles that analyzes how large financial institutions move markets. These concepts include order blocks, fair value gaps, liquidity hunting, and market structure shifts.
Both methodologies are based on the premise that understanding institutional trading behavior can provide insights into market direction and timing.
----------------------------------------------------------
IMPORTANT DISCLAIMERS
This indicator is provided for educational and analytical purposes only. It is not financial advice and does not guarantee trading results.
Trading involves substantial risk of loss. Past performance does not indicate future results. Users should thoroughly understand the underlying concepts before applying them to live trading.
The effectiveness of these analytical methods may vary across different market conditions, timeframes, and instruments. Proper risk management and additional analysis are essential.
This indicator is a tool for market analysis, not a complete trading system. Success requires understanding of market principles, risk management, and continuous learning.
Always test analytical approaches thoroughly using historical data and demo accounts before implementing with real capital.

Fibonacci Range Detector ║ BullVision🔬 Overview
The Fibonacci Range Mapper is a dynamic technical tool designed to identify, track, and visualize price ranges using Fibonacci levels. Whether you're trading manually or prefer automated structure recognition, this indicator helps you contextualize market moves and locate key price zones with precision.
⚙️ Core Logic
🔍 Range Detection (Auto & Manual Modes)
In Auto mode, the indicator uses an advanced ZigZag system based on ATR or percentage thresholds to confirm market swings and construct Fibonacci-based ranges.
In Manual mode, traders can define their own swing low and high to generate precise custom ranges.
📐 Fibonacci Mapping
Each detected range is automatically plotted with key Fibonacci retracement levels — 0%, 25%, 50%, 75%, 100% — along with optional extensions (127.2% and 161.8%) to anticipate price continuations or reversals.
📋 Live Data Table
An integrated info panel dynamically displays crucial metrics:
• Range size
• Current price zone (Discount / Mid / Premium)
• Position within range (%)
• Distance to range extremes
• Range status (Pending or Confirmed)
🕰️ Historical Memory
Up to 20 past ranges can be stored and visualized simultaneously, helping traders recognize repeated price behaviors and contextual support/resistance levels.
🎨 Visual Highlights
Zones of interest (0–25% = Discount, 75–100% = Premium) are color-coded with custom transparency, and labels can be toggled for clarity. The current active range updates in real time as structure evolves.
🔧 User Customization
• Detection Method: Choose between ATR or % ZigZag for automated swing identification
• Confirmation Delay: Set how many bars to wait before confirming a new high
• Manual Overrides: Select exact price levels when you want full control
• Extensions & Labels: Toggle additional lines and info to suit your charting style
• Visual Table Position: Customize where the data table appears on screen
• Color Scheme: Define your own zone gradients for better visual interpretation
📈 Use Cases
This indicator is ideal for traders who want to:
• Identify value zones within local or macro price structures
• Plan trades around Fibonacci retracement and extension levels
• Detect shifts in market structure using an adaptive ZigZag logic
• Track recurring price ranges and historical reaction points
• Enhance technical confluence with clean, visual price mapping
⚠️ Important Notes
This tool is not a buy/sell signal generator — it is a visual framework for structure-based analysis.
Use it in conjunction with your existing strategy and risk management process.
Always confirm with broader context and multi-timeframe alignment.

52SIGNAL RECIPE VWAP Quantum Matrix Pro═══52SIGNAL RECIPE VWAP Quantum Matrix Pro ═══
◆ Overview
52SIGNAL RECIPE VWAP Quantum Matrix Pro is an advanced technical indicator based on Volume Weighted Average Price (VWAP), integrating volatility-adjusted bands and Fibonacci levels to provide multi-dimensional analysis of price movements.
It automatically applies optimized lookback periods for different timeframes, providing customized analysis for various trading styles, and helps traders effectively identify critical support/resistance zones through precise price level identification.
─────────────────────────────────────
◆ Key Features
• **Adaptive VWAP Bands**: Automatically adjusting upper and lower bands based on market volatility
• **Fibonacci Integration**: Fibonacci levels (23.6%, 38.2%, 50%, 61.8%, 78.6%) extended around VWAP center
• **Timeframe Optimization**: Automatic lookback period adjustment for each chart cycle
• **Pivot Point Analysis**: Core support/resistance levels based on volume-weighted highs and lows
• **Precision Labeling**: Accurate numerical display for all major price levels
• **Visual Gradation**: Intuitive visualization through color gradation for each Fibonacci level
─────────────────────────────────────
◆ Technical Foundation
■ VWAP Calculation Principles
• **Volume Weighting**: Calculation of real equilibrium price considering volume rather than simple price averaging
• **Standard Deviation Bands**: Statistical fluctuation range setting around VWAP center
• **Volatility Adjustment Mechanism**: Dynamic band width adjustment using current ATR to historical ATR ratio
• **Precise Price Range**: Identification of highest/lowest price range within specified lookback period
■ Fibonacci Band Implementation
• **VWAP-Centered Extension**: Division of distance from centerline (VWAP) to standard deviation bands by Fibonacci ratios
• **Symmetrical Upper/Lower Structure**: Application of identical Fibonacci ratios in both upward and downward directions
• **Color Gradation**: Progressive color changes for each Fibonacci level providing visual depth
─────────────────────────────────────
◆ Practical Applications
■ Price Movement Interpretation
• **Central Reference Point**:
▶ VWAP serves as intraday/period equilibrium price providing balance point of buying/selling pressure
▶ Movement above/below VWAP can be interpreted as short-term bullish/bearish signals
• **Band Reaction Patterns**:
▶ Reaching outer bands (100%) signals overbought/oversold conditions
▶ Reaction patterns between Fibonacci levels provide basis for trend strength and persistence judgment
■ Trading Strategy Utilization
• **Range-bound Trading**:
▶ Short-term trading utilizing bounce patterns between Fibonacci levels
▶ Oscillation trading between centerline (VWAP) and Fibonacci levels
• **Trend Following Strategy**:
▶ Breakout of Fibonacci levels aligned above/below VWAP signals trend strengthening
▶ Strong momentum confirmation when re-entering after outer band breakout
─────────────────────────────────────
◆ Advanced Configuration Options
■ Input Parameter Guide
• **Base Standard Deviation** (Default: 2.0)
▶ 1.0-1.5: Narrow bands, suitable for short-term trading
▶ 1.8-2.2: Balanced bands, optimal for general market conditions
▶ 2.5-3.0: Wide bands, suitable for long-term positions
• **Maximum/Minimum Standard Deviation** (Default: 3.0/1.0)
▶ Maximum: Cryptocurrency (4.0), Stocks/Forex (3.0), Low volatility (2.5)
▶ Minimum: Intraday trading (0.8), General (1.0), Long-term (1.5)
• **Volatility Measurement Period** (Default: 20)
▶ Short-term (10-14): Fast response, intraday trading
▶ Medium-term (15-25): Balanced response, swing trading
▶ Long-term (30-50): Noise filtering, long-term investment
• **Use Volatility Adjustment** (Default: On)
▶ On: Automatic band width adjustment based on current market volatility (recommended)
▶ Off: Fixed standard deviation bands usage
■ Timeframe-Specific Optimal Settings
• **Intraday Trading** (15min-1hr): Base standard deviation 1.8, volatility period 14
• **Swing Trading** (4hr-daily): Base standard deviation 2.0, volatility period 20
• **Position Trading** (daily-weekly): Base standard deviation 2.5, volatility period 30
■ Market-Specific Optimal Settings
• **Stock Market**: Base standard deviation 2.0, volatility period 20
• **Forex Market**: Base standard deviation 1.8, volatility period 25
• **Cryptocurrency Market**: Base standard deviation 2.5, volatility period 14, maximum standard deviation 4.0
─────────────────────────────────────
◆ Synergy with Other Indicators
• **Moving Averages**: VWAP and major moving average crossovers strengthen trend reversal signals
• **RSI/Stochastic**: Combination of VWAP band reactions in overbought/oversold zones improves reversal signal accuracy
• **Bollinger Bands**: VWAP Quantum Matrix and Bollinger Band convergence/divergence patterns are useful for volatility change prediction
• **Fibonacci Retracement**: Strong support/resistance formation when trend-direction Fibonacci retracement matches VWAP Fibonacci levels
• **Horizontal Support/Resistance**: Reaction probability significantly increases when past important price levels match VWAP Fibonacci levels
─────────────────────────────────────
◆ Conclusion
VWAP Quantum Matrix Pro provides deep insights into price action by integrating volatility-adjusted bands and Fibonacci theory into traditional VWAP analysis.
It dynamically responds to market environment changes through volume weighting and volatility adaptation mechanisms, and can be flexibly applied to various trading styles through timeframe-optimized lookback period settings.
Through appropriate input parameter configuration, the indicator can be optimized to match each trader's style and objectives, and through combination with other technical indicators, it strengthens confidence in trading decisions, ultimately enabling more precise and systematic market approaches.
─────────────────────────────────────
※ Disclaimer: Past performance does not guarantee future results. Always use appropriate risk management strategies.
═══52SIGNAL RECIPE VWAP Quantum Matrix Pro ═══
◆ 개요
52SIGNAL RECIPE VWAP Quantum Matrix Pro는 거래량 가중 평균 가격(VWAP)을 기반으로 하는 고급 기술적 지표로, 변동성 조정 밴드와 피보나치 레벨을 통합하여 가격 움직임을 다차원적으로 분석합니다.
타임프레임별로 최적화된 룩백 기간을 자동 적용하여 다양한 거래 스타일에 맞춤화된 분석을 제공하며, 정밀한 가격 레벨 식별을 통해 트레이더가 중요한 지지/저항 구간을 효과적으로 파악할 수 있도록 돕습니다.
─────────────────────────────────────
◆ 주요 특징
• **적응형 VWAP 밴드**: 시장 변동성에 따라 자동으로 조정되는 상하단 밴드 제공
• **피보나치 통합**: VWAP 중심으로 피보나치 레벨(23.6%, 38.2%, 50%, 61.8%, 78.6%) 확장
• **타임프레임 최적화**: 각 차트 주기에 맞춰 자동으로 룩백 기간 조정
• **피봇 포인트 분석**: 거래량 가중 고저가 기반의 핵심 지지/저항 레벨 표시
• **정밀 레이블링**: 모든 주요 가격 레벨에 정확한 수치 표시
• **시각적 그라데이션**: 피보나치 레벨별 컬러 그라데이션으로 직관적인 시각화
─────────────────────────────────────
◆ 기술적 기반
■ VWAP 계산 원리
• **거래량 가중치**: 단순 가격 평균이 아닌 거래량을 고려한 실질적 균형 가격 계산
• **표준편차 밴드**: VWAP 중심으로 통계적 변동 범위 설정
• **변동성 조정 메커니즘**: 현재 ATR과 과거 ATR 비율을 활용한 동적 밴드폭 조정
• **정밀 가격 범위**: 지정된 룩백 기간 내 최고/최저 가격 범위 식별
■ 피보나치 밴드 구현
• **VWAP 중심 확장**: 중심선(VWAP)에서 표준편차 밴드까지의 거리를 피보나치 비율로 분할
• **상하단 대칭 구조**: 상승과 하락 방향으로 동일한 피보나치 비율 적용
• **색상 그라데이션**: 피보나치 레벨별 점진적 색상 변화로 시각적 깊이감 제공
─────────────────────────────────────
◆ 실용적 응용
■ 가격 움직임 해석
• **중심 기준점**:
▶ VWAP은 일중/기간 내 균형가격으로 매수/매도 압력의 균형점 제공
▶ VWAP 위/아래 움직임은 단기 강세/약세 신호로 해석 가능
• **밴드 반응 패턴**:
▶ 외부 밴드(100%)에 도달 시 과매수/과매도 상태 시그널
▶ 피보나치 레벨 간 반응 패턴은 추세 강도와 지속성 판단 근거
■ 트레이딩 전략 활용
• **범위 내 거래**:
▶ 피보나치 레벨 간 바운스 패턴 활용한 단기 매매
▶ 중심선(VWAP)과 피보나치 레벨 간 오실레이션 거래
• **추세 추종 전략**:
▶ VWAP 위/아래 정렬된 피보나치 레벨 돌파는 추세 강화 신호
▶ 외부 밴드 돌파 후 다시 진입 시 강한 모멘텀 확인
─────────────────────────────────────
◆ 고급 설정 옵션
■ 인풋 파라미터 가이드
• **기본 표준 편차 (Base Standard Deviation)** (기본값: 2.0)
▶ 1.0-1.5: 좁은 밴드, 단기 거래에 적합
▶ 1.8-2.2: 균형 잡힌 밴드, 일반적 시장 환경에 최적
▶ 2.5-3.0: 넓은 밴드, 장기 포지션에 적합
• **최대/최소 표준 편차 (Maximum/Minimum Standard Deviation)** (기본값: 3.0/1.0)
▶ 최대: 암호화폐(4.0), 주식/외환(3.0), 저변동성(2.5)
▶ 최소: 일중 거래(0.8), 일반(1.0), 장기(1.5)
• **변동성 측정 기간 (Volatility Measurement Period)** (기본값: 20)
▶ 단기(10-14): 빠른 반응, 일중 거래
▶ 중기(15-25): 균형 잡힌 반응, 스윙 트레이딩
▶ 장기(30-50): 노이즈 필터링, 장기 투자
• **변동성 조정 사용 (Use Volatility Adjustment)** (기본값: 켜짐)
▶ 켜짐: 현재 시장 변동성에 따라 밴드 폭 자동 조정 (권장)
▶ 꺼짐: 고정된 표준편차 밴드 사용
■ 타임프레임별 최적 설정
• **일중 거래** (15분-1시간): 기본 표준편차 1.8, 변동성 기간 14
• **스윙 트레이딩** (4시간-일봉): 기본 표준편차 2.0, 변동성 기간 20
• **포지션 트레이딩** (일봉-주봉): 기본 표준편차 2.5, 변동성 기간 30
■ 시장별 최적 설정
• **주식 시장**: 기본 표준편차 2.0, 변동성 기간 20
• **외환 시장**: 기본 표준편차 1.8, 변동성 기간 25
• **암호화폐 시장**: 기본 표준편차 2.5, 변동성 기간 14, 최대 표준편차 4.0
─────────────────────────────────────
◆ 다른 지표와의 시너지
• **이동평균선**: VWAP과 주요 이동평균선 교차는 추세 전환 신호 강화
• **RSI/스토캐스틱**: 과매수/과매도 구간에서 VWAP 밴드 반응과 결합 시 반전 신호 정확도 향상
• **볼린저 밴드**: VWAP Quantum Matrix와 볼린저 밴드 수렴/발산 패턴은 변동성 변화 예측에 유용
• **피보나치 리트레이스먼트**: 추세 방향 피보나치 리트레이스먼트와 VWAP 피보나치 레벨 일치 시 강력한 지지/저항 형성
• **수평 지지/저항**: 과거 중요 가격대와 VWAP 피보나치 레벨 일치 시 반응 확률 대폭 증가
─────────────────────────────────────
◆ 결론
VWAP Quantum Matrix Pro는 전통적인 VWAP 분석에 변동성 조정 밴드와 피보나치 이론을 통합하여 가격 행동에 대한 깊이 있는 통찰력을 제공합니다.
거래량 가중치와 변동성 적응 메커니즘을 통해 시장 환경 변화에 동적으로 대응하며, 타임프레임별 최적화된 룩백 기간 설정으로 다양한 거래 스타일에 유연하게 적용할 수 있습니다.
적절한 인풋 파라미터 설정을 통해 각 트레이더의 스타일과 목표에 맞게 지표를 최적화할 수 있으며, 다른 기술적 지표들과의 조합을 통해 트레이딩 결정에 대한 확신을 강화하고, 궁극적으로 더 정밀하고 체계적인 시장 접근을 가능하게 합니다.
─────────────────────────────────────
※ 면책 조항: 과거 성과가 미래 결과를 보장하지 않습니다. 항상 적절한 리스크 관리 전략을 사용하세요.

Fibonacci retracementHi all!
This indicator will show you the most recent Fibonacci retracement in the current trend. So if the trend is bullish the Fibonacci retracement will be drawn from swing low to high and from swing high to low in a bearish trend.
The uniqueness in this script lies in the adaptation to trend. To only plot the Fibonacci retracements according to the current market trend.
The trend is determined through break of structures (BOS) and change of characters (CHoCH). A change of character can be of type change of character plus (with a failed swing) and will then be shown as CHoCH+. This is possible through my library 'MarketStructure' (). It only uses break of structures and change of characters to be able to determine the trend, if you want a more detailed picture of the market structure you can use my script 'Market structure' ().
History and what to look for
Fibonacci retracement levels are used by many traders and are levels that are not Fibonacci sequence numbers themselves but they deriver from them. Some examples are:
23,6% - Divide a number by one three places ahead (e.g. 13/55)
38,2% - Divide a number by the one two places ahead (e.g. 21/55)
50% - Not from the Fibonacci sequence, but it's a number that price has reacted from in the past. Markets tend to retrace half a move before continuing
61,8% - The "golden retracement level". It derives from the "golden ratio" and is a core component of the Fibonacci sequence. The further you go in the Fibonacci sequence the preceding number divided by the current number will get closer and closer to this "golden ratio". This level is considered the most important Fibonacci retracement level by many traders
78,6% - Square root of 61.8%. This is often considered a deep correction (but not a trend reversal) and are often used for late entries
These levels are considered "key" and most significant. You want to look for a retracement of the price (down in a bullish trend and up in a bearish trend) to give you good entries.
Settings
For the trend you can set the pivot/swing lengths (right and left) and use the checkbox if you want these pivots to have labels. This can be done in the 'Market strucure' section.
In the 'Fibonacci retracement' section there is settings for the actual Fibonacci retracement. You can enable the trendline, set the color and the style of it. You can select which levels that should be shown by the indicator. There are 11 levels enabled by default, they are; 0-4.236. All settings in this section tries to be as similar to the "Fib Retracement" tool in Tradingview. You can also select the style of these lines (solid, dashed or dotted) and if you want them to extend to the right or not.
After this you can select if the Fibonacci retracement should be reversed or not, if prices should be displayed, if levels should be displayed and if to show the decimal levels or percentages and lastly the font size of these labels.
All defaults are based on the "Fib Retracement" tool by Tradingview.
Visualization
This indicator aims to be as visually similar to the default ("Fib Retracement") tool here on Tradingview. It will plot the Fibonacci retracement (called Auto Fibonacci/Auto fib) according to the trend from the library 'MarketStrucure'. The big differences from the "Fib Retracement" tool by Tradingview is that it's automatic (that adapts to trend), the market structure is visualized through lines and labels (showing 'BOS' for break of structures and 'CHoCH'/'CHoCH+' for change of characters) and that the labels showing information about the levels are positioned to be highly visible (left if <50% otherwise right if in a bullish trend, vice versa in a bearish trend or if reversed).
Don't hesitate if you have any feedback or nice feature suggestions!
Best of trading luck!

Golden Ratio Trend Persistence [EWT]Golden Ratio Trend Persistence
~~~~~~~~~~~~~~~~~~~~~~~~~~~~~~~~~~~~~~~~~~~~
Overview
The Golden Ratio Trend Persistence is a dynamic tool designed to identify the strength and persistence of market trends. It operates on a simple yet powerful premise: a trend is likely to continue as long as it doesn't retrace beyond the key Fibonacci golden ratio of 61.8%.
This indicator automatically identifies the most significant swing high or low and plots a single, dynamic line representing the 61.8% retracement level of the current move. This line acts as a "line in the sand" for the prevailing trend. The background color also changes to provide an immediate visual cue of the current market direction.
~~~~~~~~~~~~~~~~~~~~~~~~~~~~~~~~~~~~~~~~~~~~
The Power of the Golden Ratio (61.8%)
The golden ratio (ϕ≈1.618) and its inverse (0.618, or 61.8%) are fundamental mathematical constants that appear throughout nature, art, and science, often representing harmony and structure. In financial markets, this ratio is a cornerstone of Fibonacci analysis and is considered one of the most critical levels for price retracements.
Market movements are not linear; they progress in waves of impulse and correction. The 61.8% level often acts as the ultimate point of support or resistance. A trend that can hold this level demonstrates underlying strength and is likely to persist. A breach of this level, however, suggests a fundamental shift in market sentiment and a potential reversal.
~~~~~~~~~~~~~~~~~~~~~~~~~~~~~~~~~~~~~~~~~~~~
How to Use This Indicator
This indicator is designed for clarity and ease of use.
Identifying the Trend : The visual cues make the current trend instantly recognizable.
A teal line with a teal background signifies a bullish trend. The line acts as dynamic support.
A maroon line with a maroon background signifies a bearish trend. The line acts as dynamic resistance.
Confirming Trend Persistence : As long as the price respects the plotted level, the trend is considered intact.
In an uptrend, prices should remain above the teal line. The indicator will automatically adjust its anchor to new, higher lows, causing the support line to trail the price.
In a downtrend, prices should remain below the maroon line.
Spotting Trend Reversals : The primary signal is a trend reversal, which occurs when the price closes decisively beyond the plotted level.
Potential Sell Signal : When the price closes below the teal support line, it indicates that buying pressure has failed, and the uptrend is likely over.
Potential Buy Signal : When the price closes above the maroon resistance line, it indicates that selling pressure has subsided, and a new uptrend may be starting.
Think of this tool as an intelligent, adaptive trailing stop that is based on market structure and the time-tested principles of Fibonacci analysis.
~~~~~~~~~~~~~~~~~~~~~~~~~~~~~~~~~~~~~~~~~~~~
Input Parameters
You can customize the indicator's sensitivity through the following inputs in the settings menu:
Pivot Lookback Left : This number defines how many bars to the left of a candle must be lower (for a pivot high) or higher (for a pivot low) to identify a potential swing point. A higher value will result in fewer, but more significant, pivots being detected.
Pivot Lookback Right : This defines the number of bars that must close to the right before a swing point is confirmed. This parameter prevents the indicator from repainting. A higher value increases confirmation strength but also adds a slight lag.
Fibonacci Ratio : While the default is the golden ratio (0.618), you can adjust this to other key Fibonacci levels, such as 0.5 (50%) or 0.382 (38.2%), to test for different levels of trend persistence.
Adjusting these parameters allows you to fine-tune the indicator for different assets, timeframes, and trading styles, from short-term scalping to long-term trend following.
Golden Pocket Syndicate [GPS]Golden Pocket Syndicate is a multi-layered market analysis toolkit built for precision entries and sniper-style reversals in both trending and ranging conditions. The script fuses volume dynamics, golden pocket structures, market maker behavior, and liquidation cluster tracking into one high-confluence system.
Core Features:
• 📐 Golden Pocket Zones: Dynamic GP levels from daily, weekly, monthly, and yearly timeframes. These levels update in real-time and serve as confluence zones for entries and exits.
• 📊 WaveTrend Divergence Diamonds: Momentum shifts are detected using a custom filtered WaveTrend cross system to mark high-probability reversal conditions.
• 🧠 Market Maker Premium Divergence: Tracks price dislocation between CME and Binance to detect large player manipulation using a configurable premium threshold.
• 💎 MM Reversal Diamonds: Identifies potential market maker traps and large player pivots using historical candle behavior, EMA alignment, and price structure breaks.
• 📉 Stealth Liquidation Cluster Arrows: Volume-based liquidation pressure visualized as lightweight directional arrows based on calculated wick expansion and volume bursts. Highlights key zones where price is likely to bounce or reject.
• 🧭 Trend Validation: Uses volume-based trend conditions and short-term EMA positioning to further qualify signals and eliminate noise.
How to Use:
This indicator is designed to help traders visualize confluence between key institutional price levels, momentum shifts, and volume-based pressure points. Long/short opportunities can be explored at marked reversal diamonds or liquidation zones that align with key GP levels. Intended for use on higher timeframes (15m to 4H), though flexible across any pair or market.

Fibonacci Retracement Engine (DFRE) [PhenLabs]📊 Fibonacci Retracement Engine (DFRE)
Version: PineScript™ v6
📌 Description
Dynamic Fibonacci Retracement Engine (DFRE) is a sophisticated technical analysis tool that automatically detects important swing points and draws precise Fibonacci retracement levels on various timeframes. The intelligent indicator eliminates the subjectivity of manual Fibonacci drawing using intelligent swing detection algorithms combined with multi timeframe confluence analysis.
Built for professional traders who demand accuracy and consistency, DFRE provides real time Fibonacci levels that adapt to modifications in market structure without sacrificing accuracy in changing market conditions. The indicator excels at identifying key support and resistance levels where price action is more likely to react, giving traders a potent edge in entry and exit timing.
🚀 Points of Innovation
Intelligent Swing Detection Algorithm : Advanced pivot detection with customizable confirmation bars and minimum swing percentage thresholds
Multi-Timeframe Confluence Engine : Simultaneous analysis across three timeframes to identify high-probability zones
Dynamic Level Management : Automatically updates and manages multiple Fibonacci sets while maintaining chart clarity
Adaptive Visualization System : Smart labeling that shows only the most relevant levels based on user preferences
Real-Time Confluence Detection : Identifies zones where multiple Fibonacci levels from different timeframes converge
Automated Alert System : Comprehensive notifications for level breakouts and confluence zone formations
🔧 Core Components
Swing Point Detection Engine : Uses pivot high/low calculations with strength confirmation to identify significant market turns
Fibonacci Calculator : Automatically computes standard retracement levels (0.236, 0.382, 0.5, 0.618, 0.786, 0.886) plus extensions (1.272, 1.618)
Multi-Timeframe Security Function : Safely retrieves Fibonacci data from higher timeframes without repainting
Confluence Analysis Module : Mathematically identifies zones where multiple levels cluster within specified thresholds
Dynamic Drawing Management : Efficiently handles line and label creation, updates, and deletion to maintain performance
🔥 Key Features
Customizable Swing Detection : Adjust swing length (3-50 bars) and strength confirmation (1-10 bars) to match your trading style
Selective Level Display : Choose which Fibonacci levels to show, from core levels to full extensions
Multi-Timeframe Analysis : Analyze up to 3 different timeframes simultaneously for confluence identification
Intelligent Labeling System : Options to show main levels only or all levels, with latest-set-only functionality
Visual Customization : Adjustable line width, colors, and extension options for optimal chart clarity
Performance Optimization : Limit maximum Fibonacci sets (1-5) to maintain smooth chart performance
Comprehensive Alerting : Get notified on level breakouts and confluence zone formations
🎨 Visualization
Dynamic Fibonacci Lines : Color-coded lines (green for uptrends, red for downtrends) with customizable width and extension
Smart Level Labels : Precise level identification with both ratio and price values displayed
Confluence Zone Highlighting : Visual emphasis on areas where multiple timeframe levels converge
Clean Chart Management : Automatic cleanup of old drawing objects to prevent chart clutter
Responsive Design : All visual elements adapt to different chart sizes and timeframes
📖 Usage Guidelines
Swing Detection Settings
Swing Detection Length - Default: 25 | Range: 3-50 | Controls the lookback period for identifying pivot points. Lower values detect more frequent swings but may include noise, while higher values focus on major market turns.
Swing Strength (Confirmation Bars) - Default: 2 | Range: 1-10 | Number of bars required to confirm a swing point. Higher values reduce false signals but increase lag.
Minimum Swing % Change - Default: 1.0% | Range: 0.1-10.0% | Minimum percentage change required to register a valid swing. Filters out insignificant price movements.
Fibonacci Level Settings
Individual Level Toggles : Enable/disable specific Fibonacci levels (0.236, 0.382, 0.5, 0.618, 0.786, 0.886)
Extensions : Show projection levels (1.272, 1.618) for target identification
Multi-Timeframe Settings
Timeframe Selection : Choose three higher timeframes for confluence analysis
Confluence Threshold : Percentage tolerance for level clustering (0.5-5.0%)
✅ Best Use Cases
Swing Trading : Identify optimal entry and exit points at key retracement levels
Confluence Trading : Focus on high-probability zones where multiple timeframe levels align
Support/Resistance Trading : Use dynamic levels that adapt to changing market structure
Breakout Trading : Monitor level breaks for momentum continuation signals
Target Setting : Utilize extension levels for profit target placement
⚠️ Limitations
Lagging Nature : Requires confirmed swing points, which means levels appear after significant moves
Market Condition Dependency : Works best in trending markets; less effective in extremely choppy conditions
Multiple Signal Complexity : Multiple timeframe analysis may produce conflicting signals requiring experience to interpret
Performance Considerations : Multiple Fibonacci sets and MTF analysis may impact indicator loading time on slower devices
💡 What Makes This Unique
Automated Precision : Eliminates manual drawing errors and subjective level placement
Multi-Timeframe Intelligence : Combines analysis from multiple timeframes for superior confluence detection
Adaptive Management : Automatically updates and manages multiple Fibonacci sets as market structure evolves
Professional-Grade Alerts : Comprehensive notification system for all significant level interactions
🔬 How It Works
Step 1 - Swing Point Identification : Scans price action using pivot high/low calculations with specified lookback periods, applies confirmation logic to eliminate false signals, and calculates swing strength based on surrounding price action for quality assessment.
Step 2 - Fibonacci Level Calculation : Automatically computes retracement and extension levels between confirmed swing points, creates dynamic level sets that update as new swing points are identified, and maintains multiple active Fibonacci sets for comprehensive market analysis.
Step 3 - Multi-Timeframe Confluence : Retrieves Fibonacci data from higher timeframes using secure request functions, analyzes level clustering across different timeframes within specified thresholds, and identifies high-probability zones where multiple levels converge.
💡 Note: This indicator works best when combined with other technical analysis tools and proper risk management. The multi-timeframe confluence feature provides the highest probability setups, but always confirm signals with additional analysis before entering trades.

Smart Directional Fib Zone (Selectable Session)🎯 Overview
This indicator plots a dynamic Fibonacci zone between the 0.5 and 0.618 levels , calculated from the previous day’s price action , and is designed specifically for intraday traders.
It visually highlights key retracement or reaction areas where the market often pauses or reverses.
🔍 How it works
At the start of each day, the script automatically captures:
the previous day’s open (pdo),
high (pdh),
low (pdl),
and close (pdc).
It then determines if the previous day was bullish (Close > Open) or bearish (Close < Open).
Based on that:
If the previous day was bullish, it projects the Fibonacci levels down from the high (typical for expecting retracements).
If bearish, it projects them up from the low.
The two key levels are:
0.5 (50%) retracement / projection
0.618 (61.8%) retracement / projection
A colored zone is plotted between these levels to act as a leading guide for intraday setups.
⏰ Time filtering & session customization
A unique feature is the dynamic session filtering:
By default, the zone is only plotted during active market hours, keeping your chart clean outside trading hours.
The script provides a dropdown selector so you can quickly switch between:
India session (9:15 to 15:30)
Europe session (9:00 to 17:30)
US session (9:30 to 16:00)
Or even define your own custom session times.
This makes it ideal for intraday traders in any region.
🎨 Visual features
The fill zone changes color based on the previous day’s sentiment:
Green zone if the previous day was bullish
Red zone if the previous day was bearish
🚨 Alerts
The script includes an alert condition, so you can easily set up TradingView alerts to notify you when:
Price enters the Fibonacci zone.
This is extremely helpful for catching retracements or reversals without staring at the screen all day.
⚙️ How to use
✅ Works on any intraday timeframe (1 min, 5 min, 15 min, etc.).
✅ Simply add it to your chart, pick your session in the dropdown, and watch the Fibonacci zone automatically adjust to your selected market hours.
Use it as a confluence tool alongside other indicators like VWAP, EMAs, Bollinger Bands, or price action patterns to time entries and exits.
💪 Why this is powerful
This is more than a simple Fib retracement tool:
It dynamically adapts to the previous day’s sentiment, helping you trade in alignment with recent market psychology.
The session filtering ensures your charts are focused only on the periods

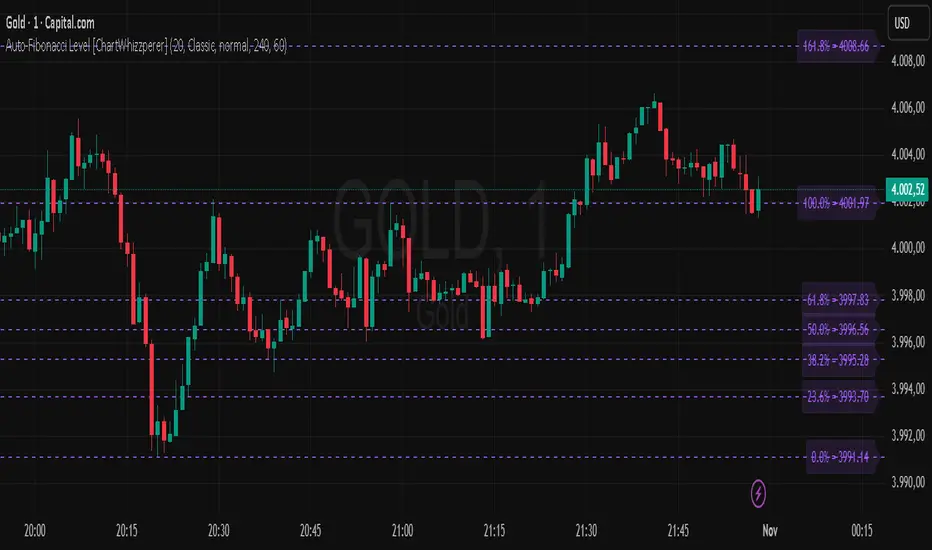
Auto-Fibonacci Levels [ChartWhizzperer]Auto-Fibonacci Levels
Discover one of the most elegant and flexible Fibonacci indicators for TradingView – fully automatic, tastefully understated, and built entirely in Pine Script V6.
Key Features:
- Automatically detects the most recent swing high and swing low.
- Plots Fibonacci retracement levels and extensions (including 161.8%, 261.8%) perfectly aligned
to the prevailing trend.
- Distinctive, dashed lines with crystal-clear price labels right at the price scale
for maximum clarity.
- Line length and label offset are fully customisable for your charting preference.
- Absolutely no repainting: Only confirmed swings are used for reliable signals.
- Parameter: "Swing Detection Length"
The “Swing Detection Length” parameter determines how many bars must appear to the left and right of a potential high or low for it to be recognised as a significant swing point.
- Higher values make the script less sensitive (only major turning points are detected).
- Lower values make it more responsive to minor fluctuations (more fibs, more signals).
For best results, adjust this setting according to your preferred timeframe and trading style.
Pro Tip:
Fibonacci levels refresh automatically whenever a new swing is confirmed.
Ideal for price action enthusiasts and Fibonacci purists alike.
Licence:
// Licence: CC BY-NC-SA 4.0 – Non-commercial use only, attribution required.
// © ChartWhizzperer
Fibonacci Entry Bands [AlgoAlpha]OVERVIEW
This script plots Fibonacci Entry Bands, a trend-following and mean-reversion hybrid system built around dynamic volatility-adjusted bands scaled using key Fibonacci levels. It calculates a smoothed basis line and overlays multiple bands at fixed Fibonacci multipliers of either ATR or standard deviation. Depending on the trend direction, specific upper or lower bands become active, offering a clear framework for entry timing, trend identification, and profit-taking zones.
CONCEPTS
The core idea is to use Fibonacci levels—0.618, 1.0, 1.618, and 2.618—as multipliers on a volatility measure to form layered price bands around a trend-following moving average. Trends are defined by whether the basis is rising or falling. The trend determines which side of the bands is emphasized: upper bands for downtrends, lower bands for uptrends. This approach captures both directional bias and extreme price extensions. Take-profit logic is built in via crossovers relative to the outermost bands, scaled by user-selected aggressiveness.
FEATURES
Basis Line – A double EMA smoothing of the source defines trend direction and acts as the central mean.
Volatility Bands – Four levels per side (based on selected ATR or stdev) mark the Fibonacci bands. These become visible only when trend direction matches the side (e.g., only lower bands plot in an uptrend).
Bar Coloring – Bars are shaded with adjustable transparency depending on distance from the basis, with color intensity helping gauge overextension.
Entry Arrows – A trend shift triggers either a long or short signal, with a marker at the outermost band with ▲/▼ signs.
Take-Profit Crosses – If price rejects near the outer band (based on aggressiveness setting), a cross appears marking potential profit-taking.
Bounce Signals – Minor pullbacks that respect the basis line are marked with triangle arrows, hinting at continuation setups.
Customization – Users can toggle bar coloring, signal markers, and select between ATR/stdev as well as take-profit aggressiveness.
Alerts – All major signals, including entries, take-profits, and bounces, are available as alert conditions.
USAGE
To use this tool, load it on your chart, adjust the inputs for volatility method and aggressiveness, and wait for entries to form on trend changes. Use TP crosses and bounce arrows as potential exit or scale-in signals.

Fibonacci Optimal Entry Zone [OTE] (Zeiierman)█ Overview
Fibonacci Optimal Entry Zone (Zeiierman) is a high-precision market structure tool designed to help traders identify ideal entry zones during trending markets. Built on the principles of Smart Money Concepts (SMC) and Fibonacci retracements, this indicator highlights key areas where price is most likely to react — specifically within the "Golden Zone" (between the 50% and 61.8% retracement).
It tracks structural pivot shifts (CHoCH) and dynamically adjusts Fibonacci levels based on real-time swing tracking. Whether you're trading breakouts, pullbacks, or optimal entries, this tool brings unparalleled clarity to structure-based strategies.
Ideal for traders who rely on confluence, this indicator visually synchronizes swing highs/lows, market structure shifts, Fibonacci retracement levels, and trend alignment — all without clutter or lag.
⚪ The Structural Assumption
Price moves in waves, but key retracements often lead to continuation or reversal — especially when aligned with structure breaks and trend shifts.
The Optimal Entry Zone captures this behavior by anchoring Fibonacci levels between recent swing extremes. The most powerful area — the Golden Zone — marks where institutional re-entry is likely, providing traders with a sniper-like roadmap to structure-based entries.
█ How It Works
⚪ Structure Tracking Engine
At its core, the indicator detects pivots and classifies trend direction:
Structure Period – Determines the depth of pivots used to detect swing highs/lows.
CHoCH – Break of structure logic identifies where the trend shifts or continues, marked visually on the chart.
Bullish & Bearish Modes – Independently toggle uptrend and downtrend detection and styling.
⚪ Fibonacci Engine
Upon each confirmed structural shift, Fibonacci retracement levels are projected between swing extremes:
Custom Levels – Choose which retracements (0.50, 0.618, etc.) are shown.
Real-Time Adjustments – When "Swing Tracker" is enabled, levels and labels update dynamically as price forms new swings.
Example:
If you disable the Swing Tracker, the Golden Level is calculated using the most recent confirmed swing high and low.
If you enable the Swing Tracker, the Golden Level is calculated from the latest swing high or low, making it more adaptive as the trend evolves in real time.
█ How to Use
⚪ Structure-Based Entry
Wait for CHoCH events and use the resulting Fibonacci projection to identify entry points. Enter trades as price taps into the Golden Zone, especially when confluence forms with swing structure or order blocks.
⚪ Real-Time Reaction Tracking
Enable Swing Tracker to keep the tool live — constantly updating zones as price shifts. This is especially useful for scalpers or intraday traders who rely on fresh swing zones.
█ Settings
Structure Period – Number of bars used to define swing pivots. Larger values = stronger structure.
Swing Tracker – Auto-updates fib levels as new highs/lows form.
Show Previous Levels – Keep older fib zones on chart or reset with each structure shift.
-----------------
Disclaimer
The content provided in my scripts, indicators, ideas, algorithms, and systems is for educational and informational purposes only. It does not constitute financial advice, investment recommendations, or a solicitation to buy or sell any financial instruments. I will not accept liability for any loss or damage, including without limitation any loss of profit, which may arise directly or indirectly from the use of or reliance on such information.
All investments involve risk, and the past performance of a security, industry, sector, market, financial product, trading strategy, backtest, or individual's trading does not guarantee future results or returns. Investors are fully responsible for any investment decisions they make. Such decisions should be based solely on an evaluation of their financial circumstances, investment objectives, risk tolerance, and liquidity needs.

HTF Candle Breakout Fibonacci LevelsThis indicator automatically plots Fibonacci retracement levels on a lower timeframe (LTF) after detecting a breakout candle on a selected higher timeframe (HTF).
🔍 How It Works
When a candle on your selected HTF closes beyond the high or low of the previous candle, the indicator automatically draws Fibonacci levels on the LTF.
These levels remain visible until the next HTF candle is formed — allowing you to trade retracements with contextual precision.
⸻
⚙️ Customization Options
From the indicator settings, you can modify:
• The HTF candle timeframe (default is 1D)
• Fibonacci levels and colors
• Enable or disable “Show Only the Latest Levels” — ideal for live trading to keep the chart clean and focused.
⸻
🟪 HTF Candles Preview
After applying the indicator, you’ll see 3 vertical bars on the right edge of your LTF chart. These represent a live preview of the last three HTF candles and update in real-time.
If you prefer a cleaner chart, disable this feature via the “Show HTF Candles” toggle in the settings.
⸻
Feel free to reach out if you have any questions.

FibSync - DynamicFibSupportWhat is this indicator?
FibSync – DynamicFibSupport overlays your chart with both static and dynamic Fibonacci retracement levels, making it easy to spot potential areas of support and resistance.
Static Fibs: Calculated from the highest and lowest price over a user-defined lookback period.
Dynamic Fibs: Calculated from the most recent swing high and swing low, automatically adapting as new swings form.
How to use
Add the indicator to your chart.
Configure the settings:
Static Fib Period: Sets the lookback window for static fib levels.
Show Dynamic Fibonacci Levels: Toggle dynamic fibs on/off.
Dynamic Fib Swing Search Window: How far back to search for valid swing highs/lows.
Swing Strength (bars left/right): How many bars define a swing high/low (higher = stronger swing).
Interpret the levels:
Solid lines are static fibs.
Transparent lines are dynamic fibs (if enabled).
Colors match standard fib conventions (yellow = 0.236, red = 0.382, blue = 0.618, green = 0.786, gray = 0.5).
Tips
Static and dynamic fibs can overlap-this often highlights especially important support/resistance zones.
Adjust the swing strength for your trading style: lower values for short-term, higher for long-term swings.
Hide/show individual lines using the indicator’s style settings in TradingView.
Trading Ideas (for higher timeframes and static fibs)
Close above the blue line (0.618 static fib):
This can be interpreted as a potential long (buy) signal, suggesting the market is breaking above a key resistance level.
Close below the red line (0.382 static fib):
This can be interpreted as a potential short (sell) signal, indicating the market is breaking below a key support level.
Note: These signals are most meaningful on higher timeframes and when using the static fib lines. Always confirm with your own strategy and risk management.

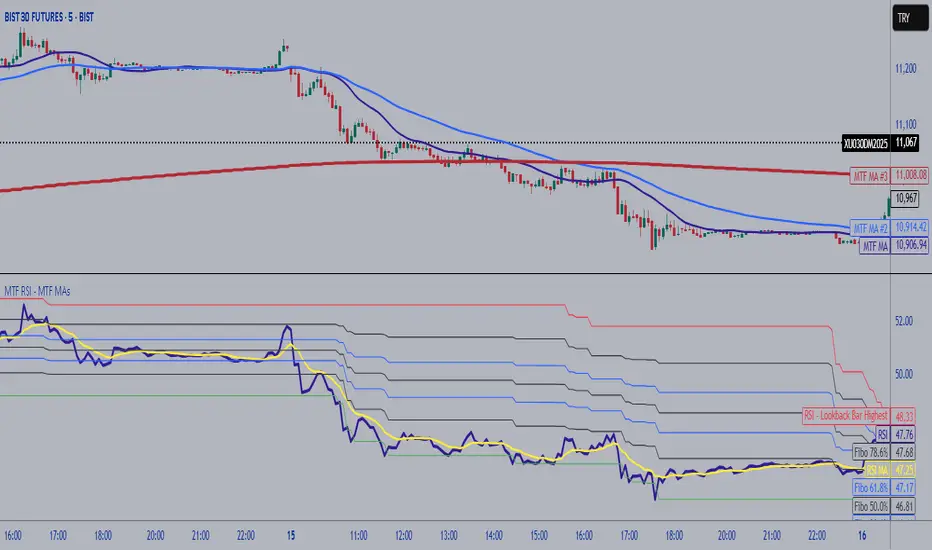
MTF RSI Fibonacci Levels & MTF Moving Avreages (EMA-SMA-WMA)Thanks for Kadir Türok Özdamar. @kadirturokozdmr
Formula Purpose of Use
This formula combines the traditional RSI indicator with Fibonacci levels to create a special technical indicator that aims to identify potential support and resistance points:
Thanks for Kadir Türok Özdamar. @kadirturokozdmr
Formula Purpose of Use
This formula combines the traditional RSI indicator with Fibonacci levels to create a special technical indicator that aims to identify potential support and resistance points:
Determines the historical RSI range of 144 periods (PEAK and DIP)
Calculates Fibonacci retracement levels within this range, and shows the direction of momentum by calculating the moving average of the RSI
This indicator can be used to identify potential reversal points, especially when the RSI is not in overbought (70+) or oversold (30-) areas.
Practical Use
Investors can use this indicator as follows:
1⃣When the RSI approaches one of the determined Fibonacci levels, it is considered a potential support/resistance area.
2⃣When the RSI approaches the DIP level, it can be interpreted as oversold, and when it approaches the PEAK level, it can be interpreted as overbought.
3⃣When the RSI crosses the SM (moving average) line upwards or downwards, it can be evaluated as a momentum change signal.
4⃣Fibonacci levels (especially M386, M500 and M618) can be monitored as important transition zones for the RSI.
--------------------------------------------
In this version, some features and a multi-timeframe averages (SMA-EMA-WMA) were added to the script. It was made possible for the user to enter multi-timeframe RSI and multi-timeframe Fibo lengths.
Intraday Fibs RetracementFibonacci (Fibs) levels are often used by traders as a way to find support and resistance, based on the Fibonacci sequence. These levels are widely used in technical analysis to identify potential reversal points in the price of an asset.
Fibs retracement draws lines at these Fibs level between a significant high and low point on a price chart.
What it shows:
This indicator will automatically draw Fibs Retracement Levels on your chart without any manual work.
It is designed to be used for day trading, especially in scenarios where a ticker gaps up/down large compared to the prior day close. (i.e. scenario where the difference of day's open and prior day close is large)
The drawing will happen on each trading day the moment trading hours open, and will NOT draw during pre-market and post-market.
User can see the line of each Fibs level, labelled with the Fib percentage and price value for the corresponding levels.
User will specify a start and end point of Fibs and based on the choice the indicator will automatically compute the other user defined Fibs levels and display on the chart.
How to use it:
The Fib levels drawn can be a potential support and resistance zone. Therefore in scenario where you already have a position and are approaching one of these levels it could be a point to close out some or all the position as you are approaching a resistance. On the other hand when price do approach these levels you could enter a position for a reversal trade. These are few ways to use the indicator but there are other ways that can be used, which can be found out by researching "Fibonacci (Fibs) Retracement".
In the example on the chart you can see a price bounce from the 0.7886 Fibs level on this particular day, where the price gapped up and was coming down after market hours opened.
Key settings:
1. Fibs Retracement Start and end Point: User selects where the Fibs levels should be drawn.
Available Options are:
Start Points:
Market Open
Market Open High (Dependent on the time frame you are on)
Pre-market High
Day's High
End Points:
Previous Day Close
Previous Day Low
Previous Day High
Pre-market Low (Current Day)
Day's Low
2. Custom Fib Levels: User can manually enter the Fib levels they want to see. (Max 9)
Default values are: 0,0.236,0.382,0.5,0.618,0.786,1,1.618,2.618.
3. Display settings: User can specify the line colour, thickness and style.
4. Label Setting: User can choose to turn on/off the labels for the each Fibs Level. Label will show the fib percentage and the corresponding price. User can also choose the location of the labels, defined by an offset from the current candle.
----------------------------------------------------------------------
If anything is not clear please let me know!

GIGANEVA V6.61 PublicThis enhanced Fibonacci script for TradingView is a powerful, all-in-one tool that calculates Fibonacci Levels, Fans, Time Pivots, and Golden Pivots on both logarithmic and linear scales. Its ability to compute time pivots via fan intersections and Range interactions, combined with user-friendly features like Bool Fib Right, sets it apart. The script maximizes TradingView’s plotting capabilities, making it a unique and versatile tool for technical analysis across various markets.
1. Overview of the Script
The script appears to be a custom technical analysis tool built for TradingView, improving upon an existing script from TradingView’s Community Scripts. It calculates and plots:
Fibonacci Levels: Standard retracement levels (e.g., 0.236, 0.382, 0.5, 0.618, etc.) based on a user-defined price range.
Fibonacci Fans: Trendlines drawn from a high or low point, radiating at Fibonacci ratios to project potential support/resistance zones.
Time Pivots: Points in time where significant price action is expected, determined by the intersection of Fibonacci Fans or their interaction with key price levels.
Golden Pivots: Specific time pivots calculated when the 0.5 Fibonacci Fan (on a logarithmic or linear scale) intersects with its counterpart.
The script supports both logarithmic and linear price scales, ensuring versatility across different charting preferences. It also includes a feature to extend Fibonacci Fans to the right, regardless of whether the user selects the top or bottom of the range first.
2. Key Components Explained
a) Fibonacci Levels and Fans from Top and Bottom of the "Range"
Fibonacci Levels: These are horizontal lines plotted at standard Fibonacci retracement ratios (e.g., 0.236, 0.382, 0.5, 0.618, etc.) based on a user-defined price range (the "Range"). The Range is typically the distance between a significant high (top) and low (bottom) on the chart.
Example: If the high is $100 and the low is $50, the 0.618 retracement level would be at $80.90 ($50 + 0.618 × $50).
Fibonacci Fans: These are diagonal lines drawn from either the top or bottom of the Range, radiating at Fibonacci ratios (e.g., 0.382, 0.5, 0.618). They project potential dynamic support or resistance zones as price evolves over time.
From Top: Fans drawn downward from the high of the Range.
From Bottom: Fans drawn upward from the low of the Range.
Log and Linear Scale:
Logarithmic Scale: Adjusts price intervals to account for percentage changes, which is useful for assets with large price ranges (e.g., cryptocurrencies or stocks with exponential growth). Fibonacci calculations on a log scale ensure ratios are proportional to percentage moves.
Linear Scale: Uses absolute price differences, suitable for assets with smaller, more stable price ranges.
The script’s ability to plot on both scales makes it adaptable to different markets and user preferences.
b) Time Pivots
Time pivots are points in time where significant price action (e.g., reversals, breakouts) is anticipated. The script calculates these in two ways:
Fans Crossing Each Other:
When two Fibonacci Fans (e.g., one from the top and one from the bottom) intersect, their crossing point represents a potential time pivot. This is because the intersection indicates a convergence of dynamic support/resistance zones, increasing the likelihood of a price reaction.
Example: A 0.618 fan from the top crosses a 0.382 fan from the bottom at a specific bar on the chart, marking that bar as a time pivot.
Fans Crossing Top and Bottom of the Range:
A fan line (e.g., 0.5 fan from the bottom) may intersect the top or bottom price level of the Range at a specific time. This intersection highlights a moment where the fan’s projected support/resistance aligns with a key price level, signaling a potential pivot.
Example: The 0.618 fan from the bottom reaches the top of the Range ($100) at bar 50, marking bar 50 as a time pivot.
c) Golden Pivots
Definition: Golden pivots are a special type of time pivot calculated when the 0.5 Fibonacci Fan on one scale (logarithmic or linear) intersects with the 0.5 fan on the opposite scale (or vice versa).
Significance: The 0.5 level is the midpoint of the Fibonacci sequence and often acts as a critical balance point in price action. When fans at this level cross, it suggests a high-probability moment for a price reversal or significant move.
Example: If the 0.5 fan on a logarithmic scale (drawn from the bottom) crosses the 0.5 fan on a linear scale (drawn from the top) at bar 100, this intersection is labeled a "Golden Pivot" due to its confluence of key Fibonacci levels.
d) Bool Fib Right
This is a user-configurable setting (a boolean input in the script) that extends Fibonacci Fans to the right side of the chart.
Functionality: When enabled, the fans project forward in time, regardless of whether the user selected the top or bottom of the Range first. This ensures consistency in visualization, as the direction of the Range selection (top-to-bottom or bottom-to-top) does not affect the fan’s extension.
Use Case: Traders can use this to project future support/resistance zones without worrying about how they defined the Range, improving usability.
3. Why Is This Code Unique?
Original calculation of Log levels were taken from zekicanozkanli code. Thank you for giving me great Foundation, later modified and applied to Fib fans. The script’s uniqueness stems from its comprehensive integration of Fibonacci-based tools and its optimization for TradingView’s plotting capabilities. Here’s a detailed breakdown:
All-in-One Fibonacci Tool:
Most Fibonacci scripts on TradingView focus on either retracement levels, extensions, or fans.
This script combines:
Fibonacci Levels: Static horizontal lines for retracement and extension.
Fibonacci Fans: Dynamic trendlines for projecting support/resistance.
Time Pivots: Temporal analysis based on fan intersections and Range interactions.
Golden Pivots: Specialized pivots based on 0.5 fan confluences.
By integrating these functions, the script provides a holistic Fibonacci analysis tool, reducing the need for multiple scripts.
Log and Linear Scale Support:
Many Fibonacci tools are designed for linear scales only, which can distort projections for assets with exponential price movements. By supporting both logarithmic and linear scales, the script caters to a wider range of markets (e.g., stocks, forex, crypto) and user preferences.
Time Pivot Calculations:
Calculating time pivots based on fan intersections and Range interactions is a novel feature. Most TradingView scripts focus on price-based Fibonacci levels, not temporal analysis. This adds a predictive element, helping traders anticipate when significant price action might occur.
Golden Pivot Innovation:
The concept of "Golden Pivots" (0.5 fan intersections across scales) is a unique addition. It leverages the symmetry of the 0.5 level and the differences between log and linear scales to identify high-probability pivot points.
Maximized Plot Capabilities:
TradingView imposes limits on the number of plots (lines, labels, etc.) a script can render. This script is coded to fully utilize these limits, ensuring that all Fibonacci levels, fans, pivots, and labels are plotted without exceeding TradingView’s constraints.
This optimization likely involves efficient use of arrays, loops, and conditional plotting to manage resources while delivering a rich visual output.
User-Friendly Features:
The Bool Fib Right option simplifies fan projection, making the tool intuitive even for users who may not consistently select the Range in the same order.
The script’s flexibility in handling top/bottom Range selection enhances usability.
4. Potential Use Cases
Trend Analysis: Traders can use Fibonacci Fans to identify dynamic support/resistance zones in trending markets.
Reversal Trading: Time pivots and Golden Pivots help pinpoint moments for potential price reversals.
Range Trading: Fibonacci Levels provide key price zones for trading within a defined range.
Cross-Market Application: Log/linear scale support makes the script suitable for stocks, forex, commodities, and cryptocurrencies.
The original code was from zekicanozkanli . Thank you for giving me great Foundation.

Autofib Extensions | DTDHello trader comuunity!
I'm introducing another script that is part of my main day-trading strategy. We all know regardless of what strategy we use, we need to know what levels offer the least amount of risk to our trade entry and a great tool to anticipate how far a move might go or what level a move may retrace to are the Fibonacci Retracement and Extensions. This indicator combines both together, but with a twist.
The main elements of the script are:
1. Multiple Session High and Lows | Developing my first script led me to understand that measuring key times during each session provides understanding of the market's continuity. I have provided 3 "sessions' a user can define according to CST time where the script saves the high and low of that session window to produce the retracement and extensions from those plots. Currently, the levels are always plotted from low to high (with the 0 mark being the high) and negative values provided so the levels are consistent. You can toggle each session on or off.
2. Coloring Key Retracements / Extensions | I use a dark background for my charts so the default colors help me distinguish from other another indicator I use. Feel free to adjust the colors to your preference. I consider 3 different colors because of their significance. Retracements that you want to see continue fall back into the .50 to .618 level (this I consider the "Golden Zone"). While basic Elliott Wave Theory states a wave is completed near the 1.618 level (this I consider "Major Extensions"). Everything isn't noise, but minor levels in a larger sequence.
______________
Script Limitations
All of my scripts are made with the help of ChatGPT so there are going to be limitations. One current one that I have made progress on, but not fully is when you are viewing a timeframe where the candle doesn't start when a session window starts. On smaller timeframes like the 7-minute this is not an issue. However, on the hourly, if your session window starts at the half hour which the 3rd session default window does, the lines will not produce. I will hopefully have this rectified in the near future. I will open the script since none of this work is original in nature and I would love to see how others can create a better product. Also, this is mainly a futures trading tool. If you are using this on stocks you will find it not as useful if the session window is too wide since the script waits until the session window closes to calculate the extension values.
Cheers,
DTD
GoldenPocket & CRT IndicatorWith this script, you will be able to see Golden Pocket Fibonacci Levels and Candle Range Theory Highs, Lows and EQs.
You can set lookback bar numbers to define Fibonacci highs and lows.
You can set CRT High Time-frame.
Simple and effective script. Please let me know if you have any comments and support me if you like it.
Fibonacci Sequence NumbersThe "Fibonacci Sequence Numbers" indicator overlays horizontal lines on a trading chart based on Fibonacci sequence values (0, 34, 55, 89, 144, 233, 377, 610) relative to a user-defined reference price and time. Users can specify the direction ("Above," "Below," or "Both") to plot these levels above and/or below the reference price, with customizable line length, width, and colors for each level (e.g., red for Level 0, blue for 34). A vertical dashed line marks the reference time, while horizontal lines extend rightward, accompanied by labeled annotations shifted slightly left for clear view.

Fibonacci - DolphinTradeBot
OVERVIEW
The 'Fibonacci - DolphinTradeBot' indicator is a Pine Script-based tool for TradingView that dynamically identifies key Fibonacci retracement levels using ZigZag price movements. It aims to replicate the Fibonacci Retracement tool available in TradingView’s drawing tools. The indicator calculates Fibonacci levels based on directional price changes, marking critical retracement zones such as 0, 0.236, 0.382, 0.5, 0.618, 0.786, and 1.0 on the chart. These levels are visualized with lines and labels, providing traders with precise areas of potential price reversals or trend continuation.
HOW IT WORKS ?
The indicator follows a zigzag formation. After a large swing movement, when new swings are formed without breaking the upper and lower levels, it places Fibonacci levels at the beginning and end points of the major swing movement."
▪️(Bullish) Structure :High → HigherLow → LowerHigh
▪️(Bearish) Structure :Low → LowerHigh → HigherLow
▪️When Fibonacci retracement levels are determined, a "📌" mark appears on the chart.
▪️If the price closes outside of these levels, a "❌" mark will appear.
USAGE
This indicator is designed to plot Fibonacci levels within an accumulation zone following significant price movements, helping you identify potential support and resistance. You can adjust the pivot periods to customize the zigzag settings to your preference. While classic Fibonacci levels are used by default, you also have the option to input custom levels and assign your preferred colors.
Set the Fibonacci direction option to "upward" to detect only bullish structures, "downward" to detect only bearish structures, and "both" to see both at the same time.
"To view past levels, simply enable the ' Show Previous Levels ' option, and to display the zigzag lines, activate the ' Show Zigzag ' setting."
ALERTS
The indicator, by default, triggers an alarm when both a level is formed and when a level is broken. However, if you'd like, you can select the desired level from the " Select Level " section in the indicator settings and set the alarm based on one of the conditions below.
▪️ cross-up → If the price breaks the Fibonacci level to the upside.
▪️ cross-down → If the price breaks the Fibonacci level to the downside.
▪️ cross-any → If the price breaks the Fibonacci level in any direction.
