DachsundAlright so I updated the Holy Trinity Script because its not three indicators now its at least 5 indicator conditions that result in colored candles.
Blue Candles: Sell Alert, implies that now might be a good time to sell. If you hold through multiple blue candles, average out the two prices and create your stop loss there.
White Candles: Sell signal, implies that you should probably sell. I've made it to where a white candle is seldom rare, so if you have not sold by then - take this as a signal and not a warning.
Black Candles: Long Alert, implies that a good buy area is incoming. You can buy on black candles but I would not do it with high leverage. I've weeded out conditions that make black candles appear in a bear trend, but low leverage is still always necessary for these candles.
Yellow Candles: Long Signal, The Golden Signal, The Dachshund. Buy here for the love of Christ, that's all it is saying. Hold strong, better room for higher leverage, hold for a while and reap the benefits. If you miss a candle like this it isn't too late feel free to go long as long as the price is within a reasonable percentage. Never chase pumps ;)
Best if used on 30min, 45min, and 1hr-4hr.
Ethereum (Criptomoeda)

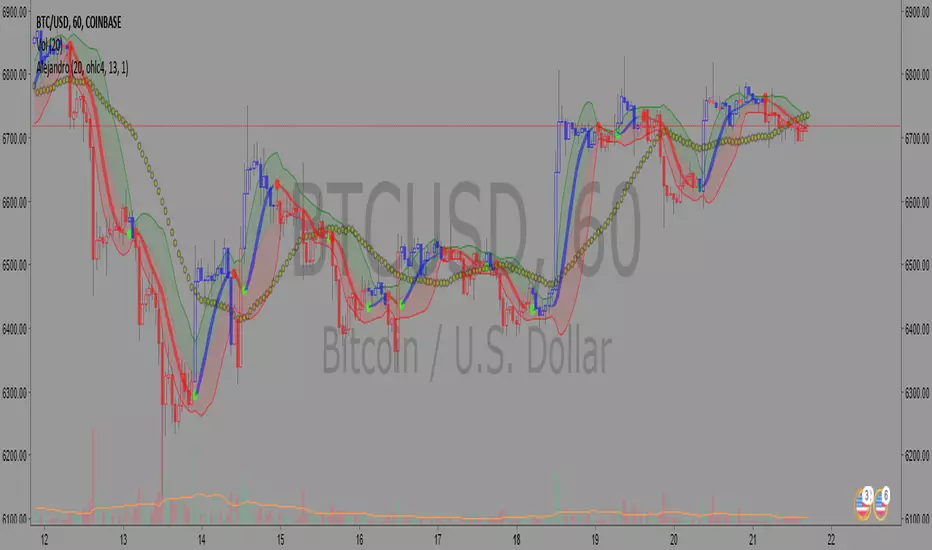
Trendster v1.0The Trend Is Your Friend
Trendster v1.0 will give you simple areas of possible entries (both long and short) in order to jump on board new trends early and stay in the trade for maximum profit. Can be used with most assets including equities, FOREX and cryptocurrencies. Alerts can be created from this indicator allowing for better manual trade timing or autotrading. Happy trading!

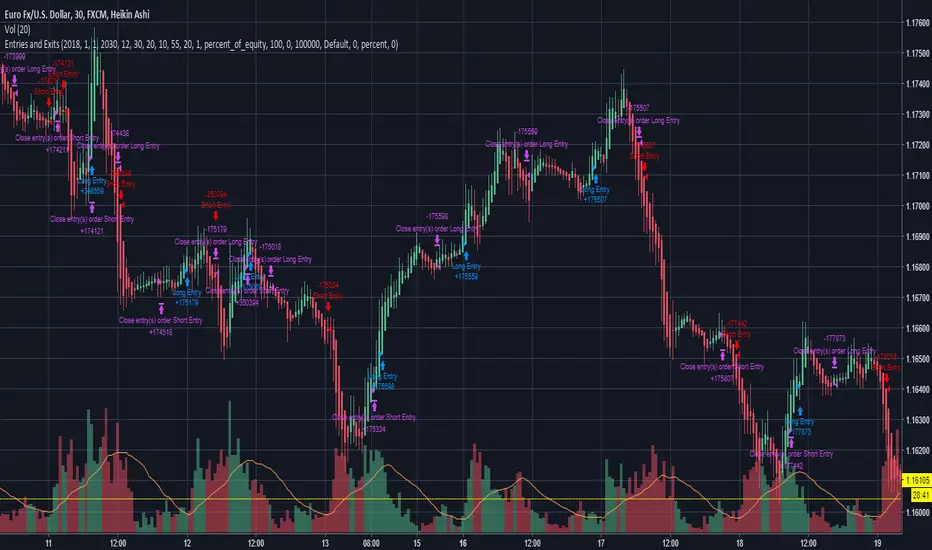
Entries and Exits (plus alerts)Simple breakout strategy that can be used for most equities, FOREX and cryptocurrencies. Inputs can be customized to suit your trading style and can be applied to any time frame chart. Comes with matching alert indicator which is useful for autotrading or just simply never missing a trade for manual trading. Please message me for access. Happy trading!
RSI + MACD Strategy (ETHUSD 1D)This script uses a combination of MACD, RSI and Stochastic RSI to find tops and bottoms with a ~70% profit rate. While it is successful with all of the top market coins, ETHUSD is by far showing the best results. It is fine tuned only for 1D charts, any other time interval results in losses. It's been tested with shorting as well, but longing + selling gives better returns.
Each market is slightly different, but backtests from October 2015 on Poloniex show almost 300,000%(!!) gains. While it is unlikely to produce such gains going forward (but who knows!), the profit rate is still much higher than buy–and–hold on any long-term backtests. As always, don't follow a script blindly and use your own best judgement when trading.
DISCLAIMER:
This script should be used for educational purposes only, and is not intended to provide trading advice. Use at your own risk!

DBT MoMo v2DBT MoMo v2 uses everything in the MoMo v1 and more. The MoMo finds areas of extension, to the downside and upside. These areas create good opportunities for long and short positions. It consist of a 3 candle back MoMo line and 24 candle back MoMo line. When both lines are above 10 this shows the bulls are very extended and a pullback or trend reversal is imminent, this will be signified as a gold background on the MoMo. When both MoMo lines are below -10 this shows the bears are very extended and a pullback or trend reversal to the upside is imminent, this will be signified as a purple background on the MoMo. When both MoMo lines are correlating and moving in the same direction the trend is strong. If they are showing inverse signals or the 3 MoMo is rapidly moving while the 24 MoMo is flat this means the trend is choppy or weak. When both MoMos are below -10 or above +10 and the 3 momo rapidly moves to +10 or -10, but the 24 momo remains flat this typically shows a trap is being played and you want to be careful taking a trade in the direction of the 3 MoMo. The midline is a trend line that shows trend direction, green for up red for down and white for sideways.
Use at your own risk. This is not financial advise and this indicator is not guaranteed to make you profits. Please message me if you have any questions or feedback. Enjoy.
This is the Official release of the DBT MoMo. It will be available on my website upon launch. Please do not ask for access. If you would like access please go to my website once it releases, Thank You.

Bitfinex Longs/Shorts Multi-Coin [acatwithcharts]This script plots the longs/shorts ratio derived from Bitfinex for BTCUSDLONGS, BTCUSDSHORTS, and similar for 11 top cryptocurrencies chosen selected based on marketcap, trading volume on Bitfinex, and the maximum number of times that TradingView would let me call the "security" function in one script. Included coins:
BTC, ETH, LTC, BCH, XRP, EOS, IOT (IOTA), ETC, ZEC, NEO, XMR
In addition to just plotting the ratios for the individual coins, this script also calculates for a customizable selection of the 11 coins both the average ratio and a weighted average weighted by (USD price of coin * sum of long and short positions).
I wrote it both to use both for a big picture overview of leveraged positions across major coins and to use as a Swiss army knife of longs/shorts ratio indicators for individual coins, most of which do not currently have individual scripts published.
I'm an amateur and you definitely shouldn't take anything I say or use any of my scripts as financial advice. I'd appreciate any feedback.

ETHUSD - Bitfinex - 5 minutes - fastThe same principle of the other ETHUSD script for autoview, with more generic signals.
Safety is because of the Stop Loss (with editable values) that turns the hand in the operation.
There are more operations, however, as you can see, losses can increase.
For those who do not have the patience to wait for the signs of the other.
Backtest properties
. Initial: 10k usd
. Currency: USD
. Pyramiding: 0
. Order Size: 100% equity
. Comission: 0.25%
>>>>>>>>>>>>>>>>>>> ADVICE <<<<<<<<<<<<<<<<<<<<<<<<<<<<<
This script was created on the BitFINEX chart in 5 minutes.
It is not recommended for use in another pair, another exchange or another timeframe.

ETHUSD - bot for Autoview - StudyScript for automated trade in ETHUSD at BITFINEX.
For more information, go to my scripts page and see his backtest (ETHUSD - bot for Autoview - Strategy).

ETHUSD - Bot for Autoview - Strategy. I'm exhausted to find out something.
I promise to make an uptade with everything.

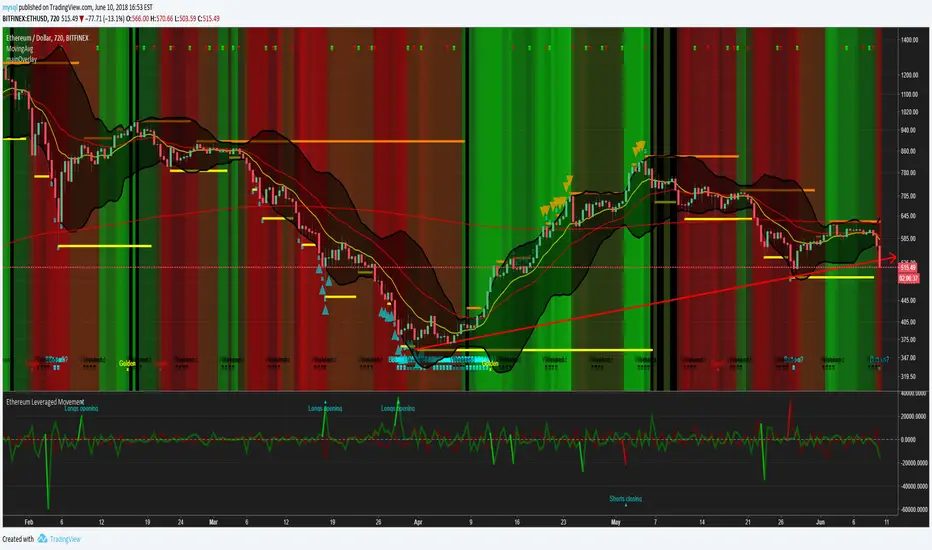
Ethereum Leveraged Movement, 3 different short/long views3 different views for Ethereum short/longs. the main view allows you to see changes from one bar to the next.
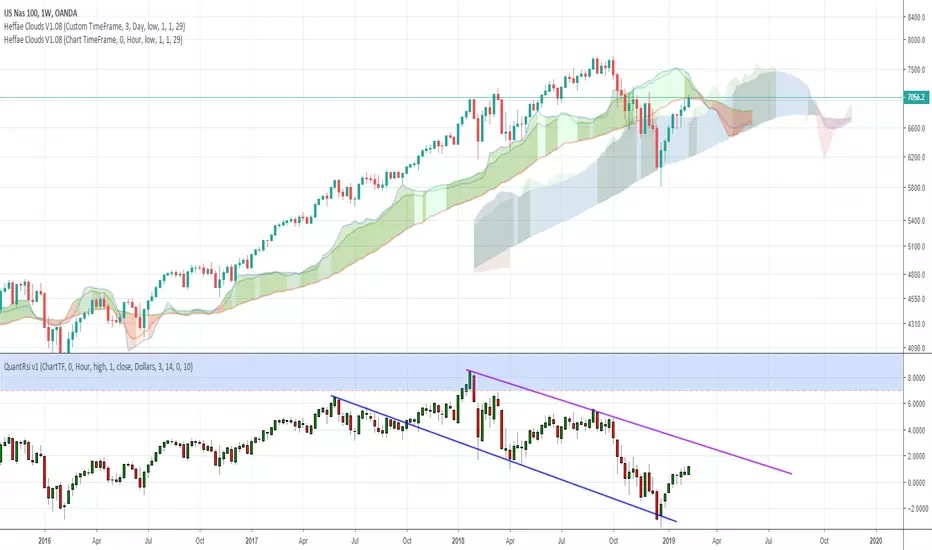
Heffae Clouds v1.00Heffae Clouds v1.0 - Ichimoku Modernized
Heffae Clouds Alpha release Version 1.0
Heffae Clouds functions as adaptive support and resistance. It has real-time paths and offset clouds, similar to ichimoku.
Paths are calculated by the complex discovery of prior behaviour for any crypto or forex asset.
Uses 5 single layer networks to calculate the optimal path fitting for any asset or timeframe.
The cloud color provides granular detail on path validity.
Please see the pastebin link for access information and links:
pastebin.com
Video introduction and trading strategy:
Some Beta-tester comments:
"It's like now having a microscope if you get what I mean. Which says great things about what you have done here. Love it man"
"I just find myself makes so many good decisions with your system it's hard to believe"
"this is without a doubt an improvement of Ichimoku (Which is my favorite tool by far). So much more info with your cloud system.."
Nefitty Cryptowave: Visual Control Lite 90DBest used under the influence of Com Truise
The wave will careen off the top and bottom of the channel. Use it to anticipate possible upcoming support and resistance lines. The midline is usually purple, and turns red when it is higher than the channel ceiling, 45 days back. Intended for daily timeframe only.
This indicator requires additional research:
Are there any leading indicators before the wave smashes into an edge?
How do we read it when it begins tightly hugging one extreme?
Can we use the midway line to predict changes?
That's it for now.
Godspeed, soldier.
- nefitty
Find me on r/cryptocurrency Discord


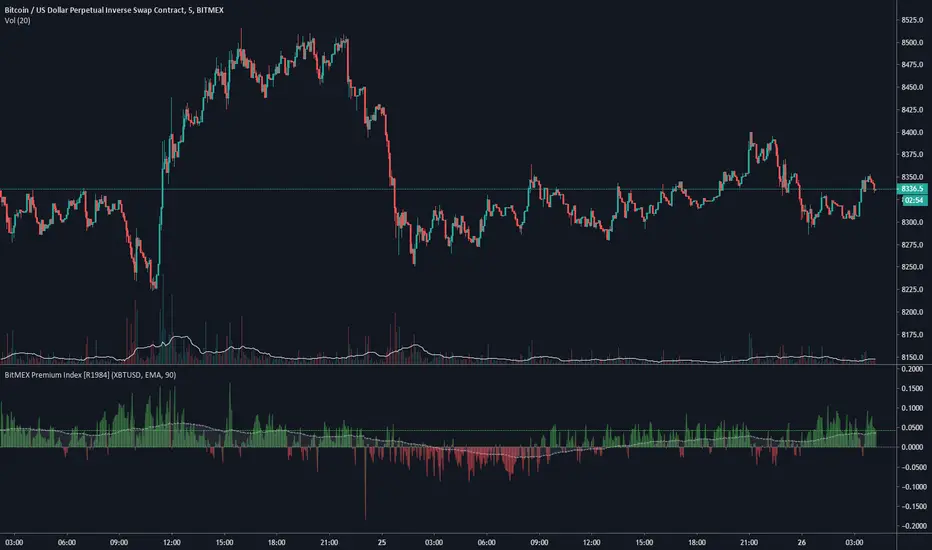
BitMEX Premium Index (.XBTUSDPI) [R1984]Basic indicator showing raw values of the BitMEX Premium Index (.XBTUSDPI) used in calculating the funding rate.
www.bitmex.com
www.bitmex.com
Funding rate indicator available here .
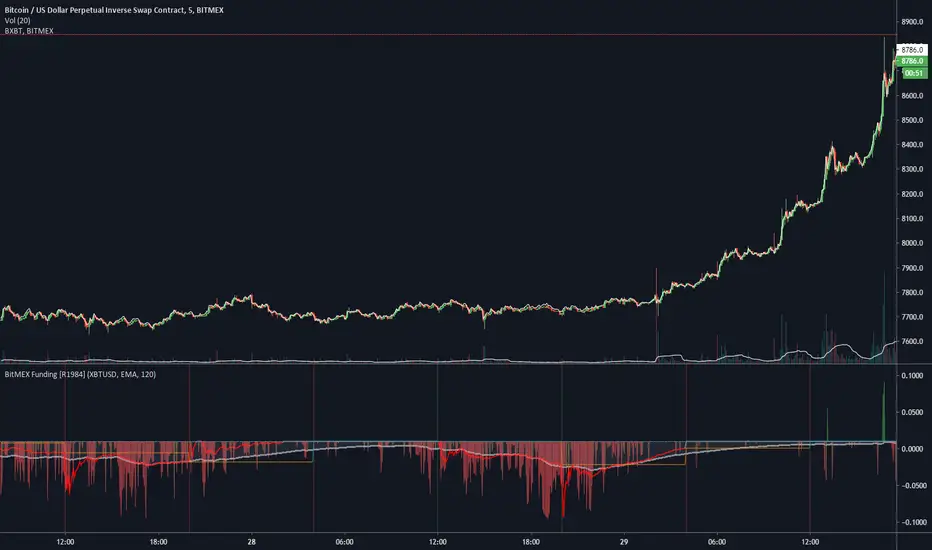
BitMEX Funding [R1984]This indicator attempts to emulate the BitMEX predicted funding rate for the XBTUSD perpetual swaps contract.
Reference
www.bitmex.com
www.bitmex.com
Indicator Key
Green/Red Area plot: Raw values of the calculated funding rate based on the XBTUSD Premium Index (.XBTUSDPI)
White Line plot: Time-Weighted Average Price (TWAP) of the calculated funding rate
Lime/Fuchsia Line plot: Predicted funding rate
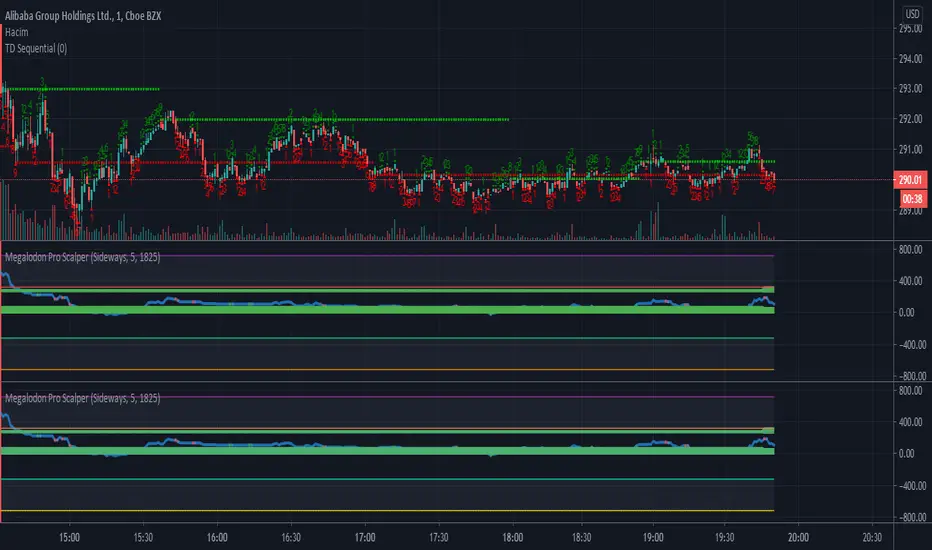
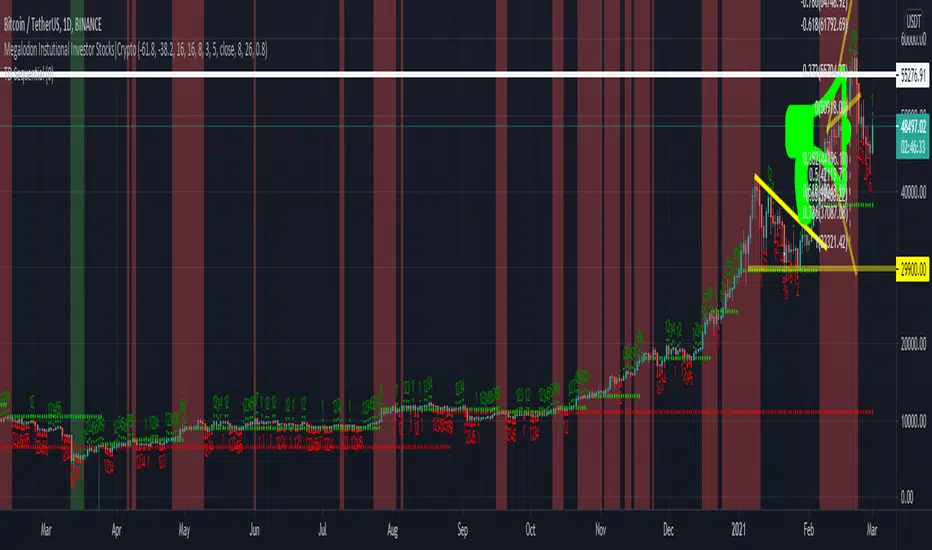
iPyra◬_theMegalodonTHEMEGALODON
theMegalodon looks for the institutional finger prints, the whales or the big boys.
theMegalodon is really simple to use.
theMegalodon combines the 8 different unique indicators, that each have almost perfect success rate.
theMegalodon works with any kind of market state, any kind of trading, and any kind of asset.
theMegalodon has more features than any other indicator in the market: Out of 9 working indicators, we have 3 momentum, 3 price and 3 volume indicators showing you the best signals.
--------------------------------------
theMegalodon is designed for us, the small fishes in the ocean, the millennials, the college students. This will basically makes us the new Megalodons(whale hunters).
All you have to do is:
1- Look for green or red arrows.
2- Look for orange or red candles.
3- Repeat
--------------------------------------
TECHNICAL DETAILS
Some boring info that you don't necessarily need to know.
1- Draws fibonacci retracement (s)' levels depending on your preferred look back period (Default: 365 and 120)
i) Can draw 2 fibs on the same chart. Can reverse the fib levels. Even, add an additional fib level to look for.
ii) Automatic fill function for a Reload Zone inside of a Reload Zone. *61.8% levels to 100% levels or 0% levels
2- Changes the color of the candle when strong buy(orange) or strong sell(red). Draws arrows on the chart for long and short positions.
i) Analyses and Combines
a) Price
b) Momentum
c) Volume
3- Prints out the indicators that are either giving Short or Long signs on the right corner.
4- The closer the unclebo indicator(click enable UncleBo) gets to the All time high, the better buy it is.
i) Same with the other way around. The closer it gets to the 0, the better sell it is.
5- Draws Bollinger Bands on the chart and shows where to buy or sell
6-The indicator is designed to be used in Daily time frame for the best calls to short or long.
--------------------------------------------------
iPyra◬
Enlighten others
Explosive PotentialThis script looks at times where MACD is within a specified range (very close to 0 values) and price action is very constrained (under 2%). Historically price has made a strong move after these conditions.
I typically run this on an 8H timeframe.
Review on BTCUSD and other cryptos.

UncleBo EasyVersion_BETAHey friends,
The Beta version of UncleBo indicator.
Trying to make it as simple and powerful as possible.
I will publish it once i feel like it does the job perfect.
----------------------
For more details and inquiries please pm me.

My Custom indicator & Strategy for trading BTC in 5min UTHello,
If your goal is to make some BTC, this script might be for you.
I tested it on the ETH/BTC Binance chart.
About the indicator :
In short, it will help you for several things :
Avoid losing BTC when the trend goes bearish.
Earn BTC during any bullish trend.
Earn BTC when the market is in trading range by bouncing off trend lines, while anticipating a new potential trend.
I based my algorithm on several technical tools such as volume, RSI, pivot, for a total of 6 boolean conditions mixed together with AND and OR gates, resulting in those entry points (shapes)
About the Strategy :
I only used long entries and exits. No shorting.
The commission rate is set to 0.05% (binance)
The backtesting results in only 40€ of net profit for a 1000€ inital capital, it may seem litle BUT during the testing period (18 days, 40 trades) the coin (ETH) dropped in BTC value ( -25% ). You make 4% while a simple Holder would lose -25%, which is 29% difference.
Since I worked hard on this script, I'll grant access to only those willing to make a small donation, that'd really help me reach my goal of making a living with trading. I will also give you any info you want and give you everything need to set up alerts. Thank you very much.

Rainbow RoadRainbow Road allows you to visualise the price in relation to the barriers of support and resistance that are the moving averages. The price can be observed breaking above barriers , or falling below them.
Rainbow Road displays these bands like a ribbon so that the strength or weakness of a security such as Bitcoin, can be observed in a very vibrant and obvious fashion.
The name "Rainbow Road" is inspired by the final course of the Special Cup featured in all Mario Kart games and is the climactic course of each game it appears.
.,-'"*.,-'"*Housekeeping*"'-,.*"'-,.
In order for you to make your chart look exactly like this one when you apply the Rainbow Road indicator, you will need to follow these simple steps.
1. Right click on your chart -> Price Scale -> Undo Indicator Labels
2. Right click on your chart -> Price Scale -> Undo Indicator Last Value
3. Right click on your chart -> Color Theme -> Black
4. Right click on your chart -> Properties -> Background -> Vert Grid Lines -> Slide transparency bar -> Horz Grid Lines -> Slide transparency bar
@#$%@#$%@#$%@#$%@#$%@#$%@#$%@#$%@#$%@#$%@#$%@#$%@#$%@#$%@#$%@#$%@#$%@#$%@#$%@#$%@%
I appreciate the feedback of all of my followers!
Like and follow for more awesome indicators!

UncleBoUncleBo looks for the institutional finger prints, the whales or the big boys.
Looks for price, volume , momentum analysis tools and COMBINES the most famous indicators.
Works for any kind of market.
Only thing you have to do is forget about any indicator you used before and look at lines. This helps you overcome your emotions.