CM_Ultimate_MA_MTF_V3 GUNBOTWork in progress... Added new MAs with variable smoothing... EhlersSuperSmoother, EhlersEmaSmoother, xema. Added additional alerts for gunbot or similar cryptobots. Couldn't find the original author of the new MAs, so if you are, drop me a line for credit.
Ehlers

Fisher Transform Money Flow IndexThis is an experimental indicator by applying Money Flow Index with Fisher Transform. i found MFI code and Fisher transform code from public library.
Use longer length to find divergence. Tune the length and samples according to your trading style and instrument

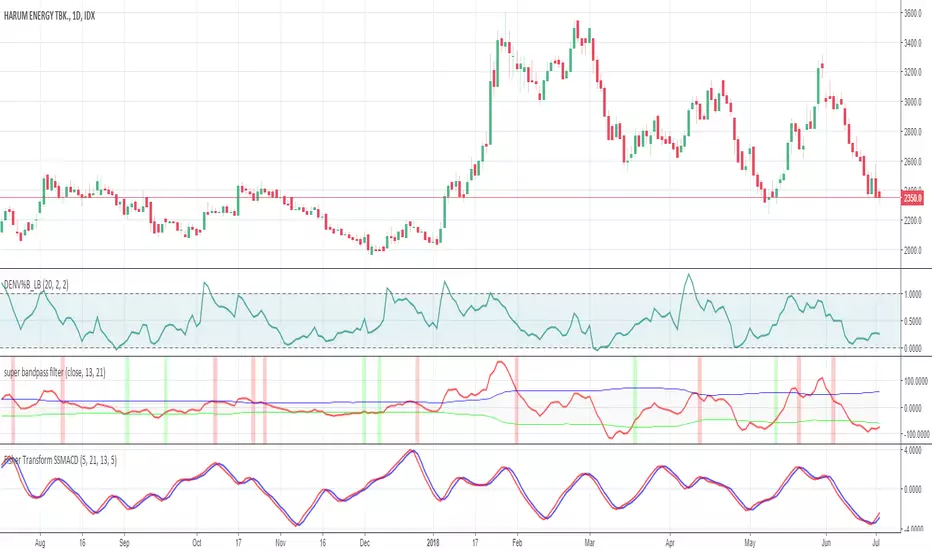
Fisher Transform SuperSmoothed MACD // This is a modification of Supersmoothed MACD (created by KIVANC using EHLERS' SUPER SMOOTHER FILTER) and sharpenned with Ehler fisher transform
//all lengths and parameters are completely configurable, tune the length according to your instrument
//give me what you think
Ehlers DSMA by Tim D.The Deviation-Scaled Moving Average from July 2018 TASC. "In “The Deviation-Scaled Moving Average” in this issue, author John Ehlers introduces a new adaptive moving average that has the ability to rapidly adapt to volatility in price movement. The author explains that due to its design, it has minimal lag yet is able to provide considerable smoothing."

Ehlers Stochastic Cyber CycleEhlers Stochastic Cyber Cycle indicator script.
This indicator was originally developed by John F. Ehlers (see his book `Cybernetic Analysis for Stocks and Futures`, Chapter 8: `Stochasticization and Fisherization of Indicators`).

Ehlers Cyber CycleEhlers Cyber Cycle indicator script.
This indicator was originally developed by John F. Ehlers (see his book `Cybernetic Analysis for Stocks and Futures`, Chapter 4: `Trading the Cycle`).
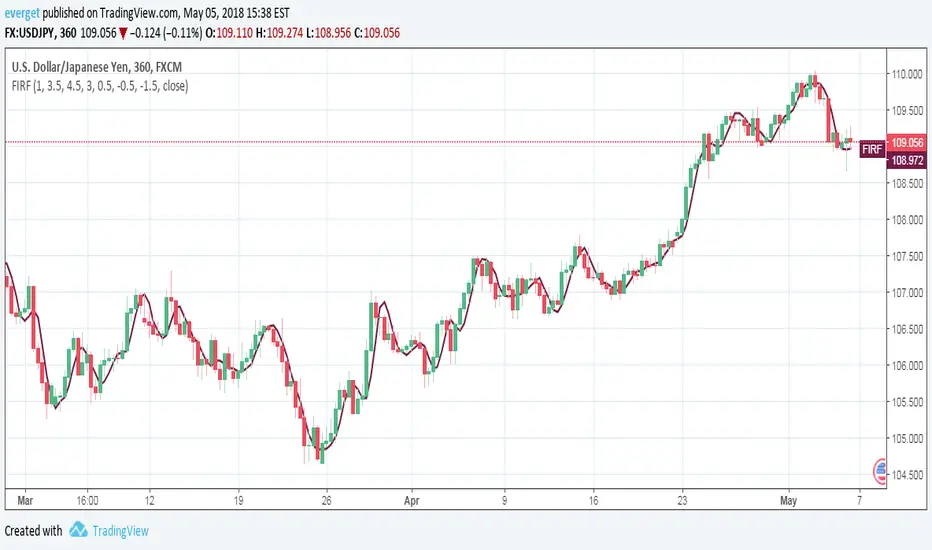
Finite Impulse Response (FIR) FilterFinite Impulse Response (FIR) Filter indicator script.
This indicator was originally developed by John F. Ehlers (Stocks & Commodities V. 20:7 (26-31): Zero-Lag Data Smoothers).
NOTE: Ehlers' favorite FIR filter had 1, 2, 3, 3, 2, 1, 0 coefficients.
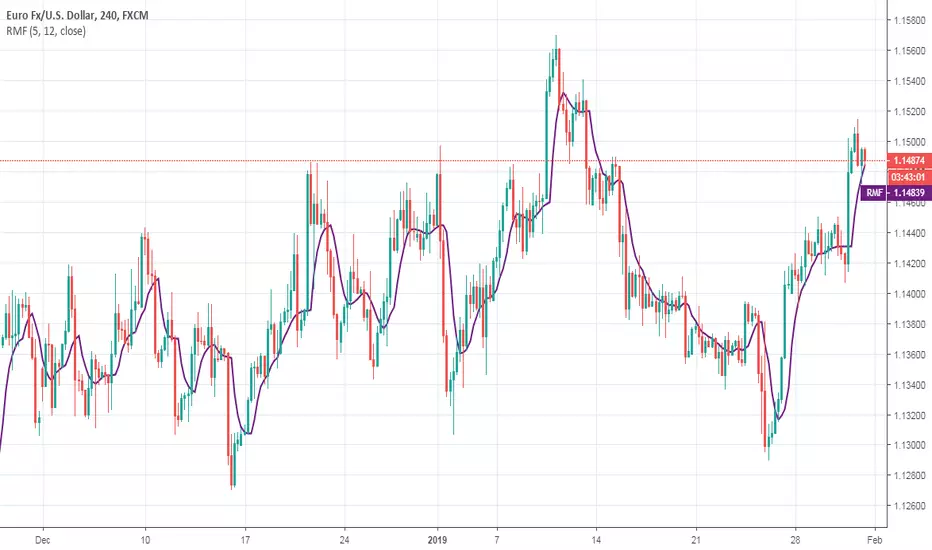
Recursive Median FilterRecursive Median Filter indicator script.
This indicator was originally developed by John F. Ehlers (Stocks & Commodities V. 36:03 (8–11): Recursive Median Filters).
Recursive Median OscillatorRecursive Median Oscillator indicator script.
This indicator was originally developed by John F. Ehlers (Stocks & Commodities V. 36:03 (8–11): Recursive Median Filters).

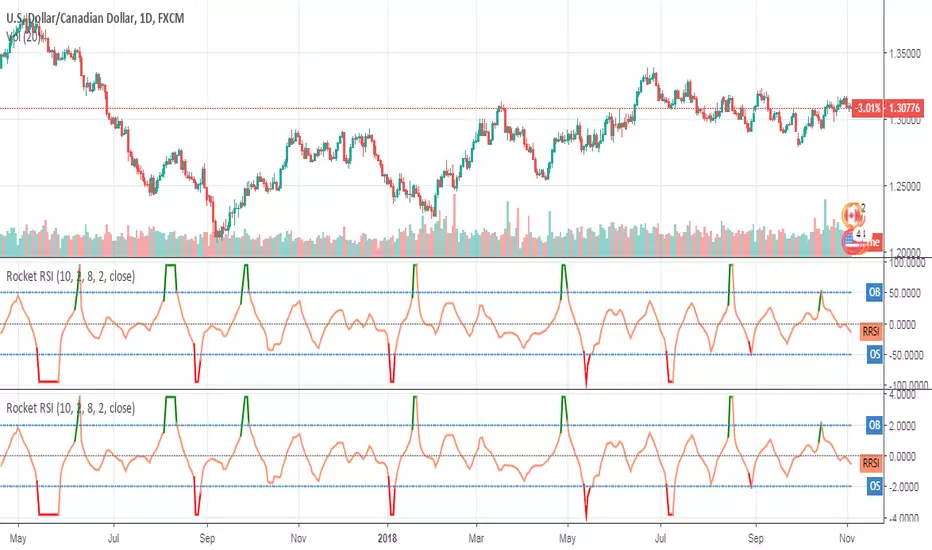
Rocket RSIRocket RSI indicator script.
This indicator was originally developed by John Ehlers (Stocks & Commodities V.36:6, RocketRSI - A Solid Propellant For Your Rocket Science Trading).
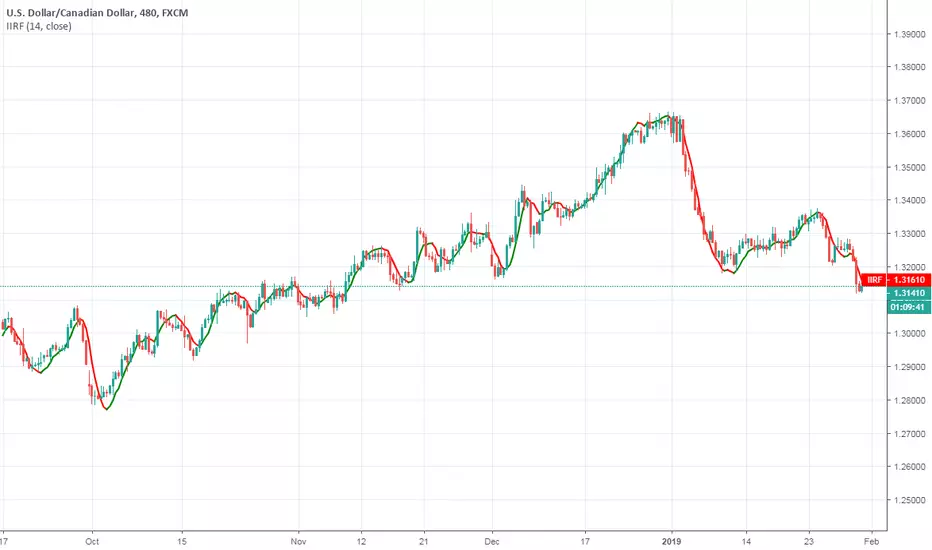
Infinite Impulse Response (IIR) FilterInfinite Impulse Response (IIR) Filter indicator script.
This indicator was originally developed by John Ehlers (Stocks & Commodities V. 20:7 (26-31): Zero-Lag Data Smoothers).
Adaptive Laguerre FilterAdaptive Laguerre Filter indicator script.
The Adaptive Laguerre Filter was originally developed and described by John Ehlers in his paper `Time Warp – Without Space Travel`.
Thanks to @apozdnyakov for the sorting solution.

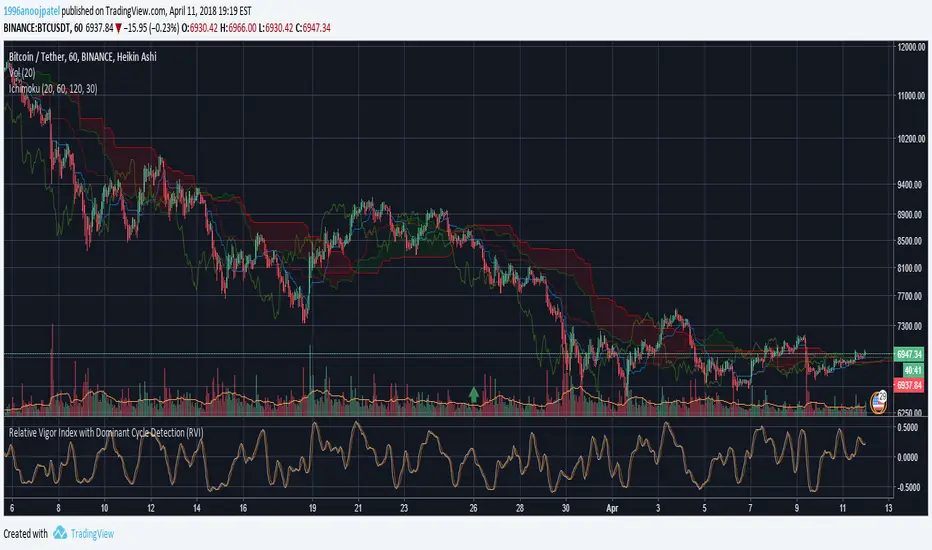
Relative Vigor Index with Dominant Cycle Detection (RVI)Relative Vigor Index with Dominant Cycle Detection. As Ehler's mentioned, fixed length look back is inherently flawed when it is possible to extract a length from a dominant price cycle. may be less effective if signal to noise ratio is greater than 2, but that usually would not happen at >5m candles, and honestly shouldn't be looking at RV(igor)I when price is moving sideways.
Read just like an RVGI, but adjusted to the current time frame. To reduce noise, changing to heiken ashi will help with signals as well. Let me know if there are improvements!
Made for JD, the OG.
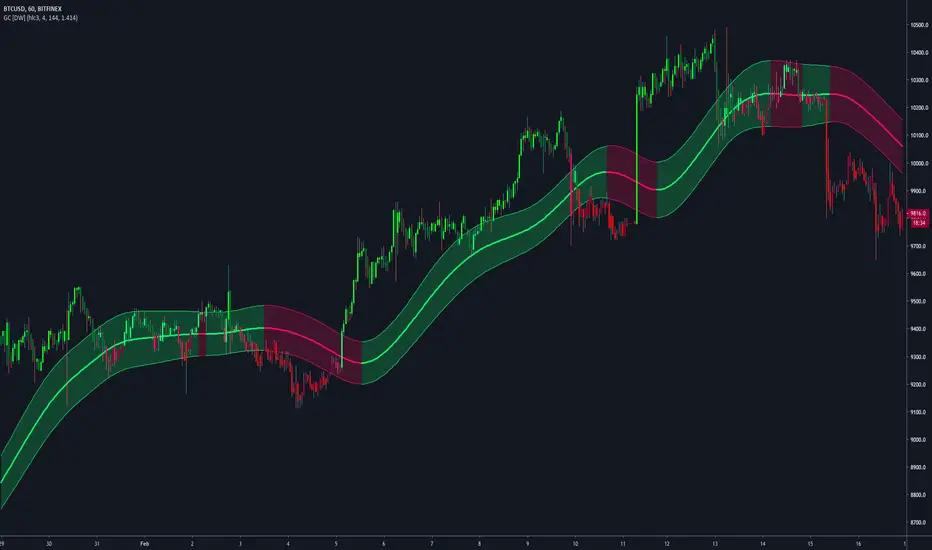
Gaussian Channel [DW]This study is an experiment utilizing the Ehlers Gaussian Filter technique combined with lag reduction techniques and true range to analyze trend activity.
Gaussian filters, as Ehlers explains it, are simply exponential moving averages applied multiple times.
First, beta and alpha are calculated based on the sampling period and number of poles specified. The maximum number of poles available in this script is 9.
Next, the data being analyzed is given a truncation option for reduced lag, which can be enabled with "Reduced Lag Mode".
Then the alpha and source values are used to calculate the filter and filtered true range of the dataset.
Filtered true range with a specified multiplier is then added to and subtracted from the filter, generating a channel.
Lastly, a one pole filter with a N pole alpha is averaged with the filter to generate a faster filter, which can be enabled with "Fast Response Mode".
Custom bar colors are included.
Note: Both the sampling period and number of poles directly affect how much lag the indicator has, and how smooth the output is.
Larger inputs will result in smoother outputs with increased lag, and smaller inputs will have noisier outputs with reduced lag.
For the best results, I recommend not setting the sampling period any lower than the number of poles + 1. Going lower truncates the equation.
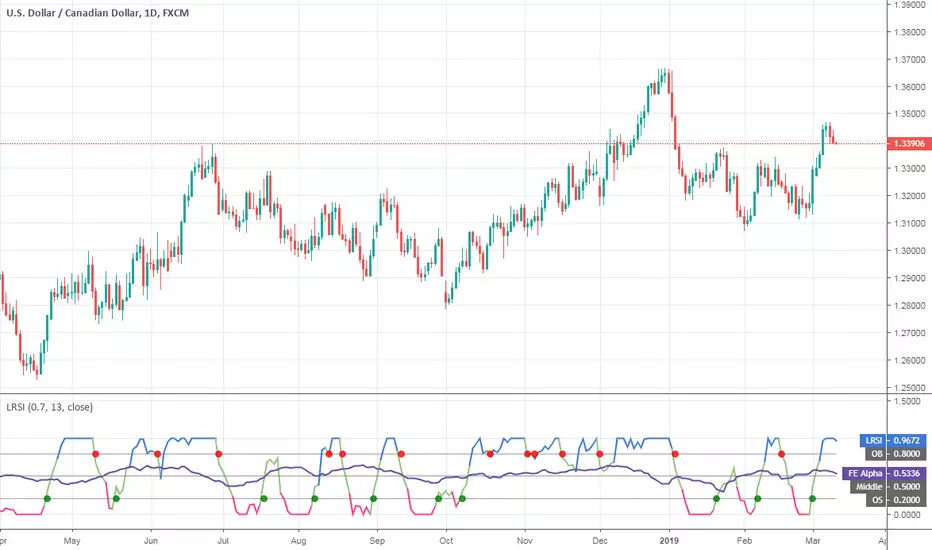
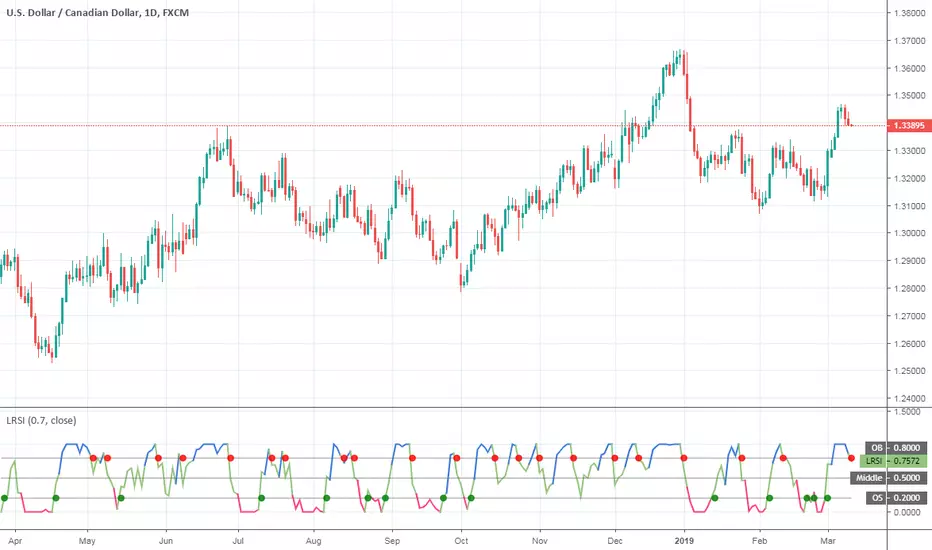
Laguerre RSI (Self Adjusting Alpha with Fractals Energy)Laguerre RSI (Self Adjusting Alpha with Fractals Energy) indicator script. I adopted idea from www.prorealcode.com and
If you disable `Apply Fractals Energy` option, you will get the original Laguerre RSI.
The Perfect RSI (Ehler's Cycle RSI Modified with Discriminator)This is the RSI indicator that I use. It combines two concepts of John Ehler. It integrates the idea of Highpass filtering the Price data, along with the the idea of automatically determining the Dominant price cycle through a Homodyne Discriminator, and using half of a cycle length as the input for the RSI. Not only determines the most effective range for the RSI by setting it based on the cycle, but also makes the RSI PDF(Probability Distribution Function) adjustable as shown in John Ehler's papers. Still needs some tweaking on determining the best calculations for cycles, and whether or not to better filter the price data into the discriminator.
Works just like a normal RSI, but should have less false signals, and also has the option for super smoothing. Play around it and see if theres any new indications or signals that come from it ;)
Let me know if there's any concerns or additions!

Moving Average Bundle3 Moving Average Lines. All parameters are configurable via user input.
Each of these moving average lines already exist as individual indicators in TradingView. This script just bundles them for one stop shopping. It's helpful if you're limited by the number of indicators per chart. And highly educational: quickly compare the different averaging methods!
sma: Simple Moving Average
rma: Recursive Moving Average
ema: Exponential Moving Average
wma: Weighted Moving Average
vma: Volume Weighted Moving Average
wma: Weighted Moving Average
alma: Arnaud Legoux Moving Average
Note: Only Pine built-in functions are included.

CG Oscillator (Center of Gravity)CG Oscillator indicator script. This indicator was originally developed by John Ehlers.

Normalized Relative Vigor IndexThis is the Relative Vigor Index indicator just multiplied by 100 to have non-zero integer part

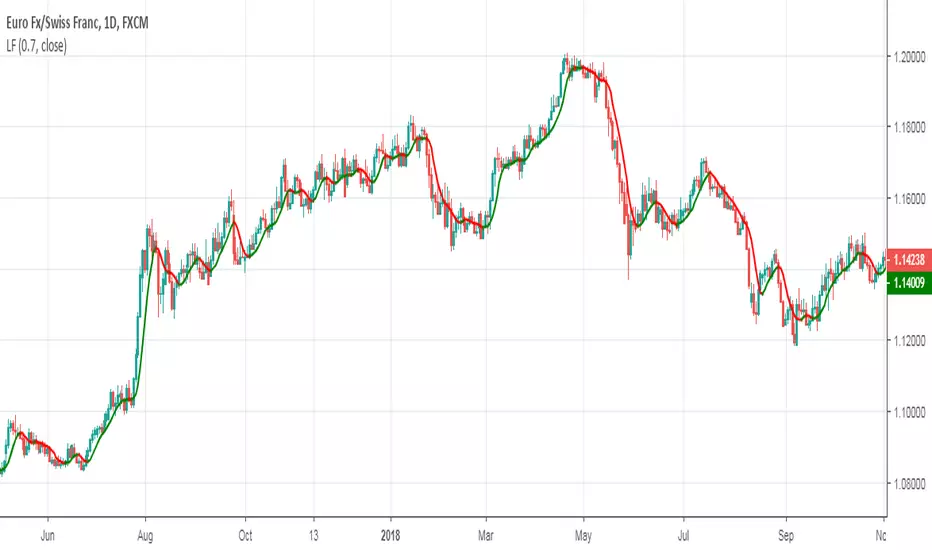
Laguerre FilterLaguerre Filter indicator based on the John Ehler's article "Time Warp – Without Space Travel" about the Laguerre Transform

Fisher Transform Ribbons Indicator V1.0Utilizing the Fisher Transform by Ehlers with different lengths based on multipliers will allow you to notice movements in price and understand whether the shift was a correctional wave, or part of the overall trend.
To learn about Fisher Transform , check out the Fisher Transform documentation: www.mesasoftware.com
Fisher has plenty of functionalities. Ribbons provides you with a view of consistency in price action. If all ribbons flip, generally this is a strong signal that the trend is changing. Fisher is extremely punctual (minimum input lag) and robust (doesn't miss movement). Look for everything, including divergences, trends, and Oversold, Overbought points.
Changing length will further provide you more sensitivity in overselling and buying, while numbing chop.
Enjoy!
And for a single Fisher, check out HPotter's Fisher Transform or LazyBear's implementation of the inverse of the Fisher, which has many other interesting properties
