DeltaPulseDeltaPulse: Professional Cumulative Volume Delta Indicator
DeltaPulse is a free cumulative volume delta (CVD) indicator engineered for modern traders who demand precision, adaptability, and visual clarity. Unlike traditional CVD tools that often suffer from scaling issues, excessive noise, or poor responsiveness across timeframes, DeltaPulse delivers a streamlined, professional-grade solution that "just works" – providing actionable insights into buying and selling pressure with minimal setup.
This indicator accumulates the net difference between buying and selling volume (inferred from candle direction), normalizes it intelligently for consistent readability, and applies advanced smoothing to filter out market noise while preserving momentum signals. The result is a clean, momentum-colored line in a dedicated pane, enhanced by subtle visual cues that highlight key market dynamics.
Whether you're a day trader scalping intraday moves, a swing trader analyzing weekly trends, or an institutional analyst reviewing futures contracts, DeltaPulse adapts seamlessly to your workflow. It's designed to be your go-to tool for confirming trends, spotting divergences, and identifying order flow imbalances – all without the bloat of overcomplicated features.
Key Features
Intelligent Normalization for Universal Compatibility
Automatically adjusts scaling based on chart timeframe and symbol volume profile.
Intraday (1-5 min): Uses a 100-period volume average for responsive, lively signals.
Intraday (15+ min): 50-period average for balanced sensitivity.
Daily/Weekly+: 20-period average for clean, long-term perspective.
Ensures the indicator remains visually meaningful and non-flat on any asset – from low-volume penny stocks to high-liquidity indices like ES or NQ.
Advanced Smoothing Options
Six moving averages to match your trading style:
EMA - Quick reactions to recent delta shifts
SMA - Simple Moving Average - Stable, noise-resistant baseline
WMA - Weighted Moving Average - Emphasizes recent data with linear weighting
HMA - Hull Moving Average - Ultra-smooth yet lag-free – ideal for momentum trading
RMA - Running Moving Average (Wilder's) - Trend-following with minimal whipsaws
VWMA - Volume-Weighted Moving Average - Highlights high-volume delta moves
Lower values increase reactivity; higher values enhance smoothness.
Flexible Reset Mechanisms
Session Reset: Clears CVD at the first regular trading bar each day – perfect for intraday analysis.
Weekly Reset: Resets at the start of each new week – suited for swing and position trading.
No manual intervention required; the indicator handles resets reliably across all timeframes.
Background Shading:
Light green tint above zero; light red below.
Extreme highlights when smoothed CVD exceeds 90% of its 80-bar high/low – flags potential exhaustion or absorption zones.
How It Works
DeltaPulse calculates a simple yet effective volume delta on each bar:
Bullish Bar (close ≥ open): Adds full volume as positive delta.
Bearish Bar (close < open): Subtracts full volume as negative delta.
This raw delta accumulates into a running total (CVD), resetting based on your chosen mode. The total is then:
Normalized against a timeframe-adaptive volume average to ensure consistent scaling.
Smoothed using your selected MA type for noise reduction and trend clarity.
Plotted with momentum-based coloring and visual enhancements.
The output is a single, intuitive line that reveals the underlying battle between buyers and sellers – far more reliably than raw volume bars or basic oscillators.
Trading Applications
DeltaPulse shines in revealing order flow dynamics that price action alone often conceals. Here are proven ways to integrate it:
Trend Confirmation & Momentum Trading
Bullish Setup: Rising green line above zero confirms buyer control – enter longs on pullbacks to support.
Bearish Setup: Falling red line below zero signals seller dominance – short on rallies to resistance.
Zero Line Crosses as Reversal Signals
A crossover from negative to positive territory often marks a sentiment shift – use for entry triggers.
Combine with volume spikes or key levels for high-probability setups.
Enhancement: VWMA mode amplifies signals on high-volume breakouts.
Absorption & Exhaustion Zones
Watch for extreme background highlights: A spike to highs followed by reversal suggests large players absorbing supply.
Ideal for fade trades near overextended levels (e.g., after news events).
Avoid low-volume or illiquid symbols, as delta inference relies on reliable candle data.
Timeframe-Agnostic: Solves the common CVD pitfall of being "dead" on intraday charts or erratic on daily ones through smart, automatic normalization.
Lag-Free Responsiveness: The default HMA smoothing strikes a rare balance – smoother than EMA, faster than SMA – without the computational overhead of exotic filters.
Zero Clutter: No histograms, no extraneous plots, no overwhelming alerts. Just pure, distilled order flow intelligence.
CVD

CVD Candle Divergence IndicatorThis indicator identifies potential reversal points by comparing the direction of price candles with the direction of cumulative volume delta (CVD) candles, while applying additional filters based on RSI behavior, volume strength, and candlestick wick structure.
It aims to highlight situations where price movement and volume delta disagree, which can signal fading momentum or absorption.
Core Concept
The script combines several independent conditions that must occur simultaneously before a signal is displayed on the chart. A signal appears only when all filters agree, reducing the number of low-quality or noise-based setups.
1. CVD Candle Direction
The indicator uses TradingView’s built-in function for volume delta candles. These candles summarize buying and selling aggression derived from lower-timeframe volume.
A CVD green candle indicates more buyer-initiated volume.
A CVD red candle indicates more seller-initiated volume.
The script looks for instances where price and CVD candles disagree:
Bullish signal: price candle is green while CVD candle is red
Bearish signal: price candle is red while CVD candle is green
This creates a form of divergence using volume delta instead of price highs and lows.
2. RSI Context Filter
Momentum is evaluated through RSI. Instead of relying only on standard overbought/oversold levels, the script also includes a recency filter based on the RSI midline (50 level).
RSI Threshold
Users can specify the RSI value required for bullish and bearish conditions.
Recency Filter
The indicator only allows signals if RSI has crossed the 50 level within a user-defined number of bars. This prevents signals during extended one-directional trends where divergence is less meaningful.
3. Volume Strength Filter
Signals are filtered through a volume-based requirement:
Current volume must exceed a moving average of volume multiplied by a user-defined factor.
This ensures that signals appear only during periods with sufficient participation and reduces noise during low-volume consolidation.
4. Wick-to-Body Ratio Filter
To incorporate price-action characteristics, the script evaluates the wick structure of each candle:
Bullish signals require a sufficiently large lower wick relative to the total candle range.
Bearish signals require a sufficiently large upper wick relative to the total candle range.
The wick percentage is fully configurable.
This adds a rejection or absorption component to the logic and prevents signals on weak or indecisive candles.
Signal Conditions
A bullish signal appears when all of the following are true:
Price candle is green
RSI is below the bullish threshold
CVD candle is red
Volume is above its threshold (if enabled)
RSI has interacted with the 50 level recently
Lower wick meets the wick-percentage requirement
A bearish signal requires the opposite conditions:
Price candle is red
RSI is above the bearish threshold
CVD candle is green
Volume is above its threshold (if enabled)
RSI recently interacted with the 50 level
Upper wick meets the wick-percentage requirement
Signals appear as arrows directly on the chart.
Use Cases
This indicator is intended for traders who work with:
Momentum shifts
Volume delta analysis
Candle structure-based confirmation
Reversal or exhaustion setups
Divergence concepts beyond price highs/lows
It does not predict market direction. Instead, it highlights areas where multiple conditions suggest a potential imbalance between price movement and volume delta.
I would strongly suggest to use this indicator only on timeframes 2-15m.
Here are a few examples:

Volume Analysis🙏🏻 (signed) Volume Analysis is 2 of 2 structural layer / ordeflow analysis scripts, while the first one is Liquidity Analysis. Both are independent so can’t be released together as a single script, but should be used together.
The same math used in this script can be applied to other types of aggressive volume data: non-aggregated flow of market orders, volume traded of put vs call options.
There’s no universal agreement about terminology, but this script works with volumes signed by the aggressor who initiated a transaction. Then these volumes get aggregated by time and a cumulative sum is calculated. Mostly this is widely known as Cumulative Volume Delta.
However this script works with 'inferred' volumes vs the provided ones. It’s the better choice for equities, bonds; neutral choice for currencies; and suboptimal choice for natural and artificial commodities.
Contents:
Output description;
How to analyze & use the outputs;
How to use it together with Liquidity Analysis script;
How did I use both scripts to finish The Leap profitably and skipped many losses.
1. Output description
Color of the CVD line reflects (signed) volume imbalance state: red is negative, purple is neutral, blue is positive.
3 purple lines are lower deviation (lower band), basis (middle band), upper deviation (upper band): used to generate signals by a ruleset that would be explained in a minute
Gray number in the script’s status line is the advised input you may put into Inferred volume multiplier in script’s setting, I will explain it
Vertical dash line marks the moving window end, this way you can be certain over what exact data you see the profile was built.
2. How to analyze & use the outputs
Setup up the script:
Moving window length: set it to ~ ¼ of your data analysis window. E.g if you see on your charts and use ~ 256 bars, set the length to 64.
Inferred volume multiplier: you can easily leave it 256, this is not a critical factor for the math, it’s mostly there if you want to ~ equate inferred volumes with real ones in scale. For this, use the gray number in the script status line, it’s calculated as ratio of long term real volumes weighted avg to long term inferred volumes weighted avg.
Again, changing the inferred volume multiplier won’t affect the math.
Use 2 timeframes: main one and a far lower one 3 steps down, just like on the screenshot.
Find out current volume imbalance state:
As mentioned before, based on CVD line color, it can be negative, neutral or positive. This is the state variable that changes slowly and denies/confirms the signals generated by crossovers of CVD line and 3 purple thresholds.
For this I use my own very fast and lightweight metric that is totally statistically grounded, utilizes temporal information, and calculates volume imbalance without using heavy math like regressions as it’s usually done. It also provides a natural neutral zone, when volume imbalance is not strong enough to be confirmed.
...
CVD-based signals:
First you need to understand what precisely a touch of a threshold is:
Touch: an event when either of these 2 happens:
One CVD datapoint is above the threshold, and the next CVD datapoint is below the threshold
One CVD datapoint is below the threshold, and the next CVD datapoint is above the threshold
These are usually called crossovers/crossunders.
Now with the 3 purple thresholds we follow this logic:
Monitor the last touched threshold;
Once another threshold is touched, here we may generate a signal but only once !, after the first generated signal at that threshold we can’t generate more signals on this threshold, we need to wait when CVD comes to another threshold.
If CVD touches one threshold, and then goes down and touches another threshold downwards, we wait when CVD makes a datapoint above this threshold. When it happens, we register a long signal
If CVD touches one threshold, and then goes up and touches another threshold upwards, we wait when CVD makes a datapoint below this threshold. When it happens, we register a short signal
However, don’t open new trades against the current volume imbalance state. So don’t open shorts when the CDV line is blue, and don’t open longs when CVD line is red.
Btw, this technique I call it “reclaim” of a level/threshold. It can be applied to horizontal levels, and it’s very powerful especially when you fade levels on very volatility assets like BTC. This technique allows you to Not fade a level straight away, but wait when price goes past the level a bit, and then comes back and reclaims it, only there you enter, and moreover you now have a very well defined risk point.
The last part is multi-timeframe logic. Prefer to act when a lower timeframe is Not against the main timeframe. That’s all, no multiple higher timeframes are needed.
3. How to use it together with Liquidity Analysis script.
That script also has a mean to generate its own signals, and another state variable called Liquidity Imbalance.
So now you’re not only looking at volume imbalance but also at liquidity imbalance that would deny/confirm the CVD based signal. You need at least one of these two to favor your long or short.
This is the same logic widely used in HFT, where MM bots cancel/shift/resize orders when book is too onesided And ordeflow is one sided as well.
4. How did I use both scripts to finish The Leap profitably and skipped many losses.
Even tho you can use structural information as your main strategic layer, as many so-called orderflow traders do, I traded in objective style: my fade signals were volatility based in essence, and I used ordeflow for better entries and stops, but most importantly to skip losses.
When ‘both‘ liquidity imbalance and volume imbalance (in their main timeframes) were against my trades, I skipped them all, saving many ~$500 stop losses (that was my basis risk unit for the Leap). Unless I had a very strong objective signal, i.e. confluence of several signals, or just one higher timeframe signal, I did all these skips.
I traded ~ intraweek timeframe, so I was analyzing either the last 230 30min bars or 1380 5min bars. Both Liquidity Analysis and (signed) Volume Analysis scripts were set to moving window length 46 or 276 for either granularity.
I finished the leap with 9% profit and max DD ~ 5%, a bit short of my goal of 12.5%. If not these 2 scripts I would’ve finished a bit above breakeven I think.
,,,
Another thing, I made these 2 scripts invite-only because they are made particularly for trading, particularly for certain types of market data. These are tools adapted for particular use case, not like my other posts with general math entities like Kernel Density Estimation or Kalman filter, that you can take and apply properly on any data you need yourself.
However these are made from general math entities like everything else. ‘All’ the components are available in my other scripts, ideas, and other sources related to me. If you want to reverse-engineer these, you can find all the components you need in my already posted open source work.
∞

Volume Pressure OscillatorThe Volume Pressure Oscillator (VPO) is a momentum-based indicator that measures the directional pressure of cumulative volume delta (CVD) combined with price efficiency. It oscillates between 0 and 100, with readings above 50 indicating net buying pressure and readings below 50 indicating net selling pressure.
The indicator is designed to identify the strength and sustainability of volume-driven trends while remaining responsive during consolidation periods.
How the Indicator Works
The VPO analyzes volume flow by examining price action at lower timeframes to build a Cumulative Volume Delta (CVD). For each chart bar, the indicator looks at intrabar price movements to classify volume as either buying volume or selling volume. These classifications are accumulated into a running total that tracks net directional volume.
The indicator then measures the momentum of this CVD over both short-term and longer-term periods, providing responsiveness to recent changes while maintaining awareness of the broader trend. These momentum readings are normalized using percentile ranking, which creates a stable 0-100 scale that works consistently across different instruments and market conditions.
A key feature is the extreme zone persistence mechanism. When the indicator enters extreme zones (above 80 or below 20), it maintains elevated readings as long as volume pressure continues in the same direction. This allows the VPO to stay in extreme zones during strong trends rather than quickly reverting to neutral, making it useful for identifying sustained volume pressure rather than just temporary spikes.
What Makes This Indicator Different
While many indicators measure volume or volume delta, the VPO specifically measures how aggressively CVD is currently changing and whether that pressure is being sustained. It's the difference between knowing "more volume has accumulated on the buy side" versus "buying pressure is intensifying right now and shows signs of continuation."
1. Focus on CVD Momentum, Not CVD Levels
Most CVD indicators display the cumulative volume delta as a line that trends up or down indefinitely. The VPO is fundamentally different - it measures the slope of CVD rather than the absolute level. This transforms CVD from an unbounded cumulative metric into a bounded 0-100 oscillator that shows the intensity and direction of current volume pressure, not just the historical accumulation.
2. Designed to Stay in Extremes During Trends
Unlike traditional oscillators that treat extreme readings (above 80 or below 20) as overbought/oversold reversal signals, the VPO is engineered to oscillate within extreme zones during strong trends. When sustained buying or selling pressure exists, the indicator remains elevated (e.g., 80-95 or 5-20) rather than quickly reverting to neutral. This makes it useful for trend continuation identification rather than exclusively for reversal trading.
3. Percentile-Based Normalization
The VPO uses percentile ranking over a lookback window, which provides consistent behavior across different instruments, timeframes, and volatility regimes without constant recalibration.
4. Dual-Timeframe Momentum Synthesis
The indicator simultaneously considers short-term CVD momentum (responsive to recent changes) and longer-term CVD momentum (tracking trend direction), weighted and combined with a slow-moving trend bias. This multi-timeframe approach helps it stay responsive in ranging markets while maintaining context during trends.
How to Use the Indicator
Understanding the Zones:
80-100 (Strong Buying Pressure): CVD momentum is strongly positive. In trending markets, the indicator oscillates within this zone rather than immediately reverting to neutral. This suggests sustained accumulation and trend continuation probability.
60-80 (Moderate Buying): Positive volume pressure but not extreme. Suitable for identifying pullback entry opportunities within uptrends.
40-60 (Neutral Zone): Volume pressure is balanced or unclear. No strong directional edge from volume. Often seen during consolidation or trend transitions.
20-40 (Moderate Selling): Negative volume pressure developing. May indicate distribution or downtrend continuation setups.
0-20 (Strong Selling Pressure): CVD momentum is strongly negative. During downtrends, sustained readings in this zone suggest continued distribution and downside follow-through probability.
Practical Applications:
Trend Confirmation: When price makes new highs/lows, check if VPO confirms with similarly elevated readings. Divergences (price making new highs while VPO fails to reach prior highs) may indicate weakening momentum.
Range Trading: During consolidation, the VPO typically oscillates between 30-70. Readings toward the low end of the range (30-40) may present accumulation opportunities, while readings at the high end (60-70) may indicate distribution zones.
Extreme Persistence: If VPO reaches 90+ or drops below 10, this indicates exceptional volume pressure. Rather than fading these extremes immediately, monitor whether the indicator stays elevated. Sustained extreme readings suggest strong trend continuation potential.
Context with Price Action: The VPO is most effective when combined with price action or other orderflow indicators. Use the indicator to gauge whether volume is confirming or contradicting.
What the Indicator Does NOT Do:
It does not provide specific entry or exit signals
It does not predict future price direction
It does not guarantee profitable trades
It should not be used as a standalone trading system
Settings Explanation
Momentum Period (Default: 14)
This parameter controls the lookback period for CVD rate-of-change calculations.
Lower values (5-10): Make the indicator more responsive to recent volume changes. Useful for shorter-term trading and more active oscillation. May produce more whipsaws in choppy markets.
Default value (14): Provides balanced responsiveness while filtering out most noise. Suitable for swing trading and daily timeframe analysis.
Higher values (20-50): Create smoother readings and focus on longer-term volume trends. Better for position trading and reducing false signals, but with slower reaction to genuine changes in volume pressure.
Important Notes:
This indicator requires intrabar data to function properly. On some instruments or timeframes where lower timeframe data is not available, the indicator may not display.
The indicator uses request.security_lower_tf() which has a limit of intrabars. On higher timeframes, this provides extensive history, but on very low timeframes (<1-minute charts), the indicator may only cover limited historical bars.
Volume data quality varies by exchange and instrument. The indicator's effectiveness depends on accurate volume reporting from the data feed.

CVD [able0.1]# CVD Overlay iOS Style - Complete User Guide
## 📖 Table of Contents
1. (#what-is-cvd)
2. (#installation-guide)
3. (#understanding-the-display)
4. (#reading-the-info-table)
5. (#settings--customization)
6. (#trading-strategies)
7. (#common-mistakes-to-avoid)
---
## 🎯 What is CVD?
**CVD (Cumulative Volume Delta)** tracks the **difference between buying and selling pressure** over time.
### Simple Explanation:
- **Positive CVD** (Orange) = More buying than selling = Bulls winning
- **Negative CVD** (Gray) = More selling than buying = Bears winning
- **Rising CVD** = Increasing buying pressure = Potential uptrend
- **Falling CVD** = Increasing selling pressure = Potential downtrend
### Why It Matters:
CVD helps you see **who's really in control** of the market - not just price movement, but actual buying/selling volume.
---
## 🚀 Installation Guide
### Step 1: Open Pine Editor
1. Go to TradingView
2. Click the **"Pine Editor"** tab at the bottom of the screen
3. Click **"New"** or open an existing script
### Step 2: Copy & Paste the Code
1. Select all existing code (Ctrl+A / Cmd+A)
2. Delete it
3. Copy the entire CVD iOS Style code
4. Paste it into Pine Editor
### Step 3: Add to Chart
1. Click **"Save"** button (or Ctrl+S / Cmd+S)
2. Click **"Add to Chart"** button
3. The indicator will appear on your chart!
### Step 4: Initial Setup
- The indicator appears as an **overlay** on your price chart
- You'll see an **orange/gray line** following price
- An **info table** appears in the top-right corner
---
## 📊 Understanding the Display
### Main Chart Elements:
#### 1. **CVD Line** (Orange/Gray)
- **Orange Line** = Positive CVD (buying pressure)
- **Gray Line** = Negative CVD (selling pressure)
- This line moves with your price chart but shows volume delta
#### 2. **CVD Zone** (Shaded Area)
- Light shaded box around the CVD line
- Shows the "range" of CVD movement
- Helps visualize CVD boundaries
#### 3. **Center Line** (Dotted)
- Gray dotted line in the middle of the zone
- Represents the "neutral" point
- CVD crossing this = shift in market control
#### 4. **Reference Asset Line** (Light Gray)
- Shows Bitcoin (BTC) price movement for comparison
- Helps you see if your asset moves with or against BTC
- Can be changed to any asset you want
#### 5. **CVD Label**
- Shows current CVD value
- Positioned above/below zone to avoid overlap
- Updates in real-time
#### 6. **Reset Background** (Very Light Gray)
- Appears when CVD resets
- Indicates a new calculation period
---
## 📋 Reading the Info Table
The info table (top-right) shows **8 key metrics**:
### Row 1: **Header**
```
╔═ CVD able ═╗ | 15m | ████████ | able
```
- **CVD able** = Indicator name + creator
- **15m** = Current timeframe
- **████████** = Visual decoration
- **able** = Creator signature
### Row 2: **CVD Value**
```
CVD▲ | 7.39K | ████████ | █
█
█
```
- **CVD▲** = CVD with trend arrow
- ▲ = CVD increasing
- ▼ = CVD decreasing
- ► = CVD unchanged
- **7.39K** = Actual CVD number
- **Progress Bar** = Visual strength (darker = stronger)
- **Vertical Bars** = Height shows intensity
### Row 3: **Delta**
```
◆DELTA | -1.274K | ████░░░░ | ░
░
```
- **Delta** = Volume change THIS BAR ONLY
- **Negative** = More selling this bar
- **Positive** = More buying this bar
- Shows **immediate** pressure (not cumulative)
### Row 4: **UP Volume**
```
UP↑ | -1.263K | ████████ | █
█
█
```
- Total **buying volume** this bar
- Higher = Stronger buying pressure
- Green/Orange vertical bars = Bullish strength
### Row 5: **DOWN Volume**
```
DN↓ | 2.643K | ████████ | ░
░
░
```
- Total **selling volume** this bar
- Higher = Stronger selling pressure
- Gray vertical bars = Bearish strength
### Row 6-7: **Reference Asset** (if enabled)
```
══ REF ══ | ══════ | ████████ | █
█
PRICE▲ | 4130.300 | ████████ | █
█
```
- **REF** = Reference asset header
- **PRICE▲** = Reference price with trend
- Shows if BTC (or chosen asset) is rising/falling
- Compare with your chart to see correlation
### Row 8: **Market Status**
```
◄STATUS► | NEUT | ████░░░░ | ▒
▒
```
- **BULL** = CVD positive + Delta positive = Strong buying
- **BEAR** = CVD negative + Delta negative = Strong selling
- **NEUT** = Mixed signals = Wait for clarity
**Status Colors:**
- **Orange background** = Bullish (good for long)
- **Gray background** = Bearish (good for short)
- **White background** = Neutral (no clear signal)
---
## ⚙️ Settings & Customization
### Main Settings (⚙️)
#### **CVD Reset**
- **None** = CVD never resets (from beginning of data)
- **On Higher Timeframe** = Resets when HTF candle closes
- 15m chart → Resets hourly
- 1h chart → Resets daily
- Recommended for most traders
- **On Session Start** = Resets at market open
- **On Visible Chart** = Resets from leftmost visible bar
#### **Precision**
- **Low (Fast)** = Uses 1m data, faster but less accurate
- **Medium** = Uses 5m data, balanced (recommended)
- **High** = Uses 15m data, most accurate but slower
#### **Cumulative**
- ✅ On = CVD accumulates over time (recommended)
- ❌ Off = Shows only current bar delta
#### **Show Labels**
- ✅ On = Shows CVD value label on chart
- ❌ Off = Cleaner chart, no label
#### **Show Info Table**
- ✅ On = Shows info table (recommended for beginners)
- ❌ Off = Hide table for minimalist view
---
### 🎨 iOS Style Colors
You can customize **every color** to match your chart theme:
#### **Primary Colors**
- **Primary (Orange)** = Main bullish color (#FF9500)
- **Secondary (Gray)** = Main bearish color (#8E8E93)
- **Background** = Table background (#FFFFFF)
- **Text** = Text color (#1C1C1E)
#### **Bullish/Bearish**
- **Bullish (Orange)** = Positive CVD color
- **Bearish (Gray)** = Negative CVD color
- **Opacity** = Zone transparency (0-100%)
- **Show Zone** = Enable/disable shaded area
#### **Table Colors** (📋)
- **Header Background** = Top row background
- **Header Text** = Top row text color
- **Cell Background** = Data cells background
- **Cell Text** = Data cells text color
- **Border** = Table border color
- **Accent Background** = Special rows background
- **Alert Background** = Warning/status background
---
### 📊 Reference Asset Settings
#### **Enable**
- ✅ On = Shows reference asset line
- ❌ Off = Hide reference asset
#### **Symbol**
- Default: `BINANCE:BTCUSDT`
- Can change to any asset:
- `BINANCE:ETHUSDT` (Ethereum)
- `SPX` (S&P 500)
- `DXY` (US Dollar Index)
- Any ticker symbol
#### **Color & Width**
- Customize line appearance
- Width: 1-4 (thickness)
---
## 💡 Trading Strategies
### Strategy 1: CVD Divergence (Beginner-Friendly)
**What to Look For:**
- Price making **higher highs** but CVD making **lower highs** = Bearish divergence
- Price making **lower lows** but CVD making **higher lows** = Bullish divergence
**How to Trade:**
1. Wait for divergence to form
2. Look for confirmation (price reversal, candlestick pattern)
3. Enter trade in divergence direction
4. Stop loss beyond recent high/low
**Example:**
```
Price: /\ /\ /\ (higher highs)
CVD: /\ / \/ (lower highs) = Bearish signal
```
### Strategy 2: CVD Trend Following (Intermediate)
**What to Look For:**
- **Strongly rising CVD** + **rising price** = Strong uptrend
- **Strongly falling CVD** + **falling price** = Strong downtrend
**How to Trade:**
1. Wait for CVD and price moving in same direction
2. Enter on pullbacks to support/resistance
3. Stay in trade while CVD trend continues
4. Exit when CVD trend breaks
**Signals:**
- CVD ▲▲▲ + Price ↑ = Go LONG
- CVD ▼▼▼ + Price ↓ = Go SHORT
### Strategy 3: CVD + Reference Asset (Advanced)
**What to Look For:**
- Your asset **rising** but BTC (reference) **falling** = Relative strength
- Your asset **falling** but BTC (reference) **rising** = Relative weakness
**How to Trade:**
1. Compare CVD movement with BTC
2. If your CVD rises faster than BTC = Buy signal
3. If your CVD falls faster than BTC = Sell signal
4. Use for **pair trading** or **asset selection**
### Strategy 4: Volume Delta Confirmation
**What to Look For:**
- **Large positive Delta** = Strong buying this bar
- **Large negative Delta** = Strong selling this bar
**How to Trade:**
1. Price breaks resistance + Large positive Delta = Confirmed breakout
2. Price breaks support + Large negative Delta = Confirmed breakdown
3. Use Delta to **confirm** price moves, not predict them
**Rules:**
- Delta > 2x average = Very strong pressure
- Delta near zero at key level = Weak move, likely false breakout
---
## 🎓 Reading Real Scenarios
### Scenario 1: Strong Buying Pressure
```
Table Shows:
CVD▲ | 12.5K | ████████ | ████ (CVD rising)
◆DELTA | +2.8K | ████████ | ▲ (Positive delta)
UP↑ | 3.1K | ████████ | ████ (High buy volume)
DN↓ | 0.3K | ██░░░░░░ | ░ (Low sell volume)
◄STATUS► | BULL | ████████ | ████ (Orange background)
```
**Interpretation:** Strong buying, good for LONG trades
### Scenario 2: Distribution (Hidden Selling)
```
Table Shows:
CVD► | 8.2K | ████░░░░ | ▒▒ (CVD flat)
◆DELTA | -1.5K | ████████ | ▼ (Negative delta)
UP↑ | 0.8K | ███░░░░░ | ░ (Low buy volume)
DN↓ | 2.3K | ████████ | ████ (High sell volume)
◄STATUS► | BEAR | ████████ | ░░░░ (Gray background)
```
**Interpretation:** Price may look stable, but selling increasing = Prepare for drop
### Scenario 3: Neutral/Choppy Market
```
Table Shows:
CVD► | 5.1K | ████░░░░ | ▒ (CVD sideways)
◆DELTA | +0.2K | ██░░░░░░ | ─ (Small delta)
UP↑ | 1.2K | ████░░░░ | ▒ (Medium buy)
DN↓ | 1.0K | ████░░░░ | ▒ (Medium sell)
◄STATUS► | NEUT | ████░░░░ | ▒▒ (White background)
```
**Interpretation:** No clear direction = Stay out or reduce position size
---
## ⚠️ Common Mistakes to Avoid
### Mistake 1: Trading on CVD Alone
- ❌ **Wrong:** "CVD is rising, I'll buy immediately"
- ✅ **Right:** "CVD is rising, let me check price structure, support/resistance, and wait for confirmation"
### Mistake 2: Ignoring Delta
- ❌ **Wrong:** Looking only at cumulative CVD
- ✅ **Right:** Watch both CVD (trend) and Delta (momentum)
- Delta shows **immediate** pressure changes
### Mistake 3: Wrong Timeframe
- ❌ **Wrong:** Using 1m chart with High Precision (too slow)
- ✅ **Right:** Match precision to timeframe:
- 1m-5m → Low Precision
- 15m-1h → Medium Precision
- 4h+ → High Precision
### Mistake 4: Not Using Reset
- ❌ **Wrong:** Using "None" reset for intraday trading
- ✅ **Right:** Use "On Higher Timeframe" to see fresh CVD each session
### Mistake 5: Overtrading Neutral Status
- ❌ **Wrong:** Forcing trades when STATUS = NEUT
- ✅ **Right:** Only trade clear BULL or BEAR status
### Mistake 6: Ignoring Reference Asset
- ❌ **Wrong:** Trading altcoin without checking BTC
- ✅ **Right:** Always check if BTC CVD agrees with your asset
---
## 🔥 Pro Tips
### Tip 1: Multi-Timeframe Analysis
- Check CVD on **3 timeframes**:
- Lower TF (15m) = Entry timing
- Current TF (1h) = Trade direction
- Higher TF (4h) = Overall trend
### Tip 2: Volume Confirmation
- Big price move + Small Delta = **Weak move** (likely reversal)
- Small price move + Big Delta = **Strong accumulation** (continuation)
### Tip 3: CVD Reset Zones
- Pay attention to **reset backgrounds** (light gray)
- Often marks **session starts** = High volatility periods
### Tip 4: Divergence + Status
- Bearish divergence + STATUS = BEAR = **Strongest short signal**
- Bullish divergence + STATUS = BULL = **Strongest long signal**
### Tip 5: Color Psychology
- **Orange** (Bullish) is **warm** = Buying energy
- **Gray** (Bearish) is **cool** = Selling pressure
- Train your eye to read colors instantly
### Tip 6: Table as Quick Scan
- Glance at table without reading numbers:
- **All orange** = Bullish
- **All gray** = Bearish
- **Mixed** = Wait
---
## 📱 Quick Reference Card
| Signal | CVD | Delta | Status | Action |
|--------|-----|-------|--------|--------|
| **Strong Buy** | ▲▲ High | ++ Positive | BULL | Long Entry |
| **Strong Sell** | ▼▼ Low | -- Negative | BEAR | Short Entry |
| **Divergence Buy** | ▲ Rising | Price ▼ | → BULL | Long Setup |
| **Divergence Sell** | ▼ Falling | Price ▲ | → BEAR | Short Setup |
| **Neutral** | → Flat | ~0 Near Zero | NEUT | Stay Out |
| **Accumulation** | → Flat | ++ Positive | NEUT→BULL | Watch for Breakout |
| **Distribution** | → Flat | -- Negative | NEUT→BEAR | Watch for Breakdown |
---
## 🆘 Troubleshooting
### Issue: "Indicator not showing"
- **Solution:** Make sure overlay=true in code, re-add to chart
### Issue: "Table overlaps with price"
- **Solution:** Change table position in code or use TradingView's "Move" feature
### Issue: "CVD line too far from price"
- **Solution:** This is normal! CVD is volume-based, not price-based. Focus on CVD direction, not position
### Issue: "Too many lines on chart"
- **Solution:** Disable "Show Zone" and "Show Labels" in settings for cleaner view
### Issue: "Calculations too slow"
- **Solution:** Change Precision to "Low (Fast)" or use higher timeframe
### Issue: "Reference asset not showing"
- **Solution:** Check if "Enable" is ON and symbol is valid (e.g., BINANCE:BTCUSDT)
---
## 🎬 Getting Started Checklist
- Install indicator on TradingView
- Set precision to "Medium"
- Set reset to "On Higher Timeframe"
- Enable info table
- Add reference asset (BTC)
- Practice reading the table on demo account
- Test on different timeframes (15m, 1h, 4h)
- Compare CVD with your current strategy
- Paper trade for 1 week before going live
- Keep a trading journal of CVD signals
---
## 📚 Summary
**CVD shows WHO is winning: Buyers or Sellers**
**Key Points:**
1. **Orange/Rising CVD** = Buying pressure = Bullish
2. **Gray/Falling CVD** = Selling pressure = Bearish
3. **Delta** = Immediate momentum THIS BAR
4. **Status** = Overall market condition
5. **Always confirm** with price action & other indicators
**Remember:**
- CVD is a **tool**, not a crystal ball
- Use with proper risk management
- Practice makes perfect
- Stay disciplined!
---
**Created by: able**
**Version:** iOS Style v1.0
**Contact:** For questions, refer to TradingView community
Happy Trading! 🚀📈

NeuraEdge Delta Flow Pro V1.0INSTITUTIONAL ORDER FLOW ANALYSIS
NeuraEdge Delta Flow Pro reveals the hidden battle between buyers and sellers that traditional indicators miss. While price shows you WHAT happened, Delta Flow shows you WHO won the fight.
═══════════════════════════════════════════════
⚡ WHAT MAKES THIS UNIQUE?
Unlike basic volume indicators that just show size, Delta Flow analyzes:
- Bar-by-bar order flow direction (buying vs selling pressure)
- Cumulative Volume Delta (CVD) for institutional accumulation/distribution tracking
- Normalized strength metrics (0-100%) for conviction measurement
- Hidden divergences that predict reversals before they happen
Most order flow tools require expensive data feeds. Delta Flow uses advanced price action algorithms to estimate institutional flow on ANY timeframe, ANY market - all within TradingView.
═══════════════════════════════════════════════
📊 VISUAL COMPONENTS
DELTA HISTOGRAM
- Green bars = Buying pressure dominates
- Red bars = Selling pressure dominates
- Bright colors = Strong conviction (>70% threshold)
- Faded colors = Weak/normal pressure
CVD LINE (Blue)
- Rising = Buyers accumulating (institutions buying dips)
- Falling = Sellers distributing (institutions selling rallies)
- Divergence from price = Early reversal warning
DIVERGENCE SIGNALS
- Green Triangle = Bullish divergence (price LL, delta HL)
- Red Triangle = Bearish divergence (price HH, delta LH)
REAL-TIME DASHBOARD
- Current delta state (Strong Buy/Sell/Neutral)
- Normalized strength percentage
- CVD trend direction
- 20-bar pressure statistics
═══════════════════════════════════════════════
🎯 HOW TO USE IT:
1. SIGNAL CONFIRMATION
Your indicator says BUY → Check delta → Green = Take it ✅ | Red = Skip ⚠️
2. DETECT WEAK MOVES
Price rallies but delta is red = Distribution (sellers unloading into strength)
Price drops but delta is green = Accumulation (buyers absorbing weakness)
3. SPOT REVERSALS EARLY
Divergence triangles often precede major turning points by several bars
4. GAUGE CONVICTION
Strong delta (bright colors) = High probability the move continues
Weak delta (near zero) = Chop zone, reduce size or stay flat
═══════════════════════════════════════════════
💎 WHY CLOSED SOURCE?
Delta Flow uses a proprietary calculation method developed through extensive testing to provide the most accurate order flow estimation possible within TradingView's data limitations.
The closed-source model protects the methodology and ensures consistent results for all users, while preventing modifications that could lead to confusion or misinterpretation of signals.
═══════════════════════════════════════════════
⚙️ CUSTOMIZABLE SETTINGS
DELTA CALCULATION
- 3 estimation methods (Price Action, Candle Body, Wick Weighted)
- Smoothing options (1-10 periods)
CUMULATIVE DELTA
- CVD line toggle
- Auto-reset period (0-100 bars, or never)
- Custom line color
DISPLAY OPTIONS
- Toggle histogram on/off
- Toggle divergence signals
- Toggle dashboard
- Custom buying/selling/neutral colors
THRESHOLDS
- Strong delta percentage (50-95%, default 70%)
- Threshold line display toggle
DIVERGENCES
- Pivot lookback length (2-15 bars)
- Sensitivity control
═══════════════════════════════════════════════
📊 REAL MARKET EXAMPLE: EXHAUSTION PATTERN
The chart above shows SPY on the 1-hour timeframe with two critical exhaustion points where Delta Flow provided early reversal warnings:
Exhaustion Point 1 (Left):
- Price: Made higher high
- Delta: RED bars (selling pressure)
- CVD: Falling (net sellers)
- Signal: Green divergence triangle
- Outcome: Reversal down
Exhaustion Point 2 (Right):
- Price: Pushed to new high
- Delta: RED bars persist (weak buyers)
- CVD: Continued bearish
- Signal: Red divergence triangle
- Outcome: Sharp decline
The Pattern:
When price makes new highs but delta remains negative with falling CVD, it indicates:
1. Institutional selling into retail buying
2. Weak hands driving price (exhaustion)
3. Smart money distributing (preparing for reversal)
The divergence triangles appeared BEFORE the major moves down, giving traders advance notice to either exit longs or prepare shorts.
This is why Delta Flow is most powerful when used to FILTER signals from other indicators - it reveals when rallies/selloffs lack conviction.
═══════════════════════════════════════════════
📈 BEST PRACTICES
✅ Use with your primary trading system as confirmation
✅ Works on all timeframes (best on 15m+)
✅ Most effective on liquid markets (major pairs, indices, popular crypto)
✅ Pay attention to CVD trend for bigger picture
✅ Divergences are powerful but wait for price confirmation
❌ Not a standalone system - designed for confluence
❌ Less reliable on low-volume instruments
❌ Avoid trading when delta is near zero (indecision zone)
═══════════════════════════════════════════════
🔔 ALERT SYSTEM
6 customizable alerts:
- Strong Buying Pressure
- Strong Selling Pressure
- Bullish Divergence
- Bearish Divergence
- Delta Flip Bullish
- Delta Flip Bearish
═══════════════════════════════════════════════
🎓 INCLUDED RESOURCES
Upon invite approval, you receive:
- Complete user guide (PDF)
═══════════════════════════════════════════════
⚠️ IMPORTANT NOTES
- This is an ESTIMATION of order flow based on price action and volume
- TradingView does not provide tick-by-tick data required for true order flow
- Works as a highly effective proxy for institutional pressure
- Designed for traders who understand order flow concepts
- Best results when combined with structure-based analysis
═══════════════════════════════════════════════
💬 TO REQUEST INVITE ACCESS FOR 7 DAYS TRIAL
write email to support@neura-edge.com with your username
═══════════════════════════════════════════════
💬 Questions or feedback? Leave a comment below.
🌐 Check out our full Indicator Suite: neura-edge.com/
📧 Support: support@neura-edge.com
INSTITUTIONAL PRECISION. RETAIL EXECUTION.

Delta Hawk CVD DivergencesCustomized Cumulative Volume Delta indicator that automatically labels divergences over a set number of bars.

Institution Radar Institution Radar
Institution Radar compares Price RSI with Volume-Delta RSI to show when price moves are real (backed by volume) or fake (moving without volume).
This helps reveal two powerful concepts:
Absorption (Bullish or Bearish)
Absorption happens when a large limit order is sitting in the order book.
Market orders hit it over and over, but the level doesn't break.
This usually means:
Strong players are absorbing the aggressive orders
Price is likely to move in the opposite direction
The next candle often reacts immediately
Can lead to a full reversal or just a short 1–2 candle move
Exhaustion (Bullish or Bearish)
Exhaustion happens when institutions pull their limit orders away.
There is no real volume behind the move, so price drifts up or down easily.
This usually means:
The current move is weak
A slowdown, pullback, or reversal is likely
Often shows up right before a flip in direction
📌 What the Signals Mean
Green signal → next candles often push upward
Red signal → next candles often push downward
These can mark trend reversals or temporary 1–2 candle reactions
🎚️ Sensitivity Setting
You can adjust how strict the signals are:
Lower sensitivity = more signals, more noise
Higher sensitivity = fewer signals, but more accurate and stronger
A higher sensitivity is recommended if you only want the cleanest institutional moments.

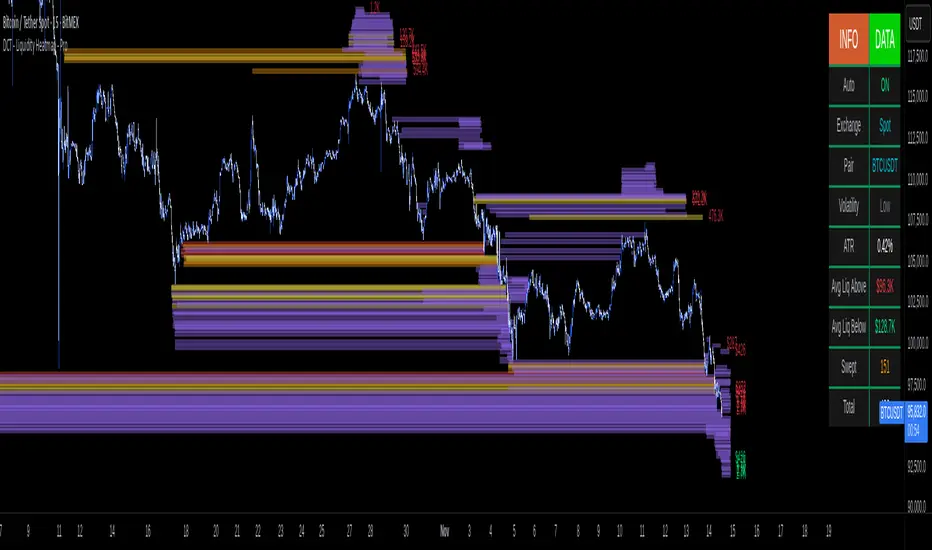
DCT - Liquidity Heatmap - ProOVERVIEW
This indicator visualizes liquidity levels by analyzing volume intensity, order flow structure, and price interaction. It highlights areas where buy-side and sell-side liquidity builds up, showing potential zones of interest.
WHAT IT DOES
- Detects buy-side and sell-side liquidity levels
- Tracks swept zones
- Displays volume intensity using a color-graded system
- Optional CVD mode showing directional volume bias
- Adapts automatically to different market types and volatility states
- Extends active levels forward
- Cleans up old data automatically
- Includes optional alert conditions
KEY FEATURES
- Automatic market and volatility identification
- Smart spacing and level management
- Optional CVD tracking
- Forward level projection
- Swept level preservation
- Imbalance markers
- Real-time info table with liquidity stats, volatility state, and level counts
- Memory-optimized handling for long charts
IMPORTANT NOTES
- Not a predictive tool
- Not a standalone trading system
- Effectiveness varies by timeframe and data quality
- Optimized for crypto markets
- Historical visualization shows past detected levels
HOW TO USE
- Add indicator to your chart
- Adjust spacing to widen or tighten clusters
- Enable CVD if directional pressure is needed
- Configure alerts if desired
- Use Compact mode on smaller screens
TECHNICAL DETAILS
- Pine v6
- Overlay: true
- Max boxes: 500
- Memory optimized
- Works on Perpetual and Spot crypto markets
DISCLAIMER
For analysis and educational use only. No financial advice. Markets can behave unpredictably. Use your own judgment and risk management.
Cumulative Volume Profile DeltaThis indicator calculates the Cumulative Volume Profile Delta (CVPD). It constructs a high-resolution volume profile for each bar using intra-bar data, then derives and accumulates the delta from that profile to show net buying/selling pressure.
Key Features:
Statistical Volume Profile Engine: For each bar, the indicator builds a high-resolution volume profile on a lower 'Intra-Bar Timeframe'. Instead of simple tick counting, it uses statistical models ('PDF' allocation) to distribute volume across price levels and advanced classifiers ('Dynamic' split) to determine the buy/sell pressure before accumulation.
Periodic Accumulation: The CVPD accumulation is anchored to a user-defined 'Anchor Timeframe' (e.g., daily, weekly). This cyclical reset allows to analyze the build-up of pressure within specific trading periods.
"Delta Candle" Visualization: The periodic CVPD is shown as a candle, where:
Open: The CVPD value at the start of the period (or zero).
High/Low: Represent the peak buying (CVD High) and selling (CVD Low) pressure within that period's profile.
Close: The final net delta value (CVD) for the period.
Dual CVD & Divergence Engine: The indicator calculates two CVPDs: a Periodic one (for plotting) and a Continuous one (non-resetting). The continuous line is used as a stable source for the built-in divergence engine (detecting Regular, Hidden, and Exaggerated).
Dynamic Divergence Plotting: Divergence markers are plotted relative to the periodic (candle) CVPD. They automatically adjust their vertical position after a reset to remain visually aligned with the plotted candles.
Note on Confirmation (Lag): Divergence signals rely on a pivot confirmation method to ensure they do not repaint.
The Start of a- divergence is only detected after the confirming pivot is fully formed (a delay based on Pivot Right Bars).
The End of a divergence is detected either instantly (if the signal is invalidated by price action) or with a delay (when a new, non-divergent pivot is confirmed).
Multi-Timeframe (MTF) Capability:
MTF Output: The entire analysis (Delta Candles, Divergences) can be calculated on a higher timeframe (using the Timeframe input), with standard options to handle gaps (Fill Gaps) and prevent repainting (Wait for...).
Limitation: The Divergence detection engine (pivDiv) is disabled if a Higher Timeframe (HTF) is selected.
Integrated Alerts: Includes 18 comprehensive alerts for:
The start and end of all 6 divergence types.
The periodic CVPD crossing the zero line.
Conditions of agreement or disagreement between the delta and the main bar's direction.
Caution: Real-Time Data Behavior (Intra-Bar Repainting) This indicator uses high-resolution intra-bar data. As a result, the values on the current, unclosed bar (the real-time bar) will update dynamically as new intra-bar data arrives. This behavior is normal and necessary for this type of analysis. Signals should only be considered final after the main chart bar has closed.
DISCLAIMER
For Informational/Educational Use Only: This indicator is provided for informational and educational purposes only. It does not constitute financial, investment, or trading advice, nor is it a recommendation to buy or sell any asset.
Use at Your Own Risk: All trading decisions you make based on the information or signals generated by this indicator are made solely at your own risk.
No Guarantee of Performance: Past performance is not an indicator of future results. The author makes no guarantee regarding the accuracy of the signals or future profitability.
No Liability: The author shall not be held liable for any financial losses or damages incurred directly or indirectly from the use of this indicator.
Signals Are Not Recommendations: The alerts and visual signals (e.Example: crossovers) generated by this tool are not direct recommendations to buy or sell. They are technical observations for your own analysis and consideration.

Cumulative Volume DeltaThis Cumulative Volume Delta (CVD) indicator analyzes intra-bar volume dynamics. It introduces a periodic reset mechanism, anchoring the accumulation to a user-defined timeframe (e.g., daily, weekly) for cyclical analysis.
Key Features:
Dual CVD Calculation: The indicator computes two CVD values simultaneously:
Periodic CVD: Resets on the user-defined 'Anchor Timeframe'. This is plotted as "Delta Candles".
Continuous CVD: Accumulates volume continuously (non-resetting) and is used as the source for divergence detection.
Intra-Bar Delta Analysis: Uses a lower timeframe ('Intra-Bar Timeframe') to calculate buy/sell pressure based on the direction of the intra-bar candles.
"Delta Candle" Visualization: The periodic CVD is shown as a candle, where:
Open: The CVD value at the start of the period (or zero).
High/Low: Represent the peak buying (CVD High) and selling (CVD Low) pressure within that period.
Close: The final net delta value for that period.
Full Divergence Suite (Class A, B, C): A built-in engine automatically detects and plots Regular (A), Hidden (B), and Exaggerated (C) divergences between price and the continuous CVD line.
Dynamic Divergence Plotting: Divergence markers are plotted relative to the periodic (candle) CVD. They automatically adjust their vertical position after a reset to remain visually aligned with the plotted candles.
Note on Confirmation (Lag): Divergence signals rely on a pivot confirmation method to ensure they do not repaint.
The Start of a- divergence is only detected after the confirming pivot is fully formed (a delay based on Pivot Right Bars).
The End of a divergence is detected either instantly (if the signal is invalidated by price action) or with a delay (when a new, non-divergent pivot is confirmed).
Multi-Timeframe (MTF) Capability:
MTF Output: The entire dual-CVD analysis can be run on a higher timeframe (using the Timeframe input), with standard options to handle gaps (Fill Gaps) and prevent repainting (Wait for...).
Limitation: The Divergence detection engine (pivDiv) is disabled if a Higher Timeframe (HTF) is selected.
Integrated Alerts: Includes 18 comprehensive alerts for:
The start and end of all 6 divergence types.
The periodic CVD crossing the zero line.
Conditions of agreement or disagreement between the delta and the main bar's direction.
Caution: Real-Time Data Behavior (Intra-Bar Repainting) This indicator uses high-resolution intra-bar data. As a result, the values on the current, unclosed bar (the real-time bar) will update dynamically as new intra-bar data arrives. This behavior is normal and necessary for this type of analysis. Signals should only be considered final after the main chart bar has closed.
DISCLAIMER
For Informational/Educational Use Only: This indicator is provided for informational and educational purposes only. It does not constitute financial, investment, or trading advice, nor is it a recommendation to buy or sell any asset.
Use at Your Own Risk: All trading decisions you make based on the information or signals generated by this indicator are made solely at your own risk.
No Guarantee of Performance: Past performance is not an indicator of future results. The author makes no guarantee regarding the accuracy of the signals or future profitability.
No Liability: The author shall not be held liable for any financial losses or damages incurred directly or indirectly from the use of this indicator.
Signals Are Not Recommendations: The alerts and visual signals (e.g., crossovers) generated by this tool are not direct recommendations to buy or sell. They are technical observations for your own analysis and consideration.

LibVolmLibrary "LibVolm"
This library provides a collection of core functions for volume and
money flow analysis. It offers implementations of several classic
volume-based indicators, with a focus on flexibility
for applications like multi-timeframe and session-based analysis.
Key Features:
1. **Suite of Classic Volume Indicators:** Includes standard
implementations of several foundational indicators:
- **On Balance Volume (`obv`):** A momentum indicator that
accumulates volume based on price direction.
- **Accumulation/Distribution Line (`adLine`):** Measures cumulative
money flow using the close's position within the bar's range.
- **Chaikin Money Flow (`cmf`):** An oscillator version of the ADL
that measures money flow over a specified lookback period.
2. **Anchored/Resettable Indicators:** The library includes flexible,
resettable indicators ideal for cyclical analysis:
- **Anchored VWAP (`vwap`):** Calculates a Volume Weighted Average
Price that can be reset on any user-defined `reset` condition.
It returns both the VWAP and the number of bars (`prdBars`) in
the current period.
- **Resettable CVD (`cvd`):** Computes a Cumulative Volume Delta
that can be reset on a custom `reset` anchor. The function
also tracks and returns the highest (`hi`) and lowest (`lo`)
delta values reached within the current period.
(Note: The delta sign is determined by a specific logic:
it first checks close vs. open, then close vs. prior
close, and persists the last non-zero sign).
3. **Volume Sanitization:** All functions that use the built-in
`volume` variable automatically sanitize it via an internal
function. This process replaces `na` values with 0 and ensures
no negative volume values are used, providing stable calculations.
---
**DISCLAIMER**
This library is provided "AS IS" and for informational and
educational purposes only. It does not constitute financial,
investment, or trading advice.
The author assumes no liability for any errors, inaccuracies,
or omissions in the code. Using this library to build
trading indicators or strategies is entirely at your own risk.
As a developer using this library, you are solely responsible
for the rigorous testing, validation, and performance of any
scripts you create based on these functions. The author shall
not be held liable for any financial losses incurred directly
or indirectly from the use of this library or any scripts
derived from it.
obv(price)
Calculates the On Balance Volume (OBV) cumulative indicator.
Parameters:
price (float) : series float Source price series, typically the close.
Returns: series float Cumulative OBV value.
adLine()
Computes the Accumulation/Distribution Line (AD Line).
Returns: series float Cumulative AD Line value.
cmf(length)
Computes Chaikin Money Flow (CMF).
Parameters:
length (int) : series int Lookback length for the CMF calculation.
Returns: series float CMF value.
vwap(price, reset)
Calculates an anchored Volume Weighted Average Price (VWAP).
Parameters:
price (float) : series float Source price series (usually *close*).
reset (bool) : series bool A signal that is *true* on the bar where the
accumulation should be reset.
Returns:
vwap series float The calculated Volume Weighted Average Price for the current period.
prdBars series int The number of bars that have passed since the last reset.
cvd(reset)
Calculates a resettable, cumulative Volume Delta (CVD).
It accumulates volume delta and tracks its high/low range. The
accumulation is reset to zero whenever the `reset` condition is true.
This is useful for session-based analysis, intra-bar calculations,
or any other custom-anchored accumulation.
Parameters:
reset (bool) : series bool A signal that is *true* on the bar where the
accumulation should be reset.
Returns:
cum series float The current cumulative volume delta.
hi series float The highest peak the cumulative delta has reached in the current period.
lo series float The lowest trough the cumulative delta has reached in the current period.

CVD with DivergenceThis indicator combines Cumulative Volume Delta with divergence signals to help spot potential market reversals and trend changes. It visually highlights key shifts in buying and selling pressure, making it easier to see when momentum is building or fading and helping you make more informed trading decisions.

Cumulative Volume Delta Divergence Periodic EMACumulative Volume Delta Divergence Periodic EMA
extended indicator
Divergences + Alerts (ANY Indicator)📊 Divergences + Alerts (ANY Indicator)
This versatile indicator detects four types of divergences between price action and an oscillator:
Buyer Exhaustion
Buyer Absorption
Seller Exhaustion
Seller Absorption
Each divergence type is automatically identified and visually marked on the chart with colored lines. The indicator also includes built-in alert conditions for all four divergence types, allowing traders to receive real-time notifications when potential reversal signals occur.
By default, the oscillator is a candle-style visualization of the Money Flow Index (MFI), enhanced with volatility filtering via a VWMA-based ATR. However, users can replace the default MFI oscillator with any external source using the “Plug External Source” input, enabling full customization and compatibility with other indicators.
Key features:
🔍 Detects both exhaustion and absorption divergences
🔔 Alerts for each divergence type
🕯️ Candle-style oscillator visualization
🔌 Optional input for external indicator sources
⚙️ ATR-based filtering for precision
Ideal for traders seeking to spot early signs of trend reversals or momentum shifts with customizable flexibility.

Order Flow RSI - Price / CVD / OIOrder Flow RSI blends three powerful market perspectives — Price , Cumulative Volume Delta (CVD) , and Open Interest (OI) — into one unified RSI-style oscillator.
It reveals momentum and imbalance across these data streams and highlights situations where participation, liquidity, and positioning disagree — moments that often precede reversals.
What it does
The indicator converts:
Price → RSI (classic momentum),
CVD → RSI (buy/sell pressure balance),
OI → RSI (position expansion/contraction)
…then plots all three RSIs together on the same 0–100 scale.
A fourth Consensus RSI (average of any two or all three) can optionally be shown to simplify the view.
Core logic
CVD engine – based on TradingView’s native volume-delta request.
Modes: Continuous (default, smooth line), Anchored (resets each session), Rolling window.
Open Interest – pulled automatically from the symbol’s “_OI” feed; aligns to chart timeframe for real-time flow.
RSI calculation – standard RSI applied to each data stream, optionally smoothed (SMA / EMA / RMA / WMA / VWMA).
Signals – optional background highlights when:
All three RSIs are overbought (red) or oversold (green), or
Any pair show opposite extremes (e.g., price overbought + OI oversold).
Consensus RSI – arithmetic mean of the selected RSIs, summarizing overall market tone.
Inputs overview
CVD settings: anchor period, lower-TF delta, mode, rolling length
RSI lengths: separate for price, CVD, OI
Smoothing: type + period applied to all RSIs at once
Consensus: choose which RSIs to average
Signals: enable/disable each combination; optional alerts
Levels: adjustable OB/MID/OS (default 70 / 50 / 30)
Visuals: fill between active RSIs, background highlights, level lines, colors in Style tab
How to read it
All 3 overbought (red): broad exhaustion → possible correction
All 3 oversold (green): broad depletion → possible bounce
Opposite pairs: divergence between price and participation
Price↑ but OI↓ (red) → weak rally, fading participation
Price↓ but CVD↑ (green) → hidden accumulation
Combine with structure and volume profile for confirmation.
Notes
Works best on assets with full CVD + OI data (futures, BTC, etc.).
Use Continuous CVD for smooth RSI, Anchored for session analysis.
Smoothing 2–5 EMA is a good starting point to reduce noise.
All styling (colors, line types, thickness) is adjustable in the Style tab.
Limitations & caveats
CVD requires accurate tick/volume/delta data from your data feed. Performance may differ across instruments.
OI availability varies by exchange / symbol. Where OI is absent, pairwise OI signals are not evaluated.
This indicator is a tool — it generates signals of interest, not guaranteed profitable trades. Backtest and combine with your risk rules.
Smoothing introduces lag; longer smoothing reduces noise but delays signals.
Order Flow RSI bridges traditional momentum analysis and order-flow context — giving a multi-dimensional view of when markets are truly stretched or quietly reloading.
Sometimes it works, sometimes it doesn't.

Cumulative Volume Delta Z Score [BackQuant]Cumulative Volume Delta Z Score
The Cumulative Volume Delta Z Score indicator is a sophisticated tool that combines the cumulative volume delta (CVD) with Z-Score normalization to provide traders with a clearer view of market dynamics. By analyzing volume imbalances and standardizing them through a Z-Score, this tool helps identify significant price movements and market trends while filtering out noise.
Core Concept of Cumulative Volume Delta (CVD)
Cumulative Volume Delta (CVD) is a popular indicator that tracks the net difference between buying and selling volume over time. CVD helps traders understand whether buying or selling pressure is dominating the market. Positive CVD signals buying pressure, while negative CVD indicates selling pressure.
The addition of Z-Score normalization to CVD makes it easier to evaluate whether current volume imbalances are unusual compared to past behavior. Z-Score helps in detecting extreme conditions by showing how far the current CVD is from its historical mean in terms of standard deviations.
Key Features
Cumulative Volume Delta (CVD): Tracks the net buying vs. selling volume, allowing traders to gauge the overall market sentiment.
Z-Score Normalization: Converts CVD into a standardized value to highlight extreme movements in volume that are statistically significant.
Divergence Detection: The indicator can spot bullish and bearish divergences between price and CVD, which can signal potential trend reversals.
Pivot-Based Divergence: Identifies price and CVD pivots, highlighting divergence patterns that are crucial for predicting price changes.
Trend Analysis: Colors bars according to trend direction, providing a visual indication of bullish or bearish conditions based on Z-Score.
How It Works
Cumulative Volume Delta (CVD): The CVD is calculated by summing the difference between buying and selling volume for each bar. It represents the net buying or selling pressure, giving insights into market sentiment.
Z-Score Normalization: The Z-Score is applied to the CVD to normalize its values, making it easier to compare current conditions with historical averages. A Z-Score greater than 0 indicates a bullish market, while a Z-Score less than 0 signals a bearish market.
Divergence Detection: The indicator detects regular and hidden bullish and bearish divergences between price and CVD. These divergences often precede trend reversals, offering traders a potential entry point.
Pivot-Based Analysis: The indicator uses pivot highs and lows in both price and CVD to identify divergence patterns. A bullish divergence occurs when price makes a lower low, but CVD fails to follow, suggesting weakening selling pressure. Conversely, a bearish divergence happens when price makes a higher high, but CVD doesn't confirm the move, indicating potential selling pressure.
Trend Coloring: The bars are colored based on the trend direction. Green bars indicate an uptrend (CVD is positive), and red bars indicate a downtrend (CVD is negative). This provides an easy-to-read visualization of market conditions.
Standard Deviation Levels: The indicator plots ±1σ, ±2σ, and ±3σ levels to indicate the degree of deviation from the average CVD. These levels act as thresholds for identifying extreme buying or selling pressure.
Customization Options
Anchor Timeframe: The user can define an anchor timeframe to aggregate the CVD, which can be customized based on the trader’s needs (e.g., daily, weekly, custom lower timeframes).
Z-Score Period: The period for calculating the Z-Score can be adjusted, allowing traders to fine-tune the indicator's sensitivity.
Divergence Detection: The tool offers controls to enable or disable divergence detection, with the ability to adjust the lookback periods for pivot detection.
Trend Coloring and Visuals: Traders can choose whether to color bars based on trend direction, display standard deviation levels, or visualize the data as a histogram or line plot.
Display Options: The indicator also allows for various display options, including showing the Z-Score values and divergence signals, with customizable colors and line widths.
Alerts and Signals
The Cumulative Volume Delta Z Score comes with pre-configured alert conditions for:
Z-Score Crossovers: Alerts are triggered when the Z-Score crosses the 0 line, indicating a potential trend reversal.
Shifting Trend: Alerts for when the Z-Score shifts direction, signaling a change in market sentiment.
Divergence Detection: Alerts for both regular and hidden bullish and bearish divergences, offering potential reversal signals.
Extreme Imbalances: Alerts when the Z-Score reaches extreme positive or negative levels, indicating overbought or oversold market conditions.
Applications in Trading
Trend Identification: Use the Z-Score to confirm bullish or bearish trends based on cumulative volume data, filtering out noise and false signals.
Reversal Signals: Divergences between price and CVD can help identify potential trend reversals, making it a powerful tool for swing traders.
Volume-Based Confirmation: The Z-Score allows traders to confirm price movements with volume data, providing more reliable signals compared to price action alone.
Divergence Strategy: Use the divergence signals to identify potential points of entry, particularly when regular or hidden divergences appear.
Volatility and Market Sentiment: The Z-Score provides insights into market volatility by measuring the deviation of CVD from its historical mean, helping to predict price movement strength.
The Cumulative Volume Delta Z Score is a powerful tool that combines volume analysis with statistical normalization. By focusing on volume imbalances and applying Z-Score normalization, this indicator provides clear, reliable signals for trend identification and potential reversals. It is especially useful for filtering out market noise and ensuring that trades are based on significant price movements driven by substantial volume changes.
This indicator is perfect for traders looking to add volume-based analysis to their strategy, offering a more robust and accurate way to gauge market sentiment and trend strength.

Cumulative Volume Delta Profile and Heatmap [BackQuant]Cumulative Volume Delta Profile and Heatmap
A multi-view CVD workstation that measures buying vs selling pressure, renders a price-aligned CVD profile with Point of Control, paints an optional heatmap of delta intensity, and detects classical CVD divergences using pivot logic. Built for reading who is in control, where participation clustered, and when effort is failing to produce result.
What is CVD
Cumulative Volume Delta accumulates the difference between aggressive buys and aggressive sells over time. When CVD rises, buyers are lifting the offer more than sellers are hitting the bid. When CVD falls, the opposite is true. Plotting CVD alongside price helps you judge whether price moves are supported by real participation or are running on fumes.
Core Features
Visual Analysis Components
CVD Columns - Plot of cumulative delta, colored by side, for quick read of participation bias.
CVD Profile - Price-aligned histogram of CVD accumulation using user-set bins. Shows where net initiative clustered.
Split Buy and Sell CVD - Optional two-sided profile that separates positive and negative CVD into distinct wings.
POC - Point of Control - The price level with the highest absolute CVD accumulation, labeled and line-marked.
Heatmap - Semi-transparent blocks behind price that encode CVD intensity across the last N bars.
Divergence Engine - Pivot-based detection of Bearish and Bullish CVD divergences with optional lines and labels.
Stats Panel - Top level metrics: Total CVD, Buy and Sell totals with percentages, Delta Ratio, and current POC price.
How it works
Delta source and sampling
You select an Anchor Timeframe that defines the higher time aggregation for reading the trend of CVD.
The script pulls lower timeframe volume delta and aggregates it to the anchor window. You can let it auto-select the lower timeframe or force a custom one.
CVD is then accumulated bar by bar to form a running total. This plot shows the direction and persistence of initiative.
Profile construction
The recent price range is split into Profile Granularity bins.
As price traverses a bin, the current delta contribution is added to that bin.
If Split Buy and Sell CVD is enabled, positive CVD goes to the right wing and negative CVD to the left wing.
Widths are scaled by each side’s maximum so you can compare distribution shape at a glance.
The Point of Control is the bin with the highest absolute CVD. This marks where initiative concentrated the most.
Heatmap
For each bin, the script computes intensity as absolute CVD relative to the maximum bin value.
Color is derived from the side in control in that bin and shaded by intensity.
Heatmap Length sets how far back the panels extend, highlighting recurring participation zones.
Divergence model
You define pivot sensitivity with Pivot Left and Right .
Bearish divergence triggers when price confirms a higher high while CVD fails to make a higher high within a configurable Delta Tolerance .
Bullish divergence triggers when price confirms a lower low while CVD fails to make a lower low.
On trigger, optional link lines and labels are drawn at the pivots for immediate context.
Key Settings
Delta Source
Anchor Timeframe - Higher TF for the CVD narrative.
Custom Lower TF and Lower Timeframe - Force the sampling TF if desired.
Pivot Logic
Pivot Left and Right - Bars to each side for swing confirmation.
Delta Tolerance - Small allowance to avoid near-miss false positives.
CVD Profile
Show CVD Profile - Toggle profile rendering.
Split Buy and Sell CVD - Two-sided profile for clearer side attribution.
Show Heatmap - Project intensity panels behind price.
Show POC and POC Color - Mark the dominant CVD node.
Profile Granularity - Number of bins across the visible price range.
Profile Offset and Profile Width - Position and scale the profile.
Profile Position - Right, Left, or Current bar alignment.
Visuals
Bullish Div Color and Bearish Div Color - Colors for divergence artifacts.
Show Divergence Lines and Labels - Visualize pivots and annotations.
Plot CVD - Column plot of total CVD.
Show Statistics and Position - Toggle and place the summary table.
Reading the display
CVD columns
Rising CVD confirms buyers are in control. Falling CVD confirms sellers.
Flat or choppy CVD during wide price moves hints at passive or exhausted participation.
CVD profile wings
Thick right wing near a price zone implies heavy buy initiative accumulated there.
Thick left wing implies heavy sell initiative.
POC marks the strongest initiative node. Expect reactions on first touch and rotations around this level when the tape is balanced.
Heatmap
Brighter blocks indicate stronger historical net initiative at that price.
Stacked bright bands form CVD high volume nodes. These often behave like magnets or shelves for future trade.
Divergences
Bearish - Price prints a higher high while CVD fails to do so. Effort is not producing result. Potential fade or pause.
Bullish - Price prints a lower low while CVD fails to do so. Capitulation lacks initiative. Potential bounce or reversal.
Stats panel
Total CVD - Net initiative over the window.
Buy and Sell volume with percentages - Side composition.
Delta Ratio - Buy over Sell. Values above 1 favor buyers, below 1 favor sellers.
POC Price - Current control node for plan and risk.
Workflows
Trend following
Choose an Anchor Timeframe that matches your holding period.
Trade in the direction of CVD slope while price holds above a bullish POC or below a bearish POC.
Use pullbacks to CVD nodes on your profile as entry locations.
Trend weakens when price makes new highs but CVD stalls, or new lows while CVD recovers.
Mean reversion
Look for divergences at or near prior CVD nodes, especially the POC.
Fade tests into thick wings when the side that dominated there now fails to push CVD further.
Target rotations back toward the POC or the opposite wing edge.
Liquidity and execution map
Treat strong wings and heatmap bands as probable passive interest zones.
Expect pauses, partial fills, or flips at these shelves.
Stops make sense beyond the far edge of the active wing supporting your idea.
Alerts included
CVD Bearish Divergence and CVD Bullish Divergence.
Price Cross Above POC and Price Cross Below POC.
Extreme Buy Imbalance and Extreme Sell Imbalance from Delta Ratio.
CVD Turn Bullish and CVD Turn Bearish when net CVD crosses zero.
Price Near POC proximity alert.
Best practices
Use a higher Anchor Timeframe to stabilize the CVD story and a sensible Profile Granularity so wings are readable without clutter.
Keep Split mode on when you want to separate initiative attribution. Turn it off when you prefer a single net profile.
Tune Pivot Left and Right by instrument to avoid overfitting. Larger values find swing divergences. Smaller values find micro fades.
If volume is thin or synthetic for the symbol, CVD will be less reliable. The script will warn if volume is zero.
Trading applications
Context - Confirm or question breakouts with CVD slope.
Location - Build entries at CVD nodes and POC.
Timing - Use divergence and POC crosses for triggers.
Risk - Place stops beyond the opposite wing or outside the POC shelf.
Important notes and limits
This is a price and volume based study. It does not access off-book or venue-level order flow.
CVD profiles are built from the data available on your chart and the chosen lower timeframe sampling.
Like all volume tools, readings can distort during roll periods, holidays, or feed anomalies. Validate on your instrument.
Technical notes
Delta is aggregated from a lower timeframe into an Anchor Timeframe narrative.
Profile bins update in real time. Splitting by side scales each wing independently so both are readable in the same panel.
Divergences are confirmed using standard pivot definitions with user-set tolerances.
All profile drawing uses fixed X offsets so panels and POC do not swim when you scroll.
Quick start
Anchor Timeframe = Daily for intraday context.
Split Buy and Sell CVD = On.
Profile Granularity = 100 to 200, Profile Position = Right, Width to taste.
Pivot Left and Right around 8 to 12 to start, then adapt.
Turn on Heatmap for a fast map of interest bands.
Bottom line
CVD tells you who is doing the lifting. The profile shows where they did it. Divergences tell you when effort stops paying. Put them together and you get a clear read on control, location, and timing for both trend and mean reversion.

KSM CVDThis Indicator displays Divergences between Price chart candles and delta strength candles. Visually changes the candle colour to show the Exhaustion & Absorption that occurs.

CVD Polarity Indicator (With Rolling Smoothed)📊 CVD Polarity Indicator (with Rolling Smoothing)
Purpose
The CVD Polarity Indicator combines Cumulative Volume Delta (CVD) with price bar direction to measure whether buying or selling pressure is in agreement with price action. It then smooths that signal over time, making it easier to see underlying volume-driven market trends.
This indicator is essentially a volume–price agreement oscillator:
- It compares price direction with volume delta (CVD).
- Translates that into per-bar polarity.
- Smooths it into a rolling sum for clarity.
- Adds a short EMA to highlight turning points.
The end result: a tool that helps you see when price action is backed by real volume flows versus when it’s running on weak participation.
__________________________________________________________________________________
1. Cumulative Volume Delta (CVD)
What it is:
CVD is the cumulative sum of buying vs. selling pressure measured by volume.
- If a bar closes higher than it opens → that bar’s volume is treated as buying pressure (+volume).
- If a bar closes lower than it opens → that bar’s volume is treated as selling pressure (–volume).
Rolling version:
Instead of accumulating indefinitely (which just creates a line that trends forever), this indicator uses a rolling sum over a user-defined number of bars (cumulation_length, default 14).
- This shows the net delta in recent bars, making the CVD more responsive and localized.
2. Bar Direction vs. CVD Change
Each bar has two pieces of directional information:
1. Bar direction: Whether the candle closed above or below its open (close - open).
2. CVD change: Whether cumulative delta increased or decreased from the prior bar (cvd - cvd ).
By comparing these two:
- Agreement (both up or both down):
→ Polarity = +volume (if bullish) or –volume (if bearish).
- Disagreement (bar up but CVD down, or bar down but CVD up):
→ Polarity flips sign, signaling divergence between price and volume.
Thus, raw polarity = a per-bar measure of whether price action and volume delta are in sync.
3. Polarity Smoothing (Rolling Polarity)
- Problem with raw polarity:
It flips bar-to-bar and looks very jagged — not great for seeing trends.
- Solution:
The indicator applies a rolling sum over the past polarity_length bars (default 14).
- This creates a smoother curve, representing the net polarity over time.
- Positive values = net bullish alignment (buyers stronger).
- Negative values = net bearish alignment (sellers stronger).
Think of it like an oscillator showing whether buyers or sellers have had control recently.
4. EMA Smoothing
Finally, a 10-period EMA is applied on top of the rolling polarity line:
- This further reduces noise.
- It helps highlight shifts in the underlying polarity trend.
- Crossovers of the polarity line and its EMA can serve as trade signals (bullish/bearish inflection points).
________________________________________________________________________________
How to Read It
1. Polarity above zero → Recent bars show more bullish agreement between price and volume.
2. Polarity below zero → Recent bars show more bearish agreement.
3. Polarity diverging from price → If price goes up but polarity trends down, it signals weakening buying pressure (potential reversal).
4. EMA crossovers →
- Polarity crossing above its EMA = bullish momentum shift.
- Polarity crossing below its EMA = bearish momentum shift.
Practical Use Cases
- Trend Confirmation
Use polarity to confirm whether a price move is supported by volume. If price rallies but
polarity stays negative, the move is weak.
- Divergence Signals
Watch for divergences between price trend and polarity trend (e.g., higher highs in price but
lower highs in polarity).
- Momentum Shifts
Use EMA crossovers as signals that the underlying balance of buying/selling has flipped.

CVD Absorption + Confirmation [Orderflow & Volume]This indicator detects bullish and bearish absorption setups by combining Cumulative Volume Delta (CVD) with price action, candlestick, and volume confirmations.
🔹 What is Absorption?
Absorption happens when aggressive buyers/sellers push CVD to new highs or lows, but price fails to follow through.
Bearish absorption: CVD makes a higher high, but price does not.
Bullish absorption: CVD makes a lower low, but price does not.
This often signals that limit orders are absorbing aggressive market orders, creating potential reversal points.
🔹 Confirmation Patterns
Absorption signals are only shown if they are validated by one of the following patterns:
Engulfing candle with low volume → reversal faces little resistance.
Engulfing candle with high volume → strong aggressive participation.
Pin bar with high volume → absorption visible in the wick.
CVD flattening / slope reversal → shift in aggressive order flow.
🔹 Signals
✅ Bullish absorption confirmed → Green label below the bar.
❌ Bearish absorption confirmed → Red label above the bar.
Each label represents a potential reversal setup after orderflow absorption is validated.
🔹 Alerts
Built-in alerts are included for both bullish and bearish confirmations, so you can track setups in real-time without watching the chart 24/7.
📌 How to Use:
Best applied at key levels (supply/demand, VWAP, OR, liquidity zones).
Look for confluence with your trading strategy before taking entries.
Works on all markets and timeframes where volume is reliable.

Intelligent Trading SuiteIntelligent Trading Suite
“One script to rule them all.”
Overview
The Intelligent Trading Suite is a professional-grade decision system built in Pine Script. It is a unified engine—not a bundle of indicators—that combines adaptive pattern recognition, historical memory, and multi-context intelligence into one framework. Using a deep historical pattern database and integrating session dynamics, market calendars, holiday effects, and economic events, it filters noise and adapts to conditions. Core emphasis: precise pattern detection with target-price projection that remains stable as new candles print (mitigates target drift) and early detection of forming geometric patterns and divergences/hidden divergences.
Core Features
All-Timeframe Operation: Works across every TradingView timeframe—from 1m to 1W—without performance drift.
Pattern Recognition with Targets: Detects triangles, wedges, cup & handle, flags, and H&S; projects targets and stabilizes them against common drift as price evolves.
Early Signal Engine: Flags forming patterns and divergences before completion and notifies when prerequisites align.
Historical Pattern Intelligence: Stores and compares thousands of prior states (Hull, VWAP, RSI, MACD, SMA, CVD) to weight current conditions and calibrate confidence.
Context & Regime Awareness: Adjusts for volatility regimes, liquidity sessions, day-of-week bias, holidays, and macro events.
Unified Signal & Confidence: Fuses all streams into a single Overall signal with calibrated confidence levels (Weak / Neutral / Strong).
Visualization & Alerts
Compact Ultimate Intelligence Table showing each analytical pillar, plus the Overall signal, and an option to show them on the chart as well.
Alerts on table for: new pattern detection, divergence events, volatility shifts, and trend reversals.
Important Notes
-Free plan runtime: TradingView Free accounts may hit platform limits.
Fix: Open settings → switch Mode from Paid to Free → runs within Free limits.
-Heavy computation: The script is calculation- and data-intensive; initial runs can take time.
If a rare runtime error occurs, simply reload the page and continue.
Attributions
Hull Moving Average (Alan Hull)
VWAP (Volume Weighted Average Price)
RSI (Relative Strength Index, J. Welles Wilder Jr.)
MACD (Moving Average Convergence Divergence, Gerald Appel)
Black Flag ATR bands (Jose Azcarate)
Proprietary enhancements, target-stabilization logic, and the nuclear intelligence architecture are original research for this suite.
Compliance
Educational and analytical use only
No financial advice
Ad-free; aligned with TradingView House Rules
Proper attribution included
Access
To get access, please read the Author’s instructions on the script’s page.

Cvd Divergence Signals with filter.
CVD Divergence + Candles - False Signal Filter
Hey traders,
I want to share my custom indicator with you. Through testing, I've found that CVD (Composite Volume Delta) captures divergences much more accurately than traditional tools like RSI. But this isn't just another divergence indicator - I've added strict candlestick pattern confirmation to filter out false signals. I'll keep improving this tool over time, and I welcome all your suggestions in the comments.
How it works step-by-step:
1. First, it detects CVD divergences (the delta between buy/sell volumes)
2. Then confirms each signal with reversal candlestick patterns:
- Hammer/Hanging Man
- Engulfing
- Pin Bar
- Inside Bar
Why mine beats standard CVD indicators:
• No raw divergences - only shows signals confirmed by BOTH volume AND price action
• Eliminates 80% of junk signals from basic versions
• Adaptable to any asset and timeframe
Simple usage guide:
Green arrows = Buy when:
- CVD shows bullish divergence
- AND a hammer/pin bar appears
Red arrows = Sell when:
- CVD shows bearish divergence
- Confirmed by hanging man/engulfing pattern
Pro tip:
For best results, combine with:
• Volume profile analysis
• Smart Money concepts (order blocks, FVGs )
Important notes:
This isn't a holy grail - I personally use it with support/resistance levels. Works best on 5M charts for scalping.
**PS** Got questions? Drop them in comments!
