GIX-KC-MAStrategia folosește doar KC si SMA 50 (filter + HTF SMA).
Intrările sunt agresive și foarte filtrate (close > SMA + break + HTF confirm).
Se folosesc pending orders automatizate, cu:
Entry = High ± pips
SL = Low ± pips
Expirare automată după X bare
Anulare la semnal opus
KC are 3 moduri de TP
Padrões gráficos

Passi Bias (VWAP + EMA50/100 + Light Pullback Colors)The best script ever made for å find out bias for the day

ICT POIs By DSIndicator to identify POI's like OB/FVG and SCOB. It also have a different ATR based filters and inside bar logic for OB detection

Strategia S&P 500 vs US10Y Yield (od 2000)This strategy explores the macroeconomic relationship between the equity market (S&P 500) and the debt market (10-Year Treasury Yield). Historically, rapid spikes in bond yields often exert downward pressure on equity valuations, leading to corrections or bear markets.
The goal of this strategy is capital preservation. It attempts to switch to cash when yields are rising too aggressively and re-enter the stock market when the bond market stabilizes.

Strategia S&P 500 vs US10Y YieldThis strategy explores the macroeconomic relationship between the equity market (S&P 500) and the debt market (10-Year Treasury Yield). Historically, rapid spikes in bond yields often exert downward pressure on equity valuations, leading to corrections or bear markets.
The goal of this strategy is capital preservation. It attempts to switch to cash when yields are rising too aggressively and re-enter the stock market when the bond market stabilizes.

Market Cycle VisualizerPlots a customizable time-based grid on your chart to visualize market cycles. Draws vertical boundaries at interval starts, horizontal opening lines, and tracks high/low ranges within each period. Ideal for identifying recurring patterns and structure across custom timeframes.


teril 1H EMA50 Harami Reversal Alerts BB Touch teril Harami Reversal Alerts BB Touch (Wick Filter Added + 1H EMA50)
teril Harami Reversal Alerts BB Touch (Wick Filter Added + 1H EMA50)
teril Harami Reversal Alerts BB Touch (Wick Filter Added + 1H EMA50)
teril Harami Reversal Alerts BB Touch (Wick Filter Added + 1H EMA50)

AI Exclusive(Precision Entry)AI Exclusive (Precision Entry)
Overview: An indicator that provides precise entry signals along with defined Take Profit (TP) and Stop Loss (SL).
Benefits:
• Confident entries with built in risk management
• Clear TP and SL displayed on the chart
• Suitable for both beginner and professional traders
Features:
• Transparent, unambiguous signals
• Usable on all symbols and timeframes
• Visual design with colored lines and clear labels

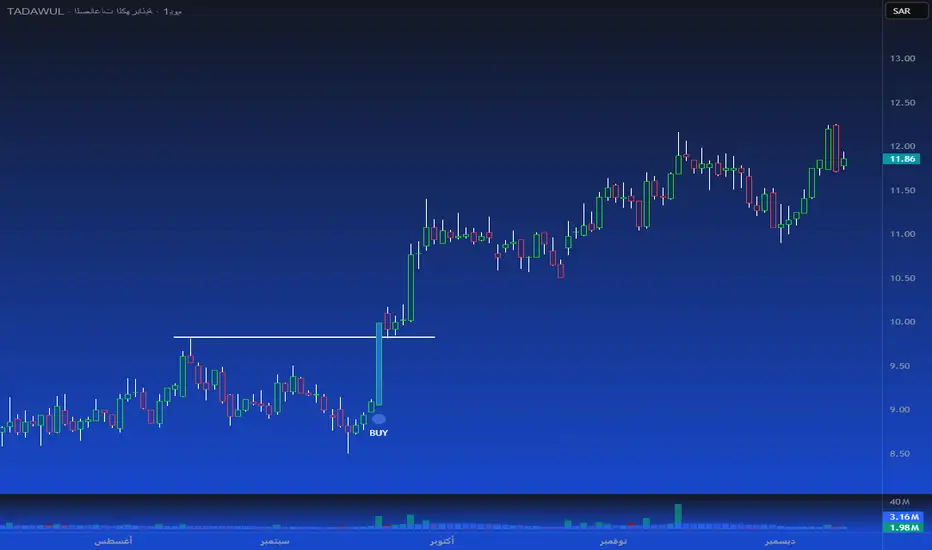
Blue Pattern Candle Title:
Blue Pattern Candle — Smart Bullish Breakout Detector
Short Title:
Blue Pattern Candle
Tags:
trend, pattern, breakout, candle-pattern, momentum, volume, signal, entry, swing-trading
Short Description:
A smart bullish breakout candle pattern detector with trend and volume confirmation.
Full Description:
The Blue Pattern Candle indicator identifies a high-probability bullish breakout pattern by combining structural candle behavior, trend alignment, and optional volume confirmation. It highlights moments where price strength and market structure converge, offering traders a clean and reliable visual cue for potential upward continuation.
How It Works
The script analyzes price action to detect a recurring bullish structure where:
A defined swing-based candle formation emerges.
Price closes above the key reference level of the pattern.
EMA(20) and SMA(40) confirm directional momentum.
Optional volume conditions validate the strength of the move.
When all requirements are met, the bar is highlighted and a BUY label is plotted beneath the candle.
Key Features
Automatic detection of a bullish breakout candle pattern
EMA/SMA trend confirmation
Optional volume filter for improved signal quality
Clear visual signals, including blue candle highlight and BUY labels
Built-in alert (“Pattern Breakout”)
Compatible with all markets and timeframes
Use Cases
Identifying early bullish continuation setups
Detecting breakout opportunities
Filtering long entries in trending markets
Enhancing existing trading systems with pattern confirmation
Suitable for intraday, swing, and position traders
Notes
Signals confirm only after candle close.
Volume filtering is optional for markets with low or unreliable volume.
Indicator does not repaint.
Disclaimer
This script is for educational and analytical purposes only and does not constitute financial advice. Trading involves risk; always validate signals before using them in live markets.
Developer
Developed by Abdulrahman Alotaibi — ATA Scripts
ZKNZCN Önceki Bar H/L (Ayrı Kontrol)Bir önceki barın high & low noktalarını çizgi halinde görmeyi sağlar.

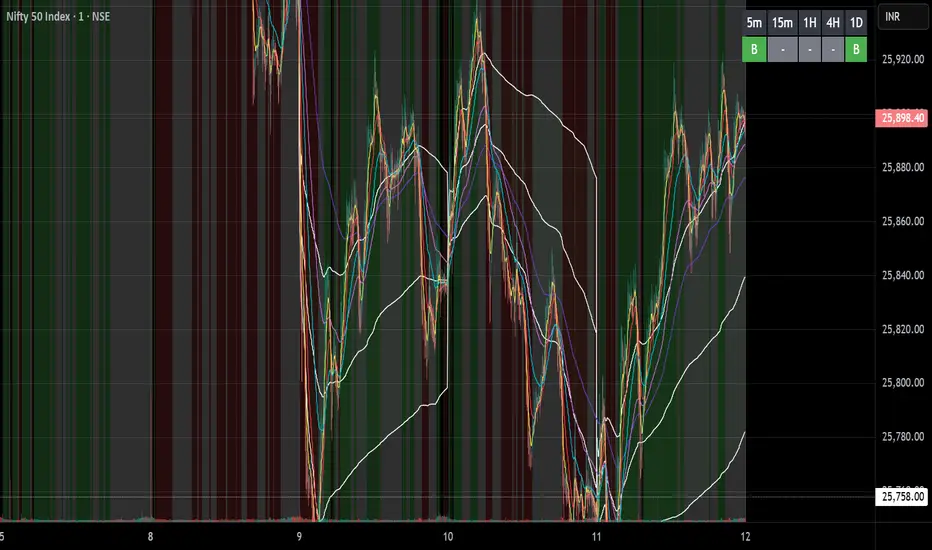
Keltner Channels Strategy NewThe strategy is chenging the same as an original copy, but this one is for tests, so I will publish it and check results

Trend Flow & Breakout Professional [Strategy]Description:
🌪️ Overview
Stop guessing. Start following the flow.
The Trend Flow & Breakout Professional is a high-precision visual trading system designed to solve the biggest problem traders face: Choppy Markets & Fakeouts.
Instead of relying on lagging indicators that generate false signals, this engine uses a proprietary "Momentum Alignment Algorithm" to identify when price action is entering a genuine expansion phase. It transforms complex trend data into a clean, easy-to-read visual roadmap, allowing you to catch the meat of the move while filtering out the noise.
🔮 Key Features
1. The "Traffic Light" Visual System Trading is 90% psychology. This script reduces mental fatigue by coloring the chart background to reflect the dominant market state:
🟢 Green Zone (Bullish Flow): Momentum is accelerating upwards. The system suggests holding long positions and ignoring minor pullbacks.
🔴 Red Zone (Bearish Flow): Structure has broken down. The system suggests defensive measures or short entries.
Note: The background remains active as long as the trend structure holds, preventing you from exiting trades too early.
2. Smart Noise Filtering Unlike standard crossover strategies that get destroyed in sideways ranges, this system includes a Multi-Layer Trend Filter. It only triggers a signal when:
Short-term momentum aligns perfectly with the medium-term direction.
Volatility expands significantly (breakout confirmation).
Price successfully clears key long-term structural resistance (The "Blue Sky" Zone).
3. Built-in "Smart Strategy" Backtester We have integrated a professional-grade position management module. You can customize how the strategy executes trades in the settings:
Mode A: Sniper (Trend Reversal): Enters heavily on the first confirmed breakout and holds until the trend reverses. Ideal for swing traders.
Mode B: Builder (Pyramiding): Adds to the position incrementally as the trend confirms its strength, maximizing profit during strong runs.
4. Cooldown Mechanism To prevent over-trading, the algorithm includes a smart "Cooldown Period" that prevents signal spamming during high-volatility consolidations.
⚙️ How to Trade This System
Wait for the Signal:
Look for the "Buy" / "Sell" labels accompanied by a bright Neon Candle.
Ensure the background color shifts (e.g., from Grey/Red to Green).
Ride the Zone:
Do not exit just because of one red candle. As long as the Background remains Green, the trend is healthy.
The background color acts as your "psychological anchor," helping you let profits run.
Exit / Reversal:
A complete background color flip (e.g., Green to Red) indicates a structural trend failure. This is your signal to close positions or flip directions.
⚠️ Disclaimer
This tool is for educational and technical analysis purposes only. Past performance does not guarantee future results. Always use proper risk management.

Dynamic Trend Channel - Adaptive Support & Resistance SystemA powerful trend-following indicator that adapts to market conditions in real-time. The Dynamic Trend Channel uses ATR-based volatility measurements to create intelligent support and resistance zones that adjust automatically to price action.
Key Features:
✓ Adaptive channel width based on market volatility (ATR)
✓ Color-coded trend identification (Green = Bullish, Red = Bearish)
✓ Smooth, flowing bands that reduce noise
✓ Breakout signals for high-probability entries
✓ Real-time info table showing trend status and price positioning
✓ Customizable settings for all timeframes

Engulfing Failed Zone Detector by RWBTradeLabEngulfing Failed Zone Detector by RWBTradeLab
A clean, non-repainting tool that focuses on one thing only: showing where strong engulfing patterns failed and the market broke through their base.
What this indicator does
This script automatically scans for confirmed engulfing patterns (Regular & E-Regular) and then tracks where those structures are invalidated.
It highlights two types of failure zones:
1. Buy Engulfing Failed
* A bullish engulfing pattern forms (Regular or E-Regular).
* Later, a bearish candle closes below the base low of that engulfing.
* The zone from the base candle to the failure candle is marked as Buy EG Failed .
2. Sell Engulfing Failed
* A bearish engulfing pattern forms (Regular or E-Regular).
* Later, a bullish candle closes above the base high of that engulfing.
* The zone from the base candle to the failure candle is marked as Sell EG Failed .
Only the first clear failure after each engulfing is drawn, keeping the chart clean and readable.
Visuals on chart
1. A rectangle (box) is drawn from the engulfing base candle to the failure candle.
2. Labels are placed automatically:
* Buy EG Failed (below the zone)
* Sell EG Failed (above the zone)
3. Label distance from the zone is controlled by Text Offset from Box (%).
4. Separate color controls for:
* Buy Engulfing Failed Box Color
* Sell Engulfing Failed Box Color
The label style matches Engulfing Detector by RWBTradeLab for a consistent visual experience.
Alerts
Built-in alerts trigger only on confirmed bar close when a new failure completes:
* Buy EG Failed
* Sell EG Failed
Each alert message includes:
* Brand prefix: RWBTradeLab
* Price
* Time
* Ticker
Perfect for linking with bots, webhooks or alert-based trade management.
Key settings
Candle Length (closed candles)
* Defines how many recent confirmed candles are scanned (the live bar is excluded).
Display toggles
* Buy Engulfing Failed
* Sell Engulfing Failed
* Text
Turn each element ON/OFF to control how much information you want on the chart.
Text Offset from Box (%)
* Controls how far the label is placed from the failed zone, with a safe minimum to keep labels clear and readable.
Non-repainting confirmation
* All detection and alerts are based on closed candles only.
* No signals from the running candle, no repaint tricks.
* Once a failure zone appears, it stays fixed.
Best use
Failed engulfing zones can reveal:
* Broken demand/supply zones
* Liquidity grabs where “smart money” flushed traders out
* Strong momentum shifts after a failed reversal attempt
* Levels where continuation or clean retests often occur
Works on any symbol and timeframe. For best results, combine with:
* Higher timeframe structure
* Key support/resistance or supply/demand mapping
* Your own confirmation tools and risk management
Disclaimer
This indicator is a technical pattern-detection tool, not financial advice. Trading involves risk. Always confirm signals with your own analysis and use proper risk management.
Creator: RWBTradeLab
If this script adds value to your trading, please leave a ⭐ and share your feedback.

Po3 CandlesPo3 Candles is a clean visual tool that projects higher-timeframe candles (default: 4H) onto the right side of any chart, regardless of the chart’s current timeframe. This allows traders to see the structure of the higher timeframe ahead of price, without switching charts.
This is especially useful for:
ICT / SMC style traders
Traders who rely on HTF bias
Intraday traders who want to monitor HTF PO3 sequences
Futures, indices, crypto, and FX
What It Does
This indicator displays the last N higher-timeframe candles (1–4), drawn to the right side of your chart:
Always uses real HTF data, independent of the current chart timeframe
Candles appear oldest on the left → newest on the right
Can show only the current HTF candle or up to 4 candles total
Includes fully centered wicks for clean visual alignment
Candle body width + spacing are configurable
Candle colors can match your chart theme
The result is a floating, mini HTF “chart” that updates live as the current HTF candle forms.

Engulfing Overlap Zone Detector by RWBTradeLabEngulfing Overlap Zone Detector by RWBTradeLab
A focused, non-repainting tool that detects high-value “overlap zones” formed when one engulfing pattern fails and the opposite side immediately takes control.
What this indicator does
Instead of showing every engulfing pattern, this script filters out noise and highlights only Engulfing Overlap Zones:
1. It internally detects both:
* Regular Engulfing (R EG)
* E-Regular Engulfing (ER EG)
2. It then checks for engulfing failure:
* A Sell EG fails when a bullish candle closes above its base high.
* A Buy EG fails when a bearish candle closes below its base low.
3. After the failure, it looks for an opposite-side engulfing confirmation.
4. When the failed zone and the new opposite engulfing zone overlap, the script marks that region as a Buy EG Overlap or Sell EG Overlap zone.
Only these premium, overlap-based structures are shown on the chart.
Visuals on chart
1. Two stacked rectangles are drawn for each overlap setup:
* The failed engulfing zone
* The opposite confirming engulfing zone
2. Clean labels appear at the edge of the overlap:
* Buy EG Overlap (bullish zone)
* Sell EG Overlap (bearish zone)
3. Text distance from the zone is adjustable via Text Offset from Box (%).
4. Separate color controls for:
* Buy Engulfing Overlap Box
* Sell Engulfing Overlap Box
Alerts
Built-in alerts trigger only on confirmed bar close when a new overlap setup completes:
*Buy EG Overlap
*Sell EG Overlap
Each alert message includes price, time and ticker, prefixed with RWBTradeLab for easier filtering and automation.
Key settings
1. Candle Length (closed candles) – Defines how many recent confirmed candles are scanned (current bar is excluded).
2.Display toggles – Turn ON/OFF:
* Buy Engulfing Overlap
* Sell Engulfing Overlap
* Text labels
3. Text Offset from Box (%) – Controls how far the label is placed from the overlap zone, with a safe minimum to keep labels readable.
Non-repainting logic
* All calculations use closed candles only .
* No running-bar signals, no repaint tricks.
* The zones and alerts reflect stable, confirmed structures.
Best use
This indicator is designed to help you spot:
* Liquidity grabs and fake outs followed by real reversals
* Strong continuation zones after a failed attempt by the opposite side
* High-quality reaction areas for entries, pullbacks and retests
Works on any symbol or timeframe. For best results, combine with:
* Higher-timeframe market structure
* Key support/resistance or supply/demand zones
* Your own trade management and confirmation rules
Disclaimer
This script is a technical pattern-detection tool, not financial advice. Trading involves risk. Always use proper risk management and confirm signals with your own analysis.
Creator: RWBTradeLab
If this indicator helps your trading, please leave a ⭐ and share your feedback.


TedAlpha – Structure / FVG / OB Sessions:
Only looks for trades when price is inside your defined London or NY time blocks.
CHOCH:
Uses pivots to track swing highs/lows, then flags a bullish CHOCH when structure flips from LL/LH to HH/HL, and vice versa for bearish.
FVG:
Detects 3-candle imbalance and keeps the zone “active” for fvgLookback bars, then checks if price trades back into it.
Order Blocks:
On a CHOCH, grabs the last opposite candle (bearish before bull CHOCH = bullish OB, bullish before bear CHOCH = bearish OB) and marks its body as the OB zone.
Signal:
A valid long = bull CHOCH + in session + (price inside bullish FVG and/or bullish OB, depending on toggles).
Short is the mirror image.
RR 1:3:
SL uses the last swing low (for longs) or last swing high (for shorts), TP is auto-set at 3× that distance and plotted as lines.


MM SCALP TOOLKIT v6MM SCALP TOOLKIT v6 — What This Indicator Actually Does (Explained Clearly)
The MM SCALP TOOLKIT v6 is a true Swiss-army knife for scalpers.
It combines five different tools into one clean panel, removes clutter from your chart, and automates everything that normally slows a trader down.
“MM” = Money Management
“SCALP” = Short-term precision trading
Below is the exact breakdown of what it does and why it’s valuable.
⸻
1. Automatic Risk Calculation (True Money Management)
This is the strongest feature for both beginners and experienced traders.
The problem:
In scalping, decisions must be made in seconds.
There is no time to calculate position size manually:
• Deposit: $1000
• Risk: 1%
• Stop size: X points
→ “How many units should I open?”
The solution:
The dashboard (right side) calculates the position size for you.
You set these once:
• Account balance
• Risk percentage per trade
The indicator measures current volatility (ATR) and tells you:
“Size ≈ 453 units”
The benefit:
You simply open that size, knowing a stop-loss will cost exactly 1% of your account.
This prevents over-leveraging and account blow-ups.
⸻
2. Session Filter (EU / US Only)
What it does:
It highlights active trading hours and dims the chart during low-volume periods.
Gray = dead zone (no trades)
Bright = London or New York session (good volatility)
The benefit:
You avoid low-volume chop and only take signals during real market activity.
The indicator won’t trigger entries outside your chosen sessions.
⸻
3. Liquidity Sweeps / Stop-Hunts (Smart Money Logic)
What it detects:
When price breaks a previous swing high, grabs liquidity, and then snaps back — a classic stop-hunt.
On the chart you’ll see:
“SWEEP”
The benefit:
This pattern often marks where big players accumulate positions using retail stops.
Shorting after a liquidity grab is far safer than guessing tops.
⸻
4. Trend Filter (EMA Fast / Slow)
Two EMAs act as a simple and effective directional filter.
• Fast EMA above slow → LONG ONLY
• Fast EMA below slow → SHORT ONLY
The benefit:
It prevents you from trading against momentum — the #1 reason scalpers lose money.
This is the “don’t be stupid” filter.
⸻
5. Delta Proxy (Aggression Analysis)
The indicator estimates buy vs sell aggression inside each candle (order-flow style).
Why it’s useful:
If price sweeps liquidity upward but Delta is weak or red → buyers are not supporting the move.
This confirms a potential reversal and strengthens SCALP SHORT signals.
⸻
How to use it (step-by-step):
1. Look at the dashboard:
• Trend: DOWN
• Session: ON
• Delta confirms sell pressure
• Stop-hunt detected above recent swing
2. Watch the chart:
When all conditions align, you will see:
SCALP SHORT (red triangle)
3. Check position size:
Dashboard shows:
“Size ≈ 0.52 BTC”
4. Enter the trade:
Your risk is fixed automatically — always consistent, always safe.
⸻
Summary: Why This Indicator Matters
The MM SCALP TOOLKIT v6 forces you to trade systematically, not emotionally:
✔ Only during high-volume sessions
✔ Only in the direction of trend
✔ Only after liquidity events
✔ Only when Delta confirms
✔ Only with correct position sizing
It’s not “signals for entry” —
it’s a complete risk-managed scalping framework in a single tool.
