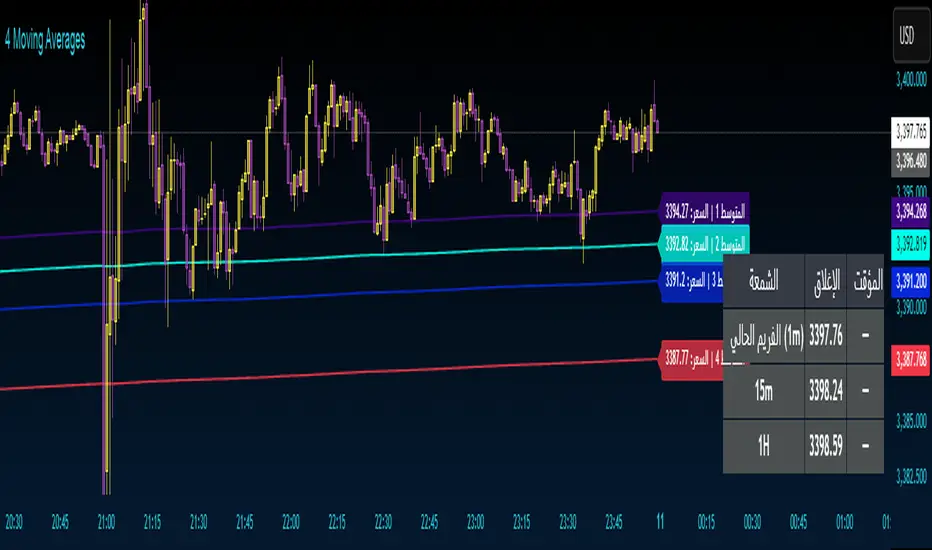
4 Moving Averages 4 Moving Averages
An indicator with four moving averages with ready-to-use settings. Use them as support and resistance.
Indicadores de Banda
VN30 Effort-vs-Result Multi-Scanner — LinhVN30 Effort-vs-Result Multi-Scanner (Pine v5)
Cross-section scanner for Vietnam’s VN30 stocks that surfaces Effort vs Result footprints and related accumulation/distribution and volatility tells. It renders a ranked table (Top-N) with per-ticker signals and key metrics.
What it does
Scans up to 30 tickers (editable input.symbol slots) using one security() call per symbol → stays under Pine’s 40-call limit and runs reliably on any chart.
Scores each ticker by counting active signals, then ranks and lists the top names.
Optional metrics columns: zVol(60), zTR(60), ATR(20), HL/ATR(20).
Signals (toggleable)
Price/Volume – Effort vs Result
EVR Squeeze (stealth): z(Vol,60) > 4 & z(TR,60) < −0.5
5σ Vol, ≤1σ Ret: z(Vol,60) > 5 & |z(Return,60)| < 1
Wide Effort, Opposite Result: z(Vol,60) > 3 & close < open & z(CLV×Vol,60) > 1
Spread Compression, Heavy Tape: (H−L)/ATR(20) < 0.6 & z(Vol,60) > 3
No-Supply / No-Demand: close < close & range < 0.6×ATR(20) & vol < 0.5×SMA(20)
Momentum & Volatility
Vol-of-Vol Kink: z(ATR20,200) rising & z(ATR5,60) falling
BB Squeeze → Expansion: BBWidth(20) in low regime (z<−1.3) then close > upper band & z(Vol,60) > 2
RSI Non-Confirmation: Price LL/HH with RSI HL/LH & z(Vol,60) > 1
Accumulation/Distribution
OBV Divergence w/ Flat Price: OBV slope > 0 & |z(ret20,260)| < 0.3
Accumulation Days Cluster: ≥3/5 bars: up close, higher vol, close near high
Effort-Result Inversion (Down): big vol on down day then next day close > prior high
How to use
Set the timeframe (works best on 1D for EOD scans).
Edit the 30 symbol slots to your VN30 constituents.
Choose Top N, toggle Show metrics/Only matches and enable/disable scenarios.
Read the table: Rank, Ticker, (metrics), Score, and comma-separated Signals fired.
Method notes
Z-scores use a population-std estimate; CLV×Vol is used for effort/location.
Rolling counts avoid ta.sum; OBV is computed manually; all logic is Pine v5-safe.
Intraday-only ideas (true VWAP magnets, auction volume, flows, futures/options) are not included—Pine can’t cross-scan those datasets.
Disclaimer: Educational tool, not financial advice. Always confirm signals on the chart and with your process.

VP-Period with Previous Day Levels & Historical POC# Volume Profile with Previous Day Levels & Historical POCs
## Description
Comprehensive indicator combining Volume Profile analysis, previous day levels, and historical POC (Point of Control) levels for advanced technical analysis.
## Key Features
### Volume Profile
- **Customizable period**: 3 to 500 days
- **Calculation resolution**: 400 to 700 points
- **Current VPOC**: Point of Control line for current period
- **Volume bars**: graphical display of volume profile distribution
### Historical POCs
- **POC history**: up to 20 previous days
- **Time labels**: shows how many days ago for each POC
- **Dashed lines**: easy identification of historical levels
### Previous Day Levels (last 5 days)
- **High/Low**: daily highs and lows
- **Midpoint**: 50% level (High+Low)/2
- **Open/Close**: opening and closing prices
- **Progressive thickness**: day 1 thicker, decreasing for previous days
## Customization
- Fully configurable colors for each element
- Toggle on/off switches for every component
- Different line styles (solid, dashed, dotted)
## Usage
Perfect for traders using volume analysis and support/resistance based on previous daily levels. Ideal for identifying key zones and significant breakout points.
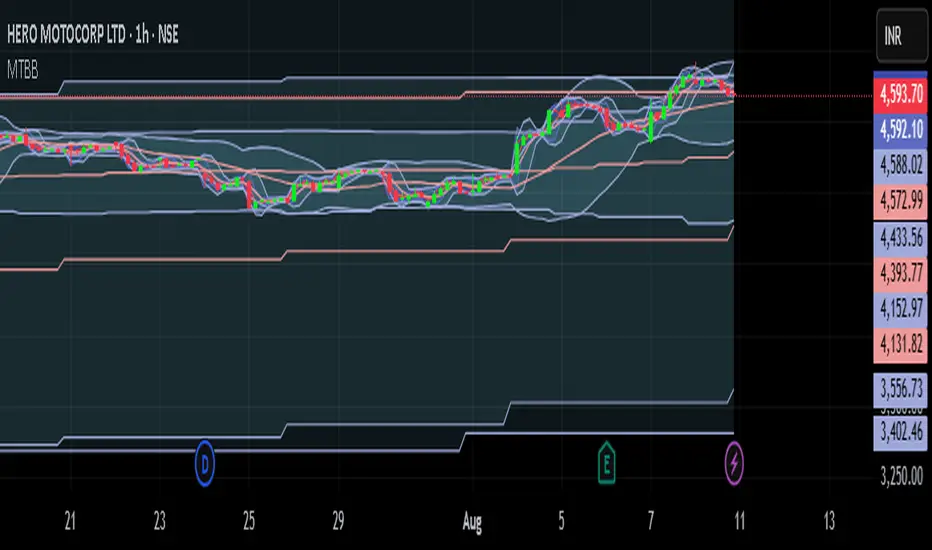
Multi Timeframe 7 Bollinger Bands by CSPMulti Timeframe 7 Bollinger Bands by CSP IT SHOW 1MT,5MT,10MT,1HR,D, W,M BOLLINGER BAND IN ASINGLE CHART.
Whaley Thrust — ADT / UDT / SPT (2010) + EDT (EMA) + Info BoxDescription
Implements Wayne Whaley’s 2010 Dow Award breadth-thrust framework on daily data, with a practical extension:
• ADT (Advances Thrust) — 5-day ratio of advances to (adv+dec). Triggers: > 73.66% (thrust), < 19.05% (capitulation).
• UDT (Up-Volume Thrust) — 5-day ratio of up-volume to (up+down). Triggers: > 77.88%, < 16.41%. Defaults to USI:UVOL / USI:DVOL (edit if your feed differs).
• SPT (Price Thrust) — 5-day % change of a benchmark (default SPY, toggle to use chart symbol). Triggers: > +10.05%, < −13.85%.
• EDT (EMA extension) — Declines-share thrust derived from WBT logic (not in Whaley’s paper): EMA/SMA of Declines / (Adv+Decl). Triggers: > 0.8095 (declines thrust), < 0.2634 (declines abating).
• All-Clear — Prints when ADT+ and UDT+ occur within N days (default 10); marks the second event and shades brighter green.
Visuals & Controls
• Shape markers for each event; toggle text labels on/off.
• Optional background shading (green for thrusts, red for capitulations; brighter green for All-Clear).
• Compact info box showing live ADT / UDT / SPT (white by default; turns green/red at thresholds).
• Min-spacing filter to prevent duplicate prints.
Tips
• Use on Daily charts (paper uses 5 trading days). Weekly views can miss mid-week crosses.
• If UDT shows 100%, verify your Down Volume symbol; the script requires both UVOL and DVOL to be > 0.
• Best use: treat capitulations (−) as setup context; act on thrusts (+)—especially when ADT+ & UDT+ cluster (All-Clear).
Credit
Core method from Wayne Whaley (2010), Planes, Trains and Automobiles (Dow Award). EDT is an added, complementary interpretation using WBT-style smoothing.

Relative Strength Buy/Sell SignalsThis Pine Script builds on the MarketSurge-style Relative Strength indicator. It calculates the RS line by comparing the stock's close to a benchmark (default: SPY). Buy signals are generated when the RS line crosses above its moving average (default 10-period SMA), indicating improving relative strength. Sell signals occur when it crosses below, suggesting weakening relative strength. Signals are labeled "BUY" (green) and "SELL" (red) on the chart, with background highlights.
It also retains the new 52-week RS highs (orange circles) and lows (purple circles), which can serve as additional confirmation for outperformance or underperformance.
Note: This approximates relative strength for trading signals but does not replicate the proprietary IBD RS Rating (a 1-99 percentile rank across all stocks). For best results, use on daily charts and combine with other analysis. Backtest thoroughly, as no strategy guarantees profits


ICT/SMC Liquidity Map V3 KyroowThe indicator is designed to map liquidity on the chart following the ICT/SMC logic, with the added feature of precise tracking of the Asian session.
It shows you:
PDH / PDL → Previous Day High & Low, automatically removed once taken out.
EQH / EQL → Equal Highs & Equal Lows (double tops/bottoms), with pip tolerance and a check to ensure no candle has already "cleared" the range.
ASH / ASL → Asian Session High & Low (the highs/lows of each closed Asian session).
Asian Session → Displayed as a box or shaded area, with visual history.
Dynamic tolerance management → EQH/EQL can have different tolerances depending on the timeframe.
Automatic removal → Levels are removed once the market takes them (via wick or body, configurable).
💡 In practice:
It helps you quickly identify likely liquidity grab zones, whether they come from the previous day, the Asian session, or equal highs/lows. This allows you to anticipate market reactions around these levels.

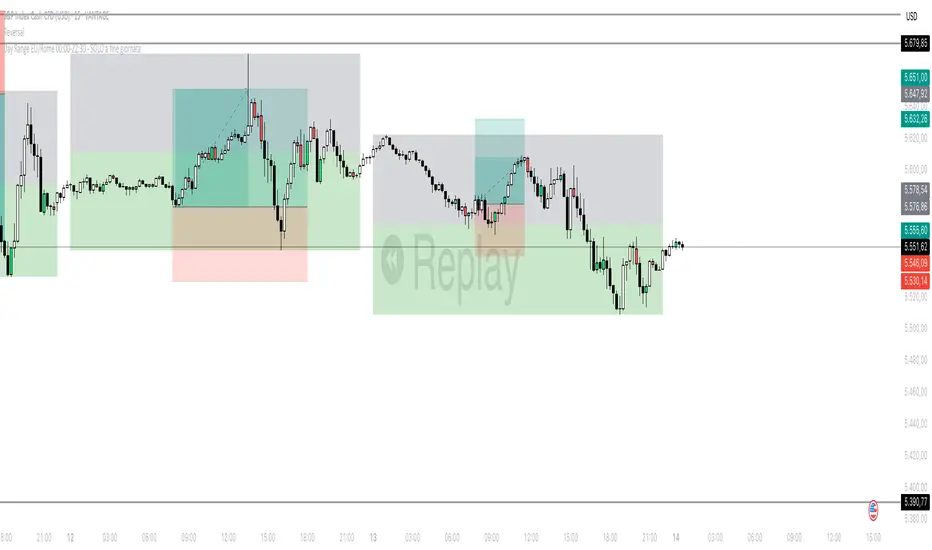
Day Range EU/Rome 00:00-22:30 Final Version# Day Range EU/Rome 00:00–22:30 — live + historical (colors)
**What it does**
Draws, for each day (timezone **Europe/Rome**), a rectangle that contains the **high** and **low** recorded between **00:00** and **22:30**.
* During the day it creates a **live box** that updates bar by bar (it extends to the latest candle).
* At the end of the session (after 22:30) it saves a **fixed historical box** for that day.
* The rectangle is **split horizontally**: half **top** and half **bottom** (customizable colors).
* Boxes are **anchored in time** (*xloc = bar\_time*): they don’t “slide” when you zoom or pan the chart.
* Works on **intraday** timeframes (recommended **15m**; also fine on 5m, 30m, 1h).
* Includes **all days**, **Friday included**.
---
## How it works
* The code detects the **00:00 → 22:30 (Europe/Rome)** session with `time("0000-2230","Europe/Rome")`.
* Within that window it continuously updates the day’s **High/Low**.
* When the **session closes** it creates two historical boxes (upper and lower halves) using the **H/L** of the day that just ended.
* The current day’s box remains **live** and follows the chart until 22:30.

Day Range EU/Rome 00:00-22:30 - live + storico (colori)# Day Range EU/Rome 00:00–22:30 — live + historical (colors)
**What it does**
Draws, for each day (timezone **Europe/Rome**), a rectangle that contains the **high** and **low** recorded between **00:00** and **22:30**.
* During the day it creates a **live box** that updates bar by bar (it extends to the latest candle).
* At the end of the session (after 22:30) it saves a **fixed historical box** for that day.
* The rectangle is **split horizontally**: half **top** and half **bottom** (customizable colors).
* Boxes are **anchored in time** (*xloc = bar\_time*): they don’t “slide” when you zoom or pan the chart.
* Works on **intraday** timeframes (recommended **15m**; also fine on 5m, 30m, 1h).
* Includes **all days**, **Friday included**.
---
## How it works
* The code detects the **00:00 → 22:30 (Europe/Rome)** session with `time("0000-2230","Europe/Rome")`.
* Within that window it continuously updates the day’s **High/Low**.
* When the **session closes** it creates two historical boxes (upper and lower halves) using the **H/L** of the day that just ended.
* The current day’s box remains **live** and follows the chart until 22:30.

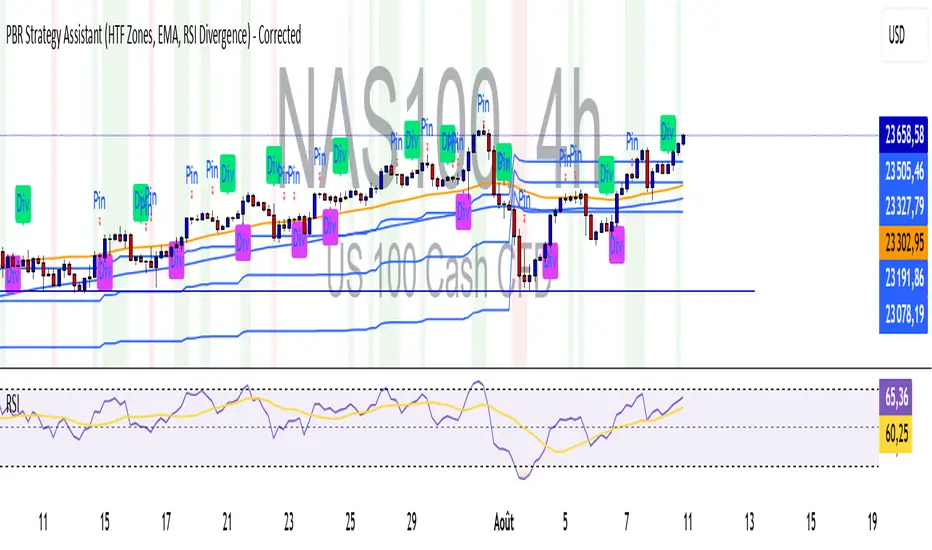
PBR Strategy Assistant Gold.D FingerGold.D Finger Strategy. This indicator gives an overview of my first strategies with several confluences. I just wanted to test what it would look like in this format, but it does not exactly match the one I actually use.
_mr_beach Sunday Entwicklung Version 1_mr_beach Sunday Development Version 1
Short Description (for TradingView publication):
This indicator combines EMA crossovers, VWAP with standard deviation bands, gap detection, pivot-based support & resistance, and VWAP distance labels in a single overlay. Perfect for discretionary traders aiming to efficiently identify gap fills, trend reversals, and key price levels. All components can be toggled on/off via the settings menu.
Full Indicator Description:
🧠 Purpose of the Indicator:
This all-in-one tool merges several analytical features to visualize trend direction, market structure, key price levels (e.g., gaps, VWAP distance, pivot support), and entry signals at a glance.
🔧 Integrated Features:
EMA20 / EMA50: Trend detection via moving averages. Crossover signals indicate potential entries.
VWAP + Band: Volume-weighted average price with visual deviation bands.
GAP-Up / GAP-Down: Price gaps are highlighted in color (brown/yellow), optionally showing only open ones.
VWAP Distance Label: Displays the current price’s percentage deviation from the VWAP as a chart label.
Buy/Sell Signals: Triggered by EMA20 and EMA50 crossovers.
HH/LL SL-Marker: Identifies local highs/lows using pivots.
Support & Resistance: Automatically calculated pivot zones.
Customizable Visibility: All features can be toggled in the settings menu.
Dummy Plot: plot(na) ensures error-free compilation.
⚙️ Settings Menu Options:
Show VWAP: Displays VWAP and deviation bands.
Show EMA20 / EMA50: Shows the moving averages.
Show Gaps: Enables gap detection.
Show Only Open Gaps: Hides already filled gaps.
Show VWAP Distance: Activates VWAP deviation label.
Support & Resistance: Displays pivot-based zones as support/resistance.
🔔 Alerts:
‘Mads Morningstar Signal’: Buy/Sell alerts based on EMA crossover.
📈 Use Cases:
Trend-following setups using EMA crossover
Gap-fill trading strategies
VWAP reversion trades
SL/TP based on HH/LL or pivot levels
Visual chart preparation for scalping, intraday, or swing trading
🛠 Suggested Extensions:
Gap table showing open levels
Take-Profit/Stop-Loss strategy
Alerts for new gap formation
Strategy tester module with gap-based entries

Day Range EU/Rome 00:00-22:30 - live + storico (colori)# Day Range EU/Rome 00:00–22:30 — live + historical (colors)
**What it does**
Draws, for each day (timezone **Europe/Rome**), a rectangle that contains the **high** and **low** recorded between **00:00** and **22:30**.
* During the day it creates a **live box** that updates bar by bar (it extends to the latest candle).
* At the end of the session (after 22:30) it saves a **fixed historical box** for that day.
* The rectangle is **split horizontally**: half **top** and half **bottom** (customizable colors).
* Boxes are **anchored in time** (*xloc = bar\_time*): they don’t “slide” when you zoom or pan the chart.
* Works on **intraday** timeframes (recommended **15m**; also fine on 5m, 30m, 1h).
* Includes **all days**, **Friday included**.
---
## How it works
* The code detects the **00:00 → 22:30 (Europe/Rome)** session with `time("0000-2230","Europe/Rome")`.
* Within that window it continuously updates the day’s **High/Low**.
* When the **session closes** it creates two historical boxes (upper and lower halves) using the **H/L** of the day that just ended.
* The current day’s box remains **live** and follows the chart until 22:30.
Monthly High/Low & % Move By Ai Trade LabYou can have idea How much it moved Monthly. Just Change it to Monthly

$TICK & TICKQ Sentiment IndicatorThe USI:TICK & USI:TICKQ Sentiment Indicator is a versatile tool for traders analyzing the NYSE Tick Index ( USI:TICK ) or Nasdaq Tick Index ( USI:TICKQ ) to gauge market sentiment. It provides clear visual signals, a customizable moving average, and statistical insights to identify bullish and bearish conditions in real-time.
Key Features:
Sentiment Signals: Green triangle (▲) labels at a user-defined level (default: +1200) when the Tick closes above zero, and red triangle (▼) labels (default: -1200) when below zero, indicating bullish or bearish sentiment.
Adjustable Moving Average: Plots a customizable moving average (SMA, EMA, WMA, VWMA, SMMA, HullMA) with user-defined length (default: 14) to smooth Tick data and highlight trends.
Close Statistics: Displays the percentage of positive and negative Tick closes over a user-specified lookback period (default: 100) in a customizable table (position and font size adjustable).
Threshold Lines: Includes reference lines at +800/-800 (gold) and +1000/-1000 (red) to mark key Tick levels, plus a zero line (gray, dashed) for context.
Customizable Display: Adjust symbol sizes (tiny, small, normal, large, huge), table position (top-right, top-left, etc.), and table font size for a tailored chart experience.
How to Use:
Apply the indicator to a USI:TICK or USI:TICKQ chart (e.g., TVC:TICK, TVC:TICKQ) on an intraday timeframe (e.g., 1-minute, 5-minute).
In the settings:
Set the TICK Symbol to your broker’s NYSE Tick ( USI:TICK ) or Nasdaq Tick ( USI:TICKQ ) symbol.
Adjust Top Level and Bottom Level (default: +1200/-1200) to position sentiment signals at chart edges.
Set Moving Average Length and Type to suit your analysis.
Configure Lookback Period for close percentage calculations.
Customize Dot Size , Table Position , and Table Font Size for optimal visibility.
Monitor green/red triangles for sentiment, the moving average for trends, and the table for statistical insights.
Notes:
This indicator is designed for both USI:TICK (NYSE Tick) and USI:TICKQ (Nasdaq Tick, NQ Tick), allowing analysis of either market’s breadth.
Ensure your chart’s timeframe supports USI:TICK or USI:TICKQ data.
Adjust Top Level / Bottom Level if symbols don’t appear at chart edges due to scaling.
Labels may stack with frequent signals; contact the developer for customization to limit frequency.
No symbol appears if the Tick closes at 0; a neutral marker can be added upon request.
Ideal For:
Day traders and scalpers using USI:TICK or USI:TICKQ to gauge market breadth.
Analysts seeking customizable visualizations and statistical insights for Tick data.
Created by northfieldwhale.

SD Bands Filtered Signals### SD Bands Filtered Signals: Reversion & Volatility Scanner
**Core Description:**
The SD Bands Filtered Signals is a tool developed to help traders identify more accurate buy and sell signals in sideways markets, or during periods of low price movement. It utilizes the principles of Standard Deviation (SD) and a Moving Average (MA), with a unique 'signal filtering' system added to reduce unnecessary noise.
**Key Features:**
* **SD Bands:** Creates upper and lower bands to define price volatility zones, providing a clear overview of market conditions.
* **Intelligent Reversal Signals:** Generates specially filtered Buy/Sell signals for a 'Reversion to the Mean' strategy. These signals appear only when the market has low volatility and the price touches the SD Bands.
* **Advanced Signal Filtering System:** Uses a **`Cooldown Bars`** variable to set a rest period between signals. This prevents repetitive arrows in the same zone, helping you find the best signal at the most suitable point.
* **Fully Customizable:** You can adjust the **`Length`**, **`Multiplier`**, **`Sideways Threshold`**, and **`Cooldown Bars`** to fit your trading style and asset of choice.
**How to Use:**
* **Buy Signal (Green Arrow Up):** Look for this signal when the market is sideways and the price moves down to touch the lower band (SD Low).
* **Sell Signal (Red Arrow Down):** Look for this signal when the market is sideways and the price moves up to touch the upper band (SD High).
* **Customization:** You can adjust the **`Cooldown Bars`** value to control the number of arrows. If you want more accurate but fewer signals, increase this value.
**Disclaimer:**
* This indicator is an **analytical tool only** and is not a 100% guarantee of profit.
* It should be used in conjunction with other forms of analysis, such as candlestick patterns, trading volume, and proper risk management.
ไทย
ชื่ออินดิเคเตอร์ "SD Bands Filtered Signals: Reversion & Volatility Scanner"
คำอธิบายหลัก:
อินดิเคเตอร์ SD Bands Filtered Signals เป็นเครื่องมือที่ถูกพัฒนาขึ้นเพื่อช่วยให้นักเทรดสามารถระบุสัญญาณซื้อ (Buy) และขาย (Sell) ที่แม่นยำขึ้นในตลาดแบบ Sideways หรือช่วงที่ราคาเคลื่อนที่ในกรอบแคบๆ โดยใช้หลักการของ Standard Deviation (SD) และ Moving Average (MA) และเพิ่มระบบ 'กรองสัญญาณ' ที่เป็นเอกลักษณ์เพื่อลดสัญญาณรบกวน (Noise) ที่ไม่จำเป็นออกไป
คุณสมบัติเด่น:
* SD Bands: สร้างเส้นขอบบนและล่างเพื่อระบุโซนความผันผวนของราคา ทำให้เห็นภาพรวมของตลาดได้ง่าย
* สัญญาณ Reversal อัจฉริยะ: สร้างสัญญาณ Buy/Sell ที่ถูกคัดกรองมาเป็นพิเศษสำหรับกลยุทธ์การกลับตัว (Reversion to the Mean) โดยจะปรากฏเฉพาะเมื่อตลาดมีความผันผวนต่ำและราคาแตะขอบของ SD Bands
* ระบบกรองสัญญาณขั้นสูง: ใช้ตัวแปร Cooldown Bars เพื่อกำหนดระยะเวลาพักสัญญาณ ทำให้ไม่เกิดลูกศรซ้ำๆ ในโซนเดียวกัน และช่วยให้คุณได้สัญญาณที่ดีที่สุดในจุดที่เหมาะสมที่สุด
* ปรับแต่งได้เต็มที่: คุณสามารถปรับค่า Length, Multiplier, Sideways Threshold และ Cooldown Bars เพื่อให้เข้ากับสไตล์การเทรดและคู่สินทรัพย์ที่คุณสนใจ
วิธีการใช้งาน:
* สัญญาณ Buy (ลูกศรสีเขียวขึ้น): มองหาสัญญาณนี้เมื่อตลาดอยู่ในช่วง Sideways และราคาวิ่งลงมาแตะเส้นขอบล่าง (SD Low)
* สัญญาณ Sell (ลูกศรสีแดงลง): มองหาสัญญาณนี้เมื่อตลาดอยู่ในช่วง Sideways และราคาวิ่งขึ้นไปแตะเส้นขอบบน (SD High)
* การปรับแต่ง: คุณสามารถปรับค่า Cooldown Bars เพื่อให้ได้จำนวนลูกศรที่ต้องการ หากต้องการสัญญาณที่แม่นยำขึ้นแต่จำนวนน้อยลง ให้เพิ่มค่านี้ให้สูงขึ้น
ข้อควรระวัง:
* อินดิเคเตอร์นี้เป็นเพียงเครื่องมือวิเคราะห์ ไม่ใช่สัญญาณที่การันตีผลกำไร 100%
* ควรใช้ประกอบกับการวิเคราะห์อื่นๆ เช่น รูปแบบแท่งเทียน, ปริมาณการซื้อขาย (Volume) และการจัดการความเสี่ยงที่เหมาะสม

COG-10 + Deviation BandsClassic Center of Gravity, COG
«Center of Gravity»
COG is a weighted moving average, in which new bars have more weight, and old ones have less.
Formula (Pine equivalent):
COG = – Σ (price × (i+1)) / Σ price
• i = 0 – the most recent bar
• i = length-1 – the oldest bar
The minus sign simply flips the curve so that the extremes coincide with the price reversals.
Bars: | 9 | 8| 7 | 6| 5| 4| 3 | 2 | 1 | 0 |
Weight: |1 | 2 | 3 | 4| 5| 6| 7| 8 | 9| 10|
Where COG is used
Reversal zones
– when the price moves far from the COG, it is considered «overbought/oversold»; return to COG – potential reversal.
Dynamic support/resistance
– in a sideways trend, the price often bounces off the COG.
Trend filter
– if COG grows → uptrend, falls → downtrend.
Strategy pairs
• COG + deviation bands (analogous to Bollinger) is given in lines
• COG + RSI – confirmation of divergences
• COG + volume (weighted by volume) is given in yellow lines
Перевод для русской аудитории
Classic Center of Gravity, COG
«Центр тяжести»
COG – это взвешенное скользящее среднее, в котором новые бары имеют больший вес, а старые – меньший.
Формула (Pine-эквивалент):
COG = – Σ (price × (i+1)) / Σ price
• i = 0 – самый свежий бар
• i = length-1 – самый старый бар
Знак «минус» просто переворачивает кривую, чтобы экстремумы совпадали с разворотами цены.
Бары: | 9 | 8| 7 | 6| 5| 4| 3 | 2 | 1 | 0 |
Вес: |1 | 2 | 3 | 4| 5| 6| 7| 8 | 9| 10|
Где применяют COG
Разворотные зоны
– когда цена отходит далеко от COG, считается «перекупленностью/перепроданностью»; возврат к COG – потенциальный разворот.
Динамическая опора/сопротивление
– в боковике цена часто отталкивается от COG.
Фильтр тренда
– если COG растёт → восходящий тренд, падает → нисходящий.
Пары стратегий
• COG + полосы отклонения (аналог Bollinger) приводится в линиях
• COG + RSI – подтверждение дивергенций
• COG + объём (взвешивать по volume) приводится в желтых линиях
Terminal de Estrategias PRO (MTF + Order Blocks)this is a new test for the implementation of functions on my app web for signals


Quantum Range Filter by MRKcoin### Quantum Range Filter by MRKcoin
**Overview**
This indicator is a sophisticated range detection tool designed based on the principles of quantitative multi-factor models. Instead of relying on a single condition, it assesses the market from three different dimensions to provide a more robust and reliable identification of range-bound (sideways) markets.
When the background is highlighted in red, it indicates that the market is likely in a range phase, suggesting that trend-following strategies may be less effective, and mean-reversion (range trading) strategies could be more suitable.
---
**Core Logic: A Multi-Factor Approach**
The filter evaluates the market state using the following three independent factors:
1. **Momentum Volatility (RSI Bollinger Bandwidth):**
* **Question:** Is the momentum of the market contracting?
* **Method:** It measures the width of the Bollinger Bands applied to the RSI. A narrow bandwidth suggests that momentum is consolidating, which is a common characteristic of a range market.
2. **Price Volatility (ATR Ratio):**
* **Question:** Is the actual price movement shrinking?
* **Method:** It calculates the Average True Range (ATR) as a percentage of the closing price. A low ratio indicates that the price volatility itself is low, reinforcing the case for a range environment.
3. **Absence of Trend (ADX):**
* **Question:** Is there a lack of a clear directional trend?
* **Method:** It uses the Average Directional Index (ADX), a standard tool for measuring trend strength. A low ADX value provides active confirmation that the market is not in a trending phase.
---
**How to Use**
1. **Range Detection:** The primary use is to identify ranging markets. The red highlighted background serves as a visual cue.
2. **Strategy Selection:**
* **Inside the Red Zone:** Consider using range-trading strategies (e.g., buying at support, selling at resistance, using oscillators like RSI or Stochastics for overbought/oversold signals). Avoid using trend-following indicators like moving average crossovers, as they are prone to generating false signals in these conditions.
* **Outside the Red Zone:** The market is likely trending. Trend-following strategies are more appropriate.
3. **Parameter Tuning (In Settings):**
* **This is the key to adapting the filter to any market or timeframe.** Different assets (like BTC vs. ETH) and different timeframes have unique volatility characteristics. Don't hesitate to adjust the parameters to fit the specific chart you are analyzing.
* **Range Detection Score:** This is the most important setting. It determines how many of the three factors must agree to classify the market as a range. The default is `2`, which provides a good balance.
* If the filter seems **too sensitive** (highlighting too often), increase the score to `3`.
* If the filter seems **not sensitive enough** (missing obvious ranges), decrease the score to `1`.
* **Factor Thresholds:** For fine-tuning, adjust the thresholds for each factor.
* **`RSI BB Width Threshold`:** If you want to detect even tighter momentum consolidations, *decrease* this value.
* **`ATR Ratio Threshold`:** If you want to be stricter about price volatility, *decrease* this value.
* **`ADX Threshold`:** To be more lenient on what constitutes a "trendless" market, *increase* this value (e.g., to 30). To be stricter, *decrease* it (e.g., to 20).
* **Pro Tip:** Use the Debug Table (uncomment it in the script's code) to see the live values of each factor. This will give you a clear idea of how to set the thresholds for the specific asset you are trading.
**Disclaimer**
This indicator is a tool to assist in market analysis and should not be used as a standalone signal for making financial decisions. Always use it in conjunction with your own trading strategy, risk management, and analysis. Past performance is not indicative of future results.
**Credits**
* **Concept & Vision:** MRKcoin

Custom 2 EMA Crossover Candle ColorIn this indicator you can change the moving averages according to you usage.

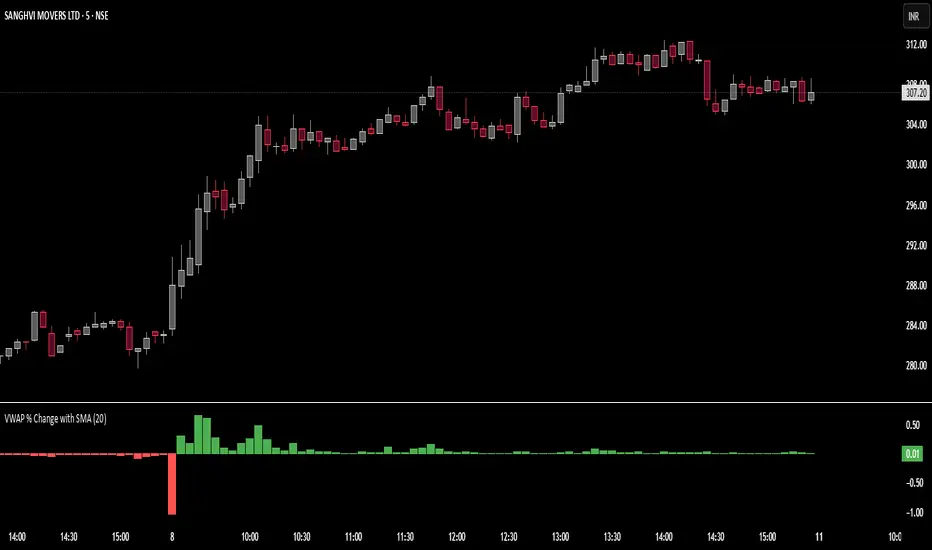
Intraday High/Low BandPlots an intraday high low band showing when the stock hits a new daily high/low.
Band can be defined as percentage of the daily range.
