My Exclusive Support & Resistance Strategyndicator Name:
Market Maker Pro: Multi-TF S&R & Hidden Signals (CALL/PUT)
Description:
This is a professional-grade institutional trading indicator designed to identify "Market Maker" entries by combining Volume-Weighted Average Price (VWAP), EMA Crossovers, and Multi-Timeframe Support & Resistance levels.
The indicator is optimized for traders who seek high-probability entries (CALL/PUT) on any timeframe, from 1-minute scalping to 4-hour swing trading.
Key Features:
Institutional Support & Resistance (4H & 1H): Automatically plots high-impact levels from the 4-hour and 1-hour charts. These appear as short, clean lines (12 bars) to keep the chart clutter-free.
Hidden Market Maker Logic: Uses a background combination of EMA 20 and EMA 50 crossovers, filtered by the VWAP (the "Fair Value" for big banks).
Precision Signals (CALL/PUT): * CALL Signal: Triggered only when EMA 20 crosses above EMA 50 while the price is trading above the VWAP.
PUT Signal: Triggered only when EMA 20 crosses below EMA 50 while the price is trading below the VWAP.
Multi-Timeframe Adaptive: Seamlessly works across all timeframes (1m, 5m, 15m, 1h, 4h).
Visual Confidence: High-visibility labels and background highlights ensure you never miss a confirmed institutional entry.
How to Trade:
Identify the Wall: Look for the thick lines (4H levels) to identify major reversal zones.
Wait for the Signal: Look for the CALL or PUT label.
Confirm with VWAP: The signal only appears if the price is on the correct side of the institutional volume (VWAP), giving you a "Market Maker" edge.
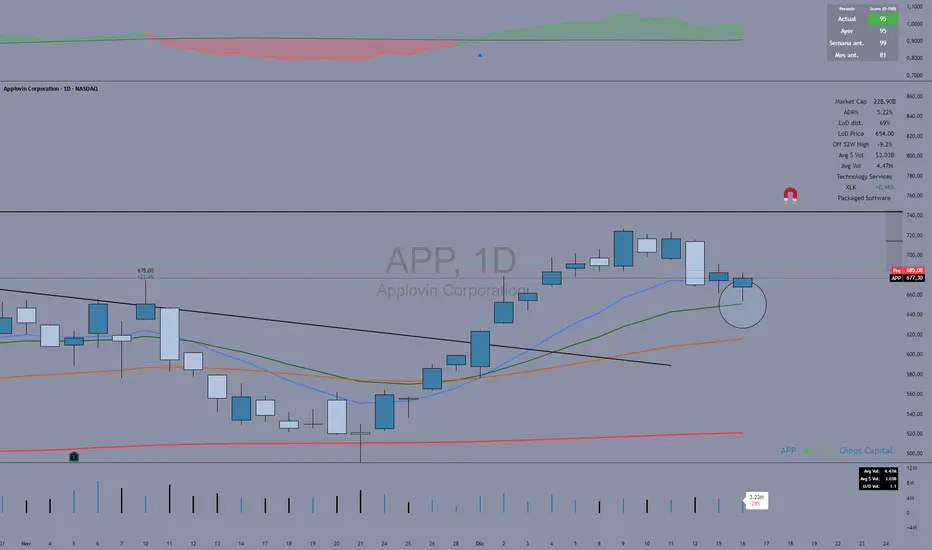
Indicadores de Banda

Fuerza Relativa vs SPY (Oleos Capital) RS Rating shaded, blue arrow when a crossover with the black line (SPY) occurs and the RS rating according to the period above right to see the evolution of the asset.
HMA vs Candle True CloudHMA vs Candle – Trend Cloud Indicator (Brief Note)
This indicator compares price (candle source) with a long-period Hull Moving Average (HMA) to identify trend direction, momentum shifts, and regime changes.
The HMA, being momentum-sensitive, reacts to changes in price speed, while price itself represents real-time market action.
A dynamic two-way cloud is drawn between price and HMA:
Green cloud when price is above HMA → bullish dominance and accumulation
Red cloud when price is below HMA → bearish control and distribution
The width of the cloud reflects the strength of momentum:
Narrow cloud → compression / consolidation
Expanding cloud → impulse move or trend acceleration
This setup is especially effective on short timeframes with long HMA periods, where it filters noise while preserving early trend signals.
Overall, the indicator acts as a visual trend-momentum framework, highlighting early warnings, trend confirmation, and exhaustion zones in a single view.

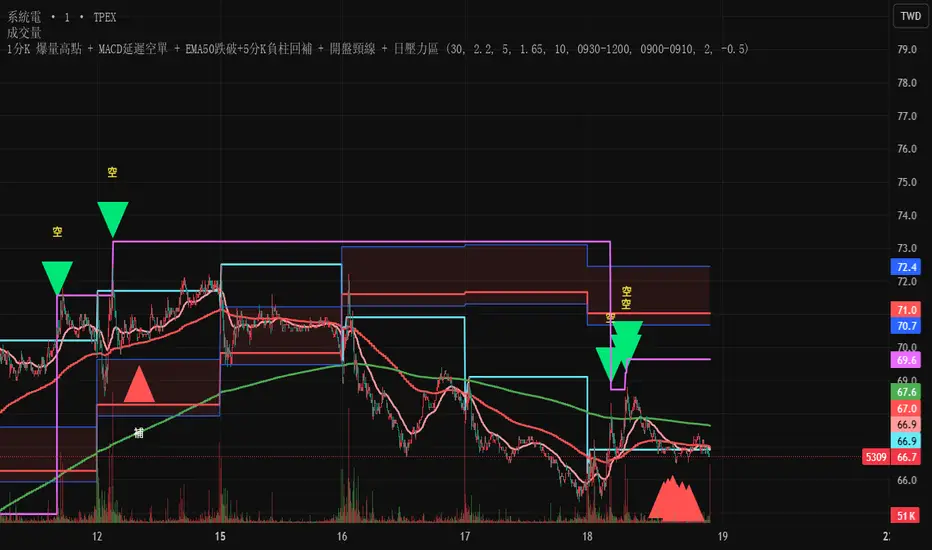
Test此指標為測試階段
最近手法改變,高點出現率後移,
此指標為爆量後跌破12ema才放空,
由於操盤手還是可以騙線,故時間設定為10:00之後成功率比較大
This indicator is in the testing phase.
Recently, the method has changed, and the occurrence rate of high points has shifted later.
This indicator only calls for shorting after a surge in volume followed by a drop below the 12-day moving average (EMA).
Because traders can still create false signals, setting the time after 10:00 AM increases the success rate.
TuxAlgo Plus a SMC and Trap Toolkit V0.98r1 by McTogaThe “TuxAlgo Plus” script is a powerful, standalone, conceptual open-source project and self-sufficient “smart money toolkit” with automatic trap detection (SMT), liquidity grabs, FVG confluence, and complete bot setup signals for TV charts in the “H1 to H6” time frame and daily charts.
The script is used to improve SMC/trap analyses, i.e., the structure and visualization logic for TradingView charts have been expanded in the “TuxAlgo++” project in line with Smart Money Concepts (SMC) and Smart Money Traps (SMT).
The SMT block (“Smart Money Traps”) supplements classic smart money concepts with:
1. Detection of bull traps (short setups) and bear traps (long setups)
2. Display of trap boxes in the chart (liquidity grab areas)
3. A bot setup box (table) with ready-made entry/SL/TP levels:
as well as age in bars & days and “Valid until ~X d” (remaining term)
SMT / bot setup only run on the following timeframes:
- H1, H2, H3, H4, H6 This means that traps, labels, and the bot setup box are only displayed on these timeframes
Trap definition “Bull Trap (Short Setup)”:
- Valid swing high
- Swing trend bullish
- High (Wick) pierces above the swing high (Liquidity Grab)
- Close falls back below the swing high (false breakout)
-> Result: Short setup (bull trap), marked in orange
Trap definition “Bear Trap (long setup)”:
- Valid swing low
- Swing trend bearish
- Low (wick) pierces below the swing low (liquidity grab)
- Close rises above the swing low again (false breakout)
-> Result: Long setup (bear trap), marked in blue
Entry / SL / TP calculation
A price range is taken for each trap:
Bull trap (short):
- Range =
- Entry = point within this range:
Entry = hiBT - (hiBT - loBT) * TrapEntryRatio (0..1)
-> 0.0 = at the Wick extreme, 0.5 = middle, 1.0 = at the Swing level
- SL = Wick extreme (upper edge of the trap)
- Risk = |Entry - SL|
- TP1 = Entry - R1 * Risk
- TP2 = Entry - R2 * Risk
Bear Trap (Long):
- Range =
- Entry analogous within the range according to TrapEntryRatio
- SL = wick bottom (lower edge of the trap)
- Risk = |Entry - SL|
- TP1 = Entry + R1 * Risk
- TP2 = Entry + R2 * Risk
R1 / R2 correspond to the inputs:
- botRR1Input = TP1 Risk/Reward (e.g., 1.5R)
- botRR2Input = TP2 Risk/Reward (e.g., 3.0R)
Age & Validity
Each trap stores:
- lastTrapBarIndex -> last bar of the trap
- Age in bars -> bar_index - lastTrapBarIndex
- Age in days (~d) -> AgeBars * BarDurationInDays (depending on TF)
Input: trapMaxAgeBars determines how long a trap is valid.
The bot setup box is only displayed if:
- a trap is present,
- AgeBars <= trapMaxAgeBars,
- SMT + Box + SMC timeframe are active.
Color logic (color blind friendly):
- Blue (accentBlue) = fresh traps (Age <= 1/3 MaxAge)
- Orange (accentOrange) = medium age
- Violet (accentPurple) = old, but still within MaxAge
- Gray (accentGray) = expired (> MaxAge)
The box also shows “Valid until ~X d” as the remaining term.
Day/Night Mode & Colors
- chart.bg_color is used to detect dark or light mode.
- Text/background colors adjust (light/dark).
- Accent colors (blue/orange/purple/gray) are suitable for red/green color blindness.
- Trap labels in the chart:
- Bull trap label = orange (short setup)
- Bear trap label = blue (long setup)
- Text color depends on chart mode (dark/light)
Typical workflow (example):
1. Select a suitable symbol & SMC timeframe (e.g., H4 or H6).
2. Wait for a bull trap (short) or bear trap (long).
3. Read in the bot setup box:
- Direction (long/short)
- Entry, SL, TP1, TP2
- Age & “Valid until ~X d”
4. These values can be used as a template for manual trading or external bot/order systems.
5. Position size & leverage must always be calculated separately in your own risk management
(e.g., 2% rule). This script does not calculate position sizes.

Power Law of Diminishing Returns for BTC:USDTThis is a script to see if the Law of Diminshining Returns is applicable to BTC/USD

MACD Divergences + RSI/ADXMACD Divergences + RSI/ADX Indicator
This indicator combines the classic MACD divergence detection with real-time RSI and ADX monitoring in fixed corner labels.
🔹 MAIN FEATURES:
- Automatic MACD divergence detection (Classic & Hidden)
- Visual RSI and ADX labels fixed in the right corner
- Color-coded trend direction (Green: DI+ > DI- | Red: DI- > DI+)
- Customizable MACD settings (Fast/Slow Length, Signal Smoothing)
- Configurable RSI and ADX periods
- Built-in alerts for all divergence types
🔹 DIVERGENCE TYPES:
- Classic Bullish: Price makes lower lows, MACD makes higher lows (Reversal signal)
- Classic Bearish: Price makes higher highs, MACD makes lower highs (Reversal signal)
- Hidden Bullish: Price makes higher lows, MACD makes lower lows (Continuation signal)
- Hidden Bearish: Price makes lower highs, MACD makes higher highs (Continuation signal)
🔹 RSI & ADX DISPLAY:
- Fixed labels in top-right (RSI) and bottom-right (ADX) corners
- Real-time values updated on every bar
- Background color changes based on directional movement (DI+ vs DI-)
- Large, easy-to-read format
🔹 HOW TO USE:
1. Watch for divergence patterns on MACD histogram
2. Monitor RSI for overbought/oversold conditions
3. Check ADX for trend strength (>25 = strong trend)
4. Green labels = Bullish momentum (DI+ > DI-)
5. Red labels = Bearish momentum (DI- > DI+)
🔹 BEST FOR:
- Swing trading on 4H and Daily timeframes
- Trend-following strategies with mo

EMA12/50 如果放空後趨勢由背景紅轉綠可以考慮常抱
抱到背景再次翻紅而比較不被雜訊洗掉
現階段指標合併在一起會出BUG
If the trend changes from red to green after shorting, consider holding for a longer period.
Hold until the background turns red again to avoid being washed out by noise.
Currently, merging them together will cause bugs.

Multi Hourly ATP (Average Trade Price)"Multi-timeframe average trade price" analysis combines two concepts: using the Average Trade Price (ATP) as a benchmark and applying a multi-timeframe analysis (MTFA) trading strategy. The benefits stem from using the ATP for position management and MTFA for better-informed trading decisions.
Benefits of Averaging the Trade Price
Averaging the trade price (using methods like "averaging down" or "averaging up," or the Volume-Weighted Average Price - VWAP) helps investors manage their positions and costs.
Better Cost Basis Assessment: The ATP provides a clear benchmark for your overall cost per share, including fees. This helps you understand your true breakeven point and accurately assess whether a position is currently profitable or at a loss.
Risk Mitigation: In a falling market, buying more shares at a lower price (averaging down) reduces the average purchase price, which means the stock does not have to recover to its initial price for you to break even or make a profit.
Profit Accumulation: In a rising market, buying more shares as the price increases (averaging up or pyramiding) allows you to accumulate more profits if the upward trend continues, increasing your overall position size in a winning trade.
Emotional Discipline: By following a predefined averaging strategy, traders can reduce the impact of emotional decisions like panic selling or holding onto losing trades for too long.
Managing Volatility: Averaging helps smooth out the impact of short-term price fluctuations on your overall portfolio performance, which is particularly useful in volatile markets.

MRX_M7 777//@version=5
indicator("MRX_M7 777 MTF ALERT (jgar)", overlay=true)
// === SOZLAMALAR ===
tfInput = input.timeframe("15", "Qaysi TF")
showZone = input.bool(true, "Zonani ko‘rsat / o‘chirish")
zoneColor = color.new(color.lime, 75)
// === MTF DATA (BITTA QATORDA!) ===
= request.security(syminfo.tickerid, tfInput, )
// === ENGULF ===
engulf = mtfHigh > mtfHigh and mtfLow < mtfLow
// === ZONA ===
zoneHigh = mtfHigh
zoneLow = mtfLow
// === CHARTGA CHIZISH ===
if engulf and showZone
box.new(bar_index - 1, zoneHigh, bar_index, zoneLow, bgcolor = zoneColor, border_color = color.lime)
label.new(bar_index, zoneHigh, "ENGULF " + tfInput, style = label.style_label_down, textcolor = color.white, bgcolor = color.lime)
// === ALERT ===
alertcondition(engulf, title="MTF ENGULF", message="ENGULF " + tfInput + " timeframe da sodir bo‘ldi")

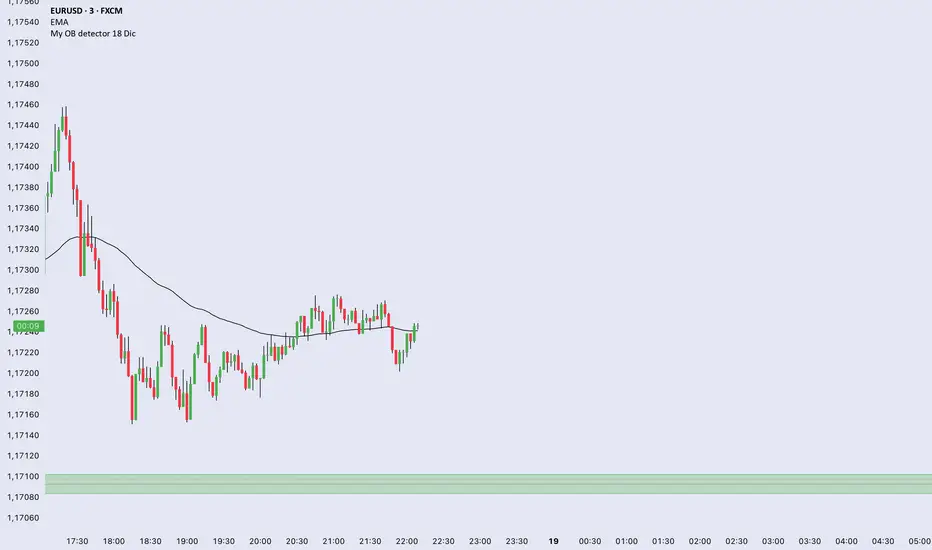
My OB detector 18 DicProfessional Order Block indicator optimized for M3 timeframe. It features automatic 50% entry detection, a strict 1:1 risk-to-reward ratio, and a 10-pip minimum profit filter. Strictly follows the Madrid session hours for Euro and US sessions.
PMax & MOST SynergyIntroduction
This script brings together two of the most powerful trend-following and volatility-based trailing stop-loss indicators in the technical analysis world: Profit Maximizer (PMax) and Moving Stop Loss (MOST). By merging these two tools into a single, optimized script, this indicator aims to reduce chart clutter while providing a comprehensive trend-tracking solution. Both indicators are integrated with their original logic and default parameters, now fully compatible with the latest Pine Script v5 standards.
Development & Technical Logic
The indicator is designed for versatility, allowing traders to monitor dual layers of protection and trend confirmation.
PMax Integration: It utilizes the volatility-adjusted trailing stop-loss logic combined with a variety of selectable Moving Average types (SMA, EMA, VAR, etc.). In this version, the default PMax settings are pre-configured to utilize the Variable Moving Average (VAR) to ensure smoother trend detection with reduced lag.
MOST Integration: The script includes the Moving Stop Loss (MOST) logic, which provides a dynamic exit strategy based on percentage-based trailing stops.
Visual Enhancements: The PMax line has been visually updated to a distinct Blue color for better clarity, and all secondary signals (Support/Resistance lines and highlights) are set to be optional to keep the interface clean and professional.
Conclusion
This combined version is an ideal tool for trend followers who want to benefit from multiple confirmation layers. Whether you are looking for long-term trend stability with PMax or tactical exit/entry signals with MOST, this script provides the flexibility to adjust both independently. It eliminates the need for multiple indicator slots and offers a unified dashboard for trend analysis across various timeframes and assets.
Acknowledgements
I would like to express my sincere gratitude to the original developers who designed these essential tools:
Kivanc Ozbilgic (@KivancOzbilgic): Thank you for your immense contribution to the trading community and for developing the Profit Maximizer (PMax). Your work continues to be a cornerstone for many traders worldwide.
Ceyhun (@ceyhun): A special thanks for designing the Moving Stop Loss (MOST) indicator. Your innovative approach to trailing stops has significantly improved how we manage risk in the markets.

Market Internal Overlay - Skew and Put/Call RatioTracks both the CBOE:SKEW and INDEX:CPC and will highlight when certain thresholds are met.
Blue candle = skew is below 125 (low relative levels of hedging occurring)
Gray candle = skew is above 150 (higher relative levels of hedging occurring)
Red candle = 10 DMA of the put/call ratio is above 1.0 (signaling potential overbought territory)
Green candle = 10 DMA of the put/call ratio is below 0.80 (signaling potential oversold territory)
Purple candle = Both signals are occurring (in either direction)
To view the candle overlay, either switch the price data off, or change the colors to be darker and more transparent.

Borna's Zones NY Borna's Zones marks two important time-based zones on the chart: the 08:00 zone and the 09:00 zone.
The 14:00 zone identifies initial liquidity. This zone sets the range where early market participants create significant activity.
The 15:00 zone serves as a reference for confirmation. After 15:00, the indicator helps you identify whether the 14:00 zone should be considered cleared.
Both zones are automatically extended until 17:00, providing clear visual references for potential market reactions.
No trading is recommended after 17:00, as the early morning zones lose relevance.
This indicator is useful for traders who focus on pre-market and early session liquidity, helping to visualize key levels where price may react.

SIDD EMA RSI Supertrend Signal Table🔥 SIDD EMA RSI SuperTrend Multi-Timeframe Signal Table
**SIDD EMA RSI SuperTrend Signal Table** is a **clean, powerful multi-timeframe trend confirmation dashboard** designed for traders who want **clarity, confluence, and speed** — all in one glance.
This indicator **does NOT repaint** and uses **industry-standard trend logic** combining **EMA structure, RSI momentum, and SuperTrend direction** across **6 different timeframes**.
---
## 🧠 Core Logic Behind the Indicator
This script works on **three independent trend engines**, displayed together in a compact table:
### ✅ 1️⃣ EMA Trend (Structure Based)
* Uses **EMA 50 vs EMA 200**
* **Bullish** → EMA 50 above EMA 200
* **Bearish** → EMA 50 below EMA 200
* Captures **primary market structure**
### ✅ 2️⃣ RSI Trend (Momentum Based)
* RSI Length: **14**
* **Bullish** → RSI > **55**
* **Bearish** → RSI ≤ **55**
* Helps confirm **trend strength & momentum**
### ✅ 3️⃣ SuperTrend (Price Action Based)
* ATR Length: **10**
* Factor: **3.0**
* Clearly defines **trend direction & trailing bias**
* Excellent for **entry & exit alignment**
---
## ⏱️ Multi-Timeframe Coverage
The table analyzes trends across **6 configurable timeframes**:
* Intraday → **5m, 15m, 1H**
* Swing → **4H, Daily**
* Positional → **Weekly**
Each timeframe shows:
* 📈 EMA Trend
* 📊 RSI Trend
* 🔁 SuperTrend Direction
Color-coded for instant readability:
* 🟢 Bullish
* 🔴 Bearish
* ⚪ Neutral
---
## 🎯 How to Use This Indicator
✔ **Trend Trading**
Trade only when **EMA + RSI + SuperTrend align** across higher & lower timeframes.
✔ **Intraday Confirmation**
Use higher TF (1H / 4H) bias and take entries on lower TF.
✔ **Avoid Chop & False Signals**
If signals are mixed → market is likely **sideways or risky**.
✔ **Swing & Positional Trades**
Daily + Weekly alignment gives **high-probability setups**.
---
## ⚙️ Customization Options
* Adjustable **timeframes**
* Table **position** (Top/Bottom – Left/Right)
* Table **size** (Extra Small / Small / Normal)
* Custom **colors, borders & text**
* Optimized for **minimal chart clutter**
---
## ⚠️ Disclaimer
This indicator is a **trend confirmation & decision-support tool**.
Always combine with **price action, support/resistance, and proper risk management**.

All-in-One Momentum Composite The Four Components (and Why They're Chosen)
RSI (Relative Strength Index) – Classic overbought/oversold oscillator (14-period default). Measures speed and change of price movements.
Stochastic (%D line) – Smoothened momentum indicator that compares closing price to the price range over a period. Excellent at spotting reversals in ranging markets.
WaveTrend – Very popular in crypto and forex communities (originally by LazyBear). It’s essentially a momentum oscillator based on overbought/oversold channels, similar to a faster, smoother RSI/Stochastic hybrid. Known for early divergence signals and clean crossovers.
MACD Histogram – Captures momentum changes and trend strength via the difference between fast and slow EMAs. The histogram shows acceleration/deceleration.

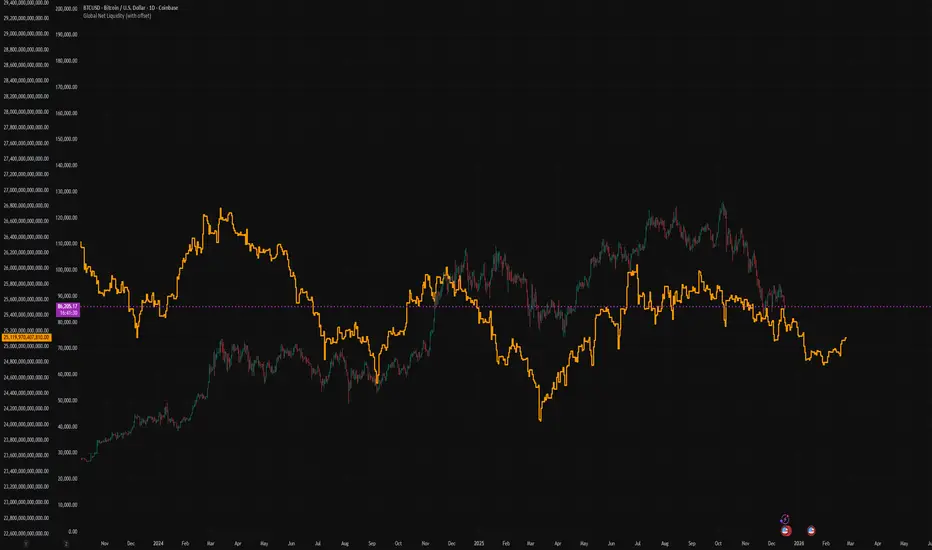
Global Net Liquidity (with offset Trail2Crypto)Click settings and set the offset to 70 days to have the perfect fit.
Varun's StrategyBuy and Sell strategy designed for a 1 minute chart to buy when RSI drops under 25 and sell when RSI exceeds 75

NSE Swing Breadth NSE Swing Breadth – Market Health Dashboard (0–200, % from Neutral)
Overview
NSE Swing Breadth – Market Health Dashboard is a market-wide health and regime indicator designed to track internal strength and participation across Large-, Mid-, and Small-cap indices in the Indian equity market.
Instead of focusing on price alone, this tool measures how strongly each segment is behaving relative to its own swing trend, normalizes those movements, and combines them into a single Market Health score. The result is a clean, objective dashboard that helps traders identify Risk-On, Caution, and Risk-Off regimes.
This indicator is best used for position sizing, exposure control, and timing aggressiveness, rather than individual stock entries.
Data Used
The indicator internally tracks three broad NSE indices:
Large Caps → NIFTY100EQUALWEIGHT
Mid Caps → NIFTYMIDCAP150
Small Caps → NIFTYSMLCAP250
Using equal-weighted and broad indices ensures the signal reflects true market participation, not just index heavyweights.
Core Logic
1. Swing Strength Model
For each index, the script calculates normalized swing strength:
Price is compared to its EMA swing baseline
The deviation from the EMA is normalized using the EMA of absolute deviations
This creates a volatility-adjusted strength value, allowing fair comparison across market regimes
This answers the question:
Is this segment pushing meaningfully above or below its recent trend?
2. Strength Converted to % from Neutral (Baseline = 100)
Each segment’s strength is converted into percentage-style points around a neutral baseline of 100:
100 = Neutral
+15 = +15% strength above neutral
–20 = –20% weakness below neutral
These values are plotted as three smooth lines:
Blue → Large Caps
Orange → Mid Caps
Purple → Small Caps
This makes relative leadership and divergence immediately visible.
3. Market Health Score (0–100)
The indicator combines all three segments into a single Market Health score:
Large Caps → 40% weight
Mid Caps → 35% weight
Small Caps → 25% weight
Extreme values are clamped to avoid distortion, and the final score is normalized to a 0–100 scale:
70–100 → Strong, broad participation
40–69 → Mixed / unstable participation
0–39 → Weak, risk-off conditions
Visual Components
📊 Market Health Histogram
A vertical histogram displays Market Health (0–100) with enhanced visibility:
🟢 Green (≥ 70) → Strong Risk-On regime
🟠 Orange (40–69) → Caution / Transition
🔴 Red (< 40) → Risk-Off regime
The histogram is visually compact and designed to reflect true market health, not exaggerated spikes.
📈 Strength Lines (Baseline = 100)
Three strength lines show % deviation from neutral:
Above 100 → Positive internal strength
Below 100 → Internal weakness
These lines help identify:
Leadership (which segment is driving the market)
Early deterioration (small/mid caps weakening first)
Broad confirmation (all segments rising together)
Dashboard Tables
📌 Market Regime Table (Bottom-Left)
Displays the current market regime:
🟢 RISK ON
🟡 CAUTION
🔴 RISK OFF
Along with the exact Market Health score (0–100).
📌 Strength Table (Top-Right)
Shows Large / Mid / Small cap strength as % from neutral, for example:
+18% → 18% above neutral
–12% → 12% below neutral
This avoids misleading interpretations and keeps values intuitive and actionable.
How to Use This Indicator
Risk-On (Green)
Favor full position sizes, trend-following strategies, and broader participation trades.
Caution (Orange)
Reduce leverage, tighten stops, and be selective. Expect choppiness.
Risk-Off (Red)
Prioritize capital protection, reduce exposure, and avoid aggressive longs.
This indicator is not an entry signal — it is a market environment filter.
⚠️ Important Style Setting (Required)
For correct visualization:
Settings → Style → Uncheck “Labels on price scale”
This prevents the indicator’s internal 0–200 model scale from interfering with the chart’s price scale and keeps the pane clean and readable.
Summary
NSE Swing Breadth – Market Health Dashboard provides a clear, objective view of market internals, helping traders align their risk with the true underlying condition of the market — not just price movement.
It is especially effective for:
Market regime identification
Exposure management
Avoiding false breakouts in weak breadth environments

HydraBot v1.2 publicenglish description english description english description english description english description english description english description english description english description

Timeframe Overlay 24HrDaily High–Low Box (00:00–23:59)
This indicator highlights each trading day with a shaded box spanning from 00:00 to 23:59 (based on the selected timezone) and covering the day’s highest and lowest price.
• Green box when the day closes above its open
• Red box when the day closes below its open
• Historical days are fully drawn for easy comparison
• Current day box builds dynamically as new candles form
Useful for visualising daily range, market bias, and intraday structure across all timeframes.

RMI Valid FVG & IFVGRMI • Valid FVG & iFVG (Smart Money Concept)
RMI • Valid FVG & iFVG is a precision-focused Fair Value Gap indicator designed for traders who follow Smart Money Concepts (SMC) / ICT logic and want to filter out low-quality, random gaps.
This indicator does not plot every FVG.
It highlights only structurally relevant FVGs that form in the direction of the trend and have a high probability of being filled.
Core Features
Bullish & Bearish Fair Value Gaps
Inverse Fair Value Gaps (iFVG)
Trend-aligned FVG filtering
Automatic invalidation after mitigation
Clean background zones for clear visibility
Optimized for intraday trading
Adjustable settings for scalping, intraday & swing trading
Smart Filtering Logic
FVGs are validated using market structure context
Only FVGs that form within the active trend are displayed
Weak or low-probability gaps are ignored
Inverse FVGs appear after strong displacement and rejection
Zones are visually faded once mitigated
This helps reduce chart noise and keeps the focus on high-probability reaction zones.
Best Use Cases
Entry refinement after BOS / CHoCH
Confluence with liquidity grabs
Premium / discount zone trading
Intraday & session-based trading
Works well with ICT, SMC, price action & structure-based strategies
Recommended Timeframes
Scalping: M1 – M5
Intraday (default): M5 – M15
Swing Trading: M15 – H1
(Default settings are optimized for intraday trading.)
Important Notes
This is not a signal indicator
No repainting
No buy/sell arrows
Designed as a decision-support tool, not an automated system
Always combine with proper risk management and confirmation.
RMI • Precision over noise.
Trade structure, not randomness.

MA20 ATR Trend Failure FilterA volatility-adaptive filter designed to identify early trend invalidation.
This indicator combines a 20-period Moving Average (MA20) with Average True Range (ATR) to dynamically define a lower volatility boundary.
When price closes below this boundary, it signals that the current trend is no longer valid and risk is increasing.
Core Concept(核心思想)
MA defines the trend baseline
ATR measures current market volatility
MA − k × ATR forms a dynamic risk threshold
A close below this threshold = trend failure
👉 中文补充:
这不是反转指标,而是趋势失效过滤器,用于避免在趋势已经被破坏后继续持仓或加仓。
How It Works
Calculate MA20 as the trend reference
Calculate ATR(14) as volatility proxy
Build adaptive bands:
Upper Band = MA20 + k × ATR
Lower Band = MA20 − k × ATR
If close < Lower Band, trend is considered failed
The ATR multiplier k automatically adjusts the tolerance based on volatility, avoiding rigid fixed-percentage rules.
Visual Elements
Yellow line: MA20
Green band: MA20 + k × ATR
Red band: MA20 − k × ATR (key risk boundary)
Red triangle + “FAIL” label: Trend failure signal
Optional background shading to highlight risk zones
Typical Use Cases
Trend-following strategies (exit / reduce exposure)
Breakout strategies (filter false continuation)
Risk management overlay (non-intrusive, no repaint)
Combine with HMA, SuperTrend, structure-based entries
👉 中文补充:
非常适合作为**“不该再拿”的客观判断条件**,而不是频繁交易信号。
Why This Indicator
Volatility-adaptive (ATR-based)
No future data, no repaint
Simple logic, strong risk control
Works across stocks, crypto, futures, indices
This tool is designed to answer one question only:
Is the current trend still valid?
Parameters
MA Length (default: 20)
ATR Length (default: 14)
ATR Multiplier k (default: 0.8)
Lower k → stricter risk control
Higher k → more tolerance, fewer false signals SSE:600595
