Bottom

Noro's BottomSensivity v0.4- 4 indicators of a market bottom in 1
- paramater of sensitivity (2 of 4 is recommended)
- SMA as the filter improves result (any pair, any type of an asset, any TF is recommended 25)

Noro's BottomSensivity v0.3Finding of a market bottom. 3 bottom-indicators with parameter of sensivity.

BestBuy 1.0My new bottom-indicator. This is VixFix + Locomotive-pattern, 2 in 1.
For:
TF 1MN, 1W, 1D
any pair
good for bitcoin/usd and any crypto

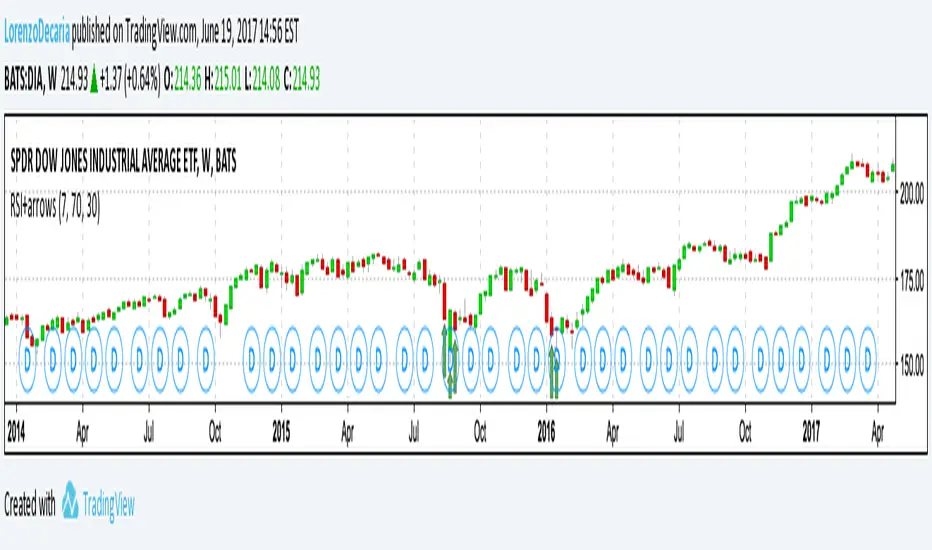
RSI based trend follower
I'm a fan of "less is more". This indicator doesn't mess up your chart with lines, symbols, moving averages or such; it doesn't even add another oscillator in a separate window, letting you focus only on what is most important: price action. It will silently do its job by plotting an arrow (upward arrow for long triggers and downward arrow for short triggers).
It works really great with strong trending markets on higher time frames, so it gives its best on Stocks on a daily/weekly frame; consider it a long term trading indicator.
Double Bottom Chart Pattern with alertDouble bottom is a very common chart pattern, as its name indicates, it consists of two bottoms, and these two bottoms need to be in a relative flat price level. One of the bottom can't be much higher or lower than the other.
This indicator will detect and highlight double bottom pattern automatically on chart and alert you via SMS, email and sound.
Features:
Adjust the threshold between two bottoms.
Adjust the number of bars used to form each bottom.
Check if the first bottom is the highest in a given number of bars
Adjust the number of bars between two bottoms.
Switch of alert.
It works on all timeframes and any symbol.
You can also load more than one with different inputs to get more results on chart.

MagnetSimple Indicator designed by me to check tops and bottoms, also helps to ride the trend, Indicator Tries to Get back at zero.

Tops/BottomsUsing Modified code from Lazybear's CVI 0.17% indicator and some logic, this script can help identify value buy and sell opportunities at a very early phase. Best used as a confirmation tool. This is a beta, so use it as such. Enjoy.
Sometimes "top" indications in an uptrend mean to look for an opportunity to add to position while "bottom" indications during a downtrend can represent the same thing. The trend is your friend, use it to your advantage!
Red star above bar == potential top
Green star below bar == potential bottom

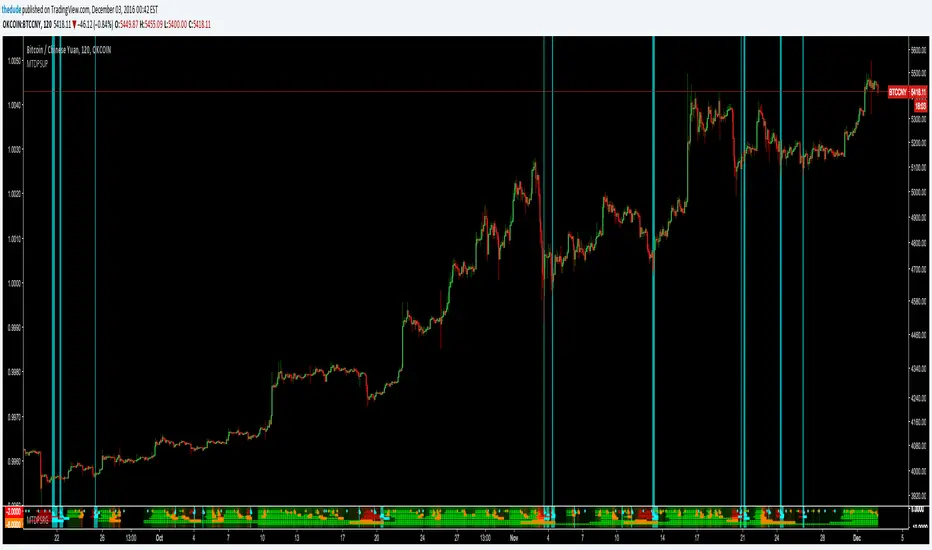
Dudes Multi Time-Frame Pivot System [[Up Only]]Dudes Multi Time-Frame Pivot System [ ]
This is the first public beta of a new "ribbon" type of indicator which shows trend information and pivot candle information for 8 different timeframes, all within a very compact and visually appealing space.
It is extremely useful for pinpointing trend changes or current trend by giving you information from 8 different timeframes on one chart. The idea is if multiple time-frames are in sync with each other, the stronger the signal will be. You can easily set alarms on pivot points to trigger Tradingview to send an email or SMS when an important signal appears on the chart. To trigger the alarm, set the indicator to "Cross Up" on the value 0.5. The value of the variable holding candle data is a binary 0 or 1.
The ribbon strategy is split into 3 different indicators because of the large amount of code required to calculate everything. Please contact me if you are interested in purchasing a subscription to the strategy or want more information. The current subscription price is starting at $50USD on a monthly basis. There will be 2 other shared scripts for the other 2 parts of this indicator; Down and Red/Green. Contact me here on tradingview via PM, or via email thedudeontv@gmail.com if you are interested
MACD Divergence MultiTimeFrame [FantasticFox]This is a MACD divergence on 3 time-frames, 1h, 4h and 1D.
Please insert the indicator into a 1h chart, otherwise change the lengths' inputs.
you will see H1,H2, H3, R1, R2 and R3 in green and maroon colors.
H means hidden divergence, 1 regards to 1h, 2 to 4h, and 3 to 1D. If the color is green, its bullish, and if its maroon the divergence is bearish.
Gray circles on 4h macd is for those traders who want to check the confirmation on Elliott wave changes.
*Thanks to RicardoSantos MACD divergence.

UCS_Top & Bottom CandleThis is an experimental Indicator based on Momentum. Picks the Top & Bottom Candle for most Swing. Please post your opinion or suggestion to improve this indicator.
I have not back tested this completely. This is recently developed Indicator.

Hobble Skirt Bottom Impede Fashion (by ChartArt)A very noisy indicator to detect bottoms and new uptrends.
Original idea by ChartArt.
First published indicator - constructive criticism welcome.
(The indicator is experimental and doesn't work most of the time.)
I would describe it as an "coincident indicator". The signals occur at approximately the same time as the conditions it signifies. Rather than predicting future events it changes at the same time to the upside as possible bottoms show up.
P.S. hobble skirt is a syllable of chart, that is how I came up with the name
"A hobble skirt was a skirt with a narrow enough hem to significantly impede the wearer's stride, and was a short-lived fashion trend around the turn of the twentieth century."
P.P.S. Bottoms are also short-lived...
