Bottom

Rounded Bottom Breakout Strategy Moving Averages20-day SMA , 34-day EMA , 50-day SMA and 200-day SMA moving average indicator based on Rick Saddler's Rounded Bottom Reversal Breakout Strategy

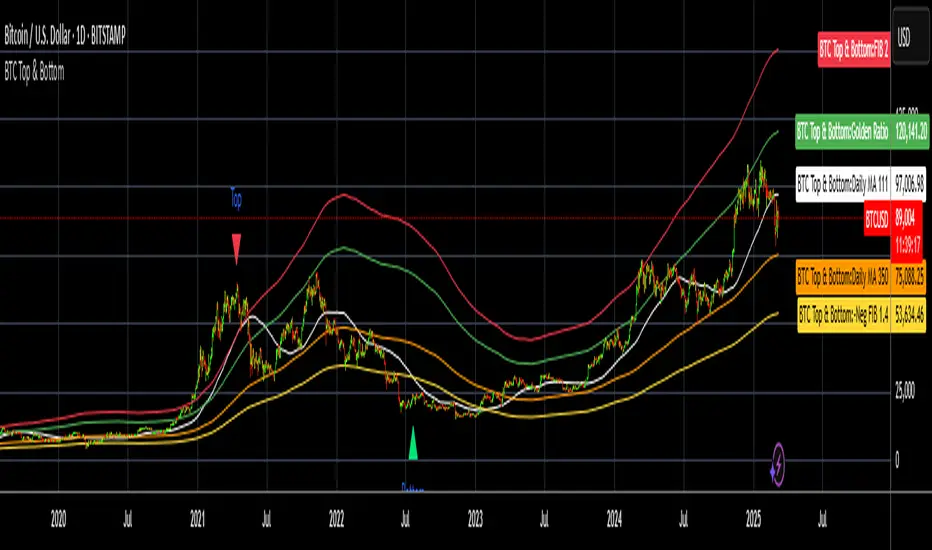
BTC Top and Bottom PickerBTC Top and Bottom Picker
This study predicts BTC tops and bottoms using Bitstamp's daily close data/
It is based on Philip Swift's The Golden Ratio Multiplier post on Medium
In a nutshell:
The top is calculated when 111 daily SMA crossing 350 daily SMA
The bottom is calculated by dividing 350 daily SMA by 1.4
If you like this, please like and share it and follow me.
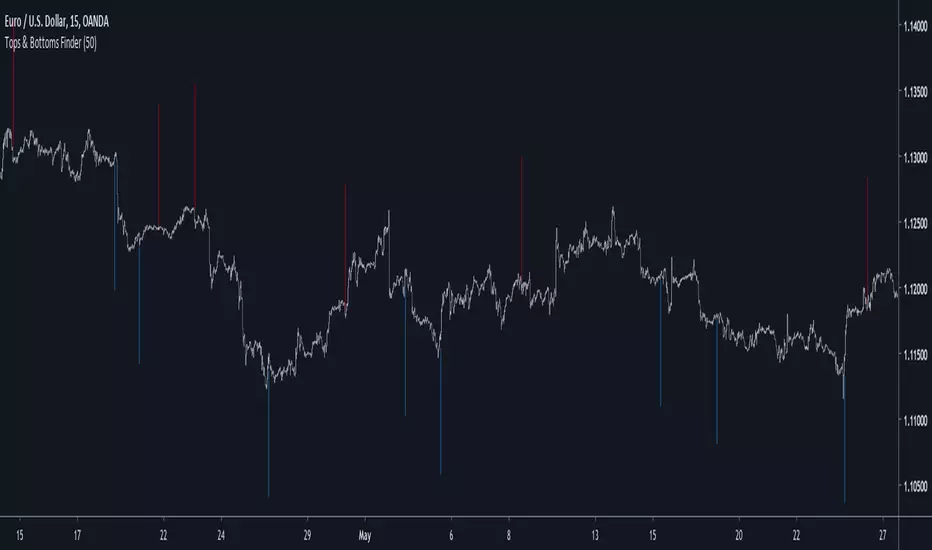
Tops & Bottoms FinderIntroduction
I already shared a method to estimate tops and bottoms (1), the number of parameters could lead to optimization issues so i tried to make a simpler method. In this method i use a simple rescaling method based on individual direction deviation. I will explain further details below.
The Indicator
I use as source for the entire calculation an exponential moving average, the first reaction to this choice would be to think that i wanted to filter signals in order to reduce them, but the truth is that i wanted to have more signals instead, this is because the first calculations involving standard deviations are based on price direction, so by using a smooth input we can get more persistent values in a and b , but its totally up to you to use whatever you want in a , just take into account that less smooth = less signals, this is why i used this calculation process.
a = close and length = 7
a = least squares moving average and length = 25
So you could use pretty much everything you want as input.
Conclusion
The accuracy of such indicators is still relatively low but i presented a way to estimate tops and bottoms without using highest/lowest or differencing thus creating a totally new approach. I encourage you to experiment with it and share your results. If you learned something with this post then i'am happy :)
Notes
Based on several complaints i will have to leave even sooner, i think the 7 of June will be a good day, so if you need something i encourage you to ask me now. With the hope you can understand.
Thanks for reading !
(1)

Double Bottom Pattern IdentifierHello friends,
This script is a powerful, non-repainting detector for the classic Double Bottom pattern — one of the most widely recognized bullish reversal setups. The indicator automatically identifies and tracks developing 'W'-shaped formations in real time, confirming valid entries once the neckline is broken and providing complete trade management features. No manual configuration is needed — it works right out of the box.
🛠 How It Works
It uses advanced techniques involving pivot point analysis and does not rely on other indicators, ensuring robustness and adaptability across different market conditions. When a potential Double Bottom is detected, the indicator marks the pattern points, draws the neckline, and waits for confirmation.
Once confirmed, it generates a 'Long' signal with calculated Take Profit (TP) and Stop Loss (SL) levels.
The script also includes a statistics table summarizing performance metrics — such as the number of patterns, trade results, bar distances, and bottom differences — all dynamically updated on your chart.
🔥 Key Features
Pine Script V6 — optimized logic and performance
Works right out of the box — no setup required
Non-repainting detection
Fully visualized structure — points, neckline, TP, and SL plotted automatically
Multiple TP/SL modes: R/R ratio, ATR-based, percent, points, pips, ticks, or bottom-to-neckline distance
Trailing Stop Loss support
Interactive statistics table with pattern count, trade outcomes, profit ratio, and structural measurements
Smart alert system
Customizable alert messages with placeholders (price, ticker, timeframe, etc.)
Clean, updated UI with improved layout and organization
If you'd like access or have any questions, feel free to reach out to me directly via DM.
👋 Good luck and happy trading!
Script pago

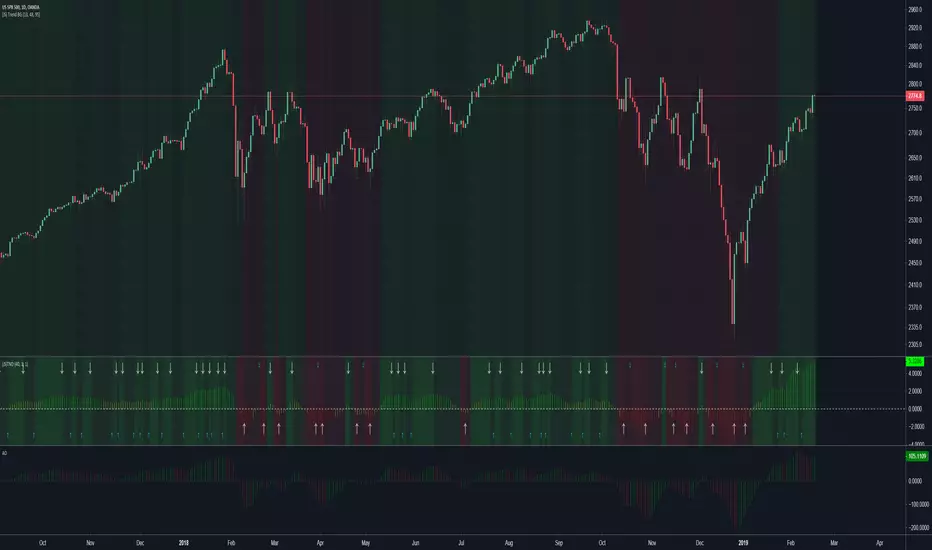
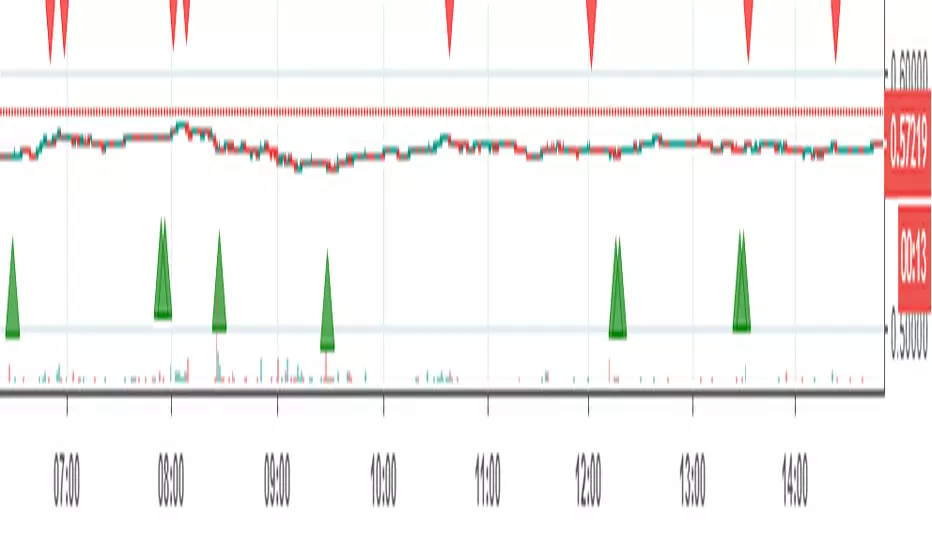
(JS) Tip-and-Dip OscillatorLet me start by saying I know that the name is goofy lol
This is an oscillator that that looks at price action vs. standard deviation in order to illustrate the trend. This thing looks like an Awesome Oscillator but the math behind this and the Awesome Oscillator are totally different (which is pretty interesting, given they look a lot alike). I included the Awesome Oscillator on the chart here so you can look at them and see where they are different.
So the Tip-and Dip Oscillator is meant to help you pinpoint tops and bottoms. I even added arrows where the top and bottom signals are given.
The oscillator itself has 3 colors, an up, down, and neutral color that come as green, red, and yellow. Since the readings given by the oscillator can greatly vary depending on the chart resolution, I included an option to edit the range to fit your chart.
Also - I have 4 different smoothing options that you can use depending on what your preference is. The default setting is the most sensitive so it will identify tops and bottoms more frequently, but it is the most accurate when pinpointing the correct reversal candle. As you smooth it out, the arrows will appear less, but my be slightly delayed and give a later reading. I personally prefer the default, but going up to the second setting in smoothing works nicely as well.
Enjoy!
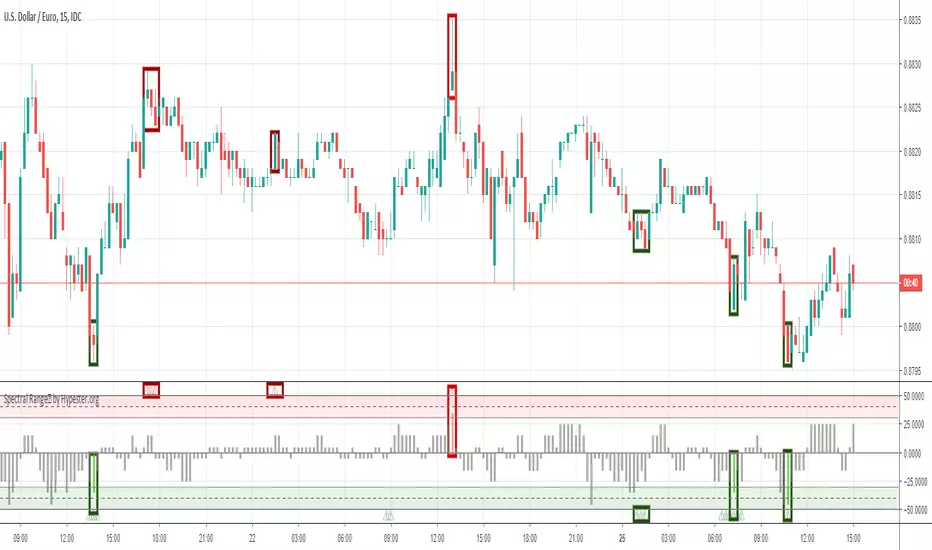
Spectral Range™ by HypesterThe Hypester team strikes again!
Picking tops & bottoms is a real art for any retail trader. It's just like scoring the perfect goal when you get the maximum profit from your trades. It's the difference between an excellent trade and just another trade in your system. It's that last edge you start to seek once you found your profitable strategy.
That's what the Spectral Range™ algorithm does for you - it shows you where all the likely tops/bottoms are . It mixes the famous machine learning Spectro™ technology with cutting edge statistical anomaly detection.
Since all the hard math is done for you, it's deploy and trade. Spectral Range™ will easily tell you when the range of the movement is far out of the normal, healthy and expected movement.
The height of the bar will tell you how aggressive is the anomaly and consequently its correction, plus an extra layer of confirmation with the little warning signs that should be used together for a more conservative approach.
It's really that simple, what are you waiting for?
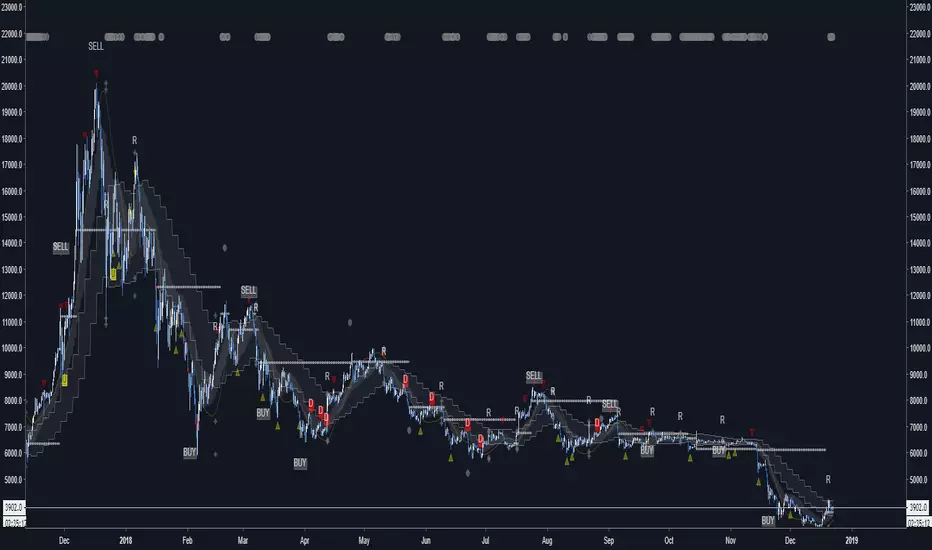
MarketReader[ENG] DARK THEMEMarket Reader is a very sophisticated indicator giving you:
-BUY and SELL Opportunities
-Key supports and resistances where the market will react
-Early detection of RANGE before the contact with the top or the bottom of the range, it will also give you the target of the top and the bottom of the range
-Pattern of smartmoney activities, giving you signal that smart money is moving at this level of price
You will also found my complete strategy on my Youtube Channel
Enjoy
Utilization requires subscription
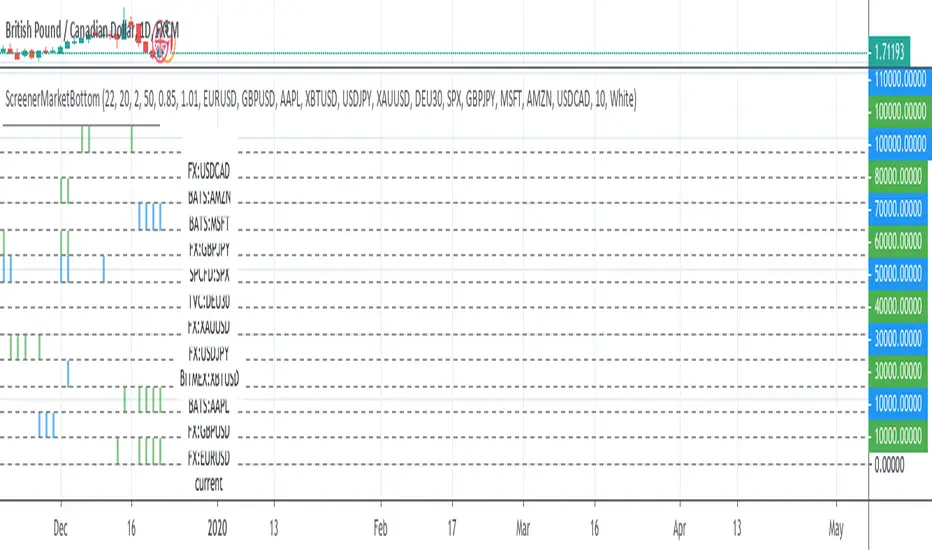
ScreenerMarketBottomThis study works as screener with alerts for ChrisMoody's scritp CM_Williams_Vix_Fix Finds Market Bottoms .
Refers to original study for the code: I converted it in a function and I used my snippets of pine script codes for convert it in a screener.
I'm thinking to transform it in a strategy: if someone has suggestion on startegy logic please let me know. For example enter long after three lime color bars?
Please use comment section for any feedback.
Next improvement (only to whom is interested to this script and follows me): study with alerts on multiple tickers all at one. Leave a comment if you want to have access to study.
Scalp God (top and bottom finder) (SATURN)I am very happy to present the Tradingview community the first of my new line of powerful indicators.
This is the SCALP GOD. It will clearly label market tops and bottoms for you, if you are scalping and looking to open or close a position this indicator will mark the local highs and lows for you. Or if you are a swing trader this can also give good signals as this indicator works on any pair and any timeframe! When you see the chart turning green you know for sure that a market top is forming, if the chart is turning red you know for sure a market bottom is forming. It is sometimes the absolute top or bottom and sometimes just an important local top or bottom. PM me if you find a better top & bottom indicator because I am trying to make this better than everything out there.
It absolutely can not repaint under any circumstances.
There are a few inputs for you to think about here:
-First is the length, this just decides how many previous bars to consider, making it longer will focus on more historical information while making shorter will make it focus on what has recently happened. 12 seems to be a good value, but it's not as important as the next two options.
-Next is the threshold value, setting it very low will mean that signals will get triggered very quickly, while a higher threshold will take more movement to trigger.
-Last and most important is the sensitivity value. A lower value here will make the signals much more sensitive and therefore able to flip and trigger faster. A higher sensitivity value will make the signals less sensitive and harder to flip, meaning that it will only look for movements that agree with the longer term trend. This is great for swing traders and scalpers that go with the trend.
-There is also a smoothening option, this will make it so the signals don't come on and off so much. Sometimes this will not be good for timing, but other times it will be a more certain signal for traders specifically looking for where the top or bottom ends.
It gets better because I added several of these indicators into one script, so if there is a particular set of sensitivities and thresholds that you like you can look at them all on the same chart without opening so many copies of this. To turn on an additional copy just check the "Sensitivity # On" box.
Everyone can try this for free for 3 days and after that it will be 0.025 BTC for lifetime use and this will include all future updates to this project. This is Project Saturn and this is the first indicator from a new series of indicators that will be coming out over the next year.
Hopefully this makes a lot of you rich! I'm very excited to see all of the uses people make with it.
Happy trading & good health!

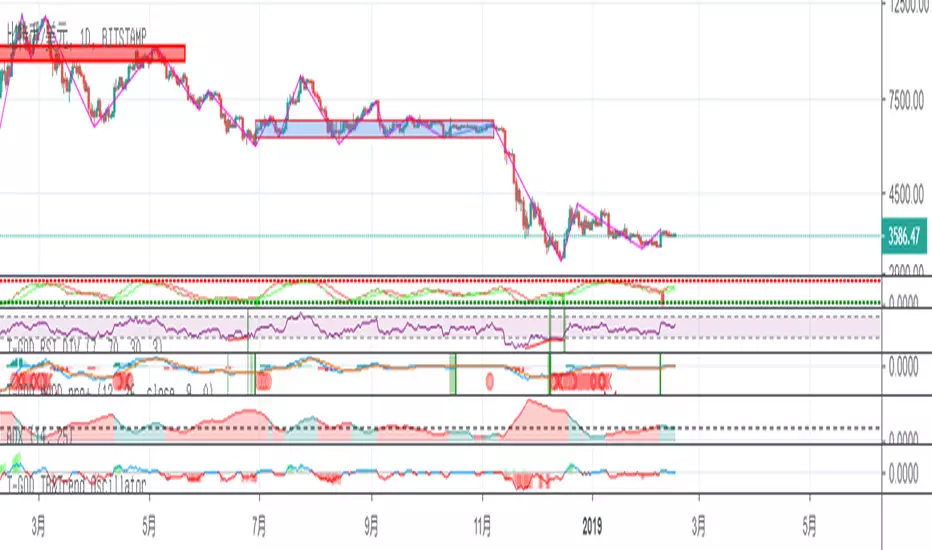
T-GOD TB&Trend OscillatorUsage:
Front side trading: In bumppy market. Use this oscillator to find the top and the bottom of the market. When the hist comes to green, you can find the market bottom by the lowest blue line. When the hist comes to red, the highest red line may help you to find the possible market top.
Back side trading: red line for long trend,blue line for short trend.
For reference only! !
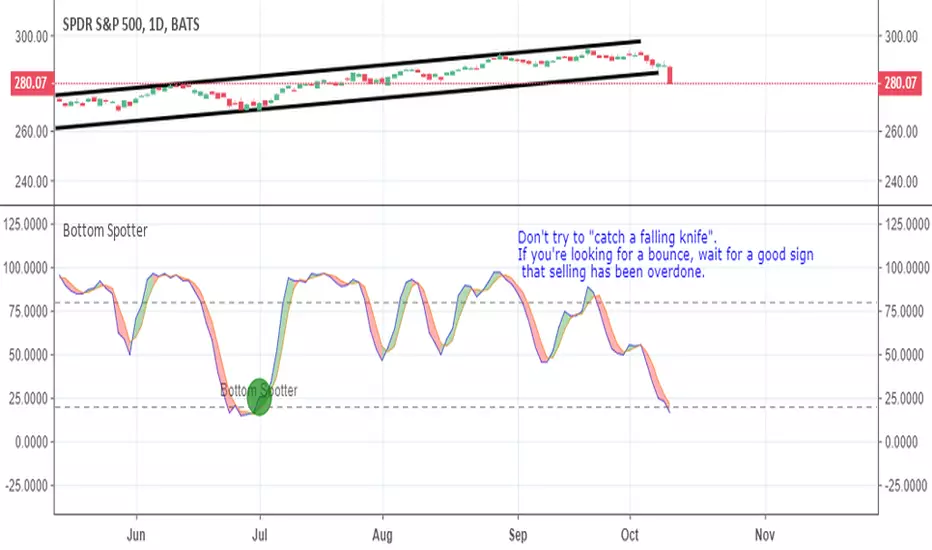
Bottom Spotter by ClefsphereSpots bottoms with a high degree of accuracy and a usually precedes a good bounce.
top&bottomYou can find "Top&Bottom" on chart by this indicator. This is described by TMA theory.
I reccomend using this for scalping trade.
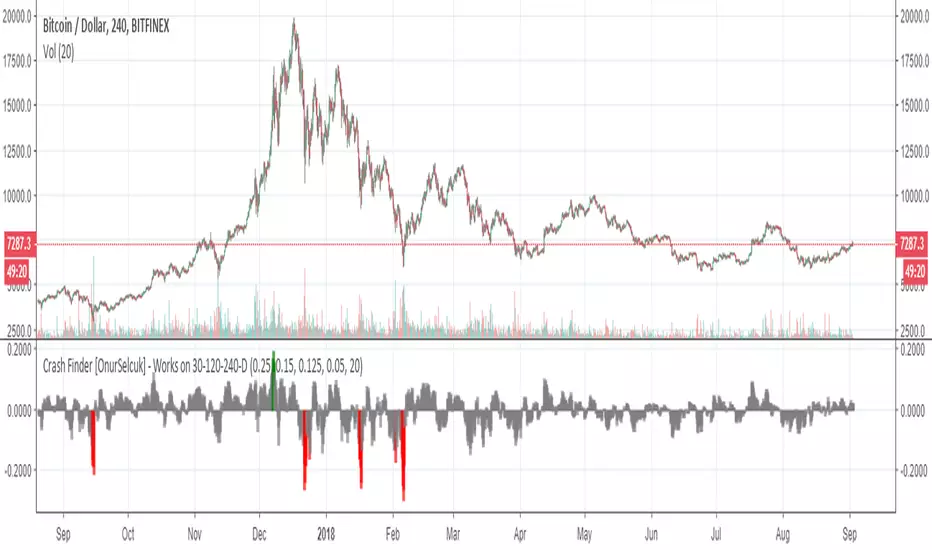
Crash Finder [OnurSelcuk] - Works on 30-120-240-D V.1This indicator helps you to find possible bottoms and tops. Works only 30-120-240-Daily pattern.

Bottom & Top Finder v2.5Bottom & Top Finder are an automated cryptocurrency signals and analysis tool. It uses a complex algorithm involving multiple indicators, trends, divergences and cross-overs - including proprietary formulas developed in-house. It will predict the bottom / top price of cryptocurrencies. It also works well on stocks, gold , oil, and forex!
24 Hour trials are available upon request if you would like more information please pm me!

Bottom Finder 2.2Release 2.2
Bottom Finder is an automated cryptocurrency signals and analysis tool which uses a complex algorithm involving multiple indicators, trends, and cross-overs including proprietary formulas developed in-house to predict the bottom price of cryptocurrencies. It also works well on stocks, gold, oil and forex!
Future updates will be included onto this script.
Tip #1: In a bear market, the Half height (fuchsia colored) signals should be ignored by the risk averse trader. In a bull market feel free to buy on both the signals.
Tip #2: In a bear market, use a smaller percent gain instead of TSSL to set your exit targets. In a bull do the opposite, using TSSL (or method of your choice) to exit.

Bottom finder v6 EURUSDEURUSD version of Bottom Finder. Bottoms found at blue spike alerts. Simple and effective. Message me for trial access.

PorcupineDisplays "spike days" by colouring the bars (Default: yellow for a Spike High and blue for a Spike Low)
Spike Day's definition taken from Jack D Schwager's Book: A Complete Guide to the Futures Market: Technical Analysis, Trading Systems, Fundamental Analysis, Options, Spreads, and Trading Principles
A spike is:
A wide difference between the spike high and the highs of the preceding and succeeding days.
A close near the low of the day's range.
A substantial price advance preceding the spike's formation.
The more extreme each of these conditions, the greater the likelihood that a spike high will prove to be an important relative high or even a major top.
(inverse is true for lows, basically)
Enjoy!


