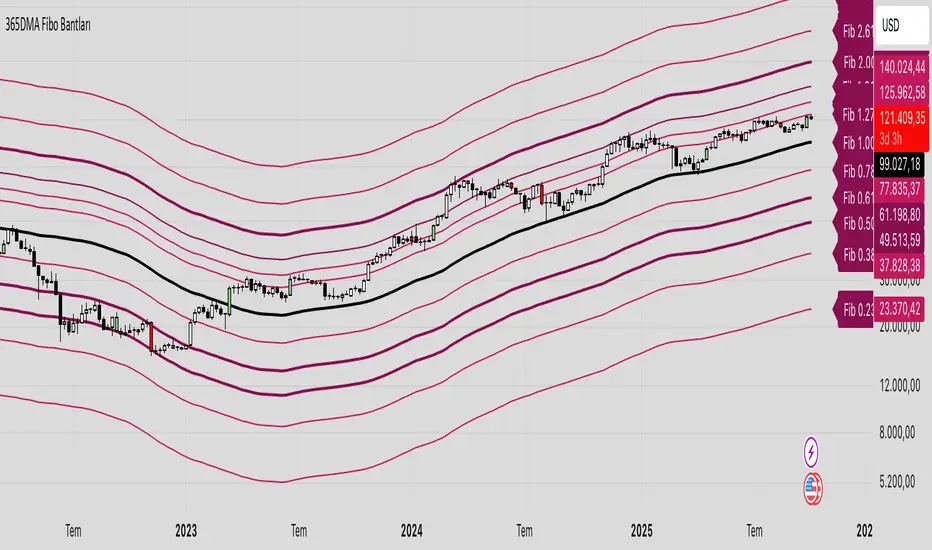
365 DMA Based Multiplier Fibonacci BandsBitcoin Chart
365 DMA Based
Fibonacci 1.0 = Long term trend
Fibonacci 0.5/0.618 = Long term support
Fibonacci 1.618 = Mid term target
Fibonacci 2.618 = Long term target
Bandas e Canais
ajish cci indexthis script is based on cci.this one is working good in index.you can use the indicator for finding the trend change.well working in 1 minite.

Adaptive Nexus LineAdaptive Nexus Line
Overview
The Adaptive Nexus Line is not just another moving average. It's a next-generation, composite indicator designed to provide a comprehensive and visually intuitive baseline for trend analysis and momentum.
At its core, the Adaptive Nexus Line synthesizes a "cluster" of multiple moving averages into a single, cohesive line. This "average of averages" approach reduces market noise and provides a more stable and reliable representation of the trend than a traditional, single MA. The name reflects its core strengths: "Adaptive" for its intelligent Kalman filter smoothing, and "Nexus" because it serves as a central point, bringing together a wide array of moving average types.
________________________________________
Key Features
• Composite Engine: Instead of a single MA, the Adaptive Nexus Line averages a user-defined cluster of MAs (e.g., 20 MAs with lengths from 5 to 105). This significantly smooths out price action and reduces false signals.
• Universal MA Selection: The engine supports a comprehensive suite of moving average types, including SMA, EMA, WMA, HMA, VWMA, RMA, ZLMA, and ZMA.
• Momentum Gradient: The indicator's most unique feature is its visual momentum coloring. The line smoothly transitions from red (bearish momentum) through yellow (neutral/indecision) to green (bullish momentum) based on the real-time ratio of rising vs. falling MAs within the cluster.
• Change-Point Signals: A white dot is plotted at the very start of a color change, and a yellow dot is plotted at the end, providing clear signals of potential shifts in momentum.
• Multi-Timeframe (MTF) Support: View the Adaptive Nexus Line from any timeframe directly on your current chart (e.g., plot the 4H line on a 15m chart) to get a better perspective of the higher-level trend.
• Adaptive Kalman Filter: An optional, switchable Kalman filter is included to provide an additional layer of intelligent, adaptive smoothing to the final output line. Its sensitivity is fully adjustable.
________________________________________
Settings Explained
• Moving Average Settings: Control the core engine. Choose your preferred MA Type, the Number of MAs in the cluster, the Start Length, and the Step between lengths.
• Time Frame: Set the indicator to a higher timeframe for a broader market view. Leave blank to use your chart's current timeframe.
• Kalman Filter Settings: Toggle the Use Kalman Filter on or off. Adjust the Kalman Smoothing Period (higher = smoother) to fine-tune the adaptive smoothing to your preference.

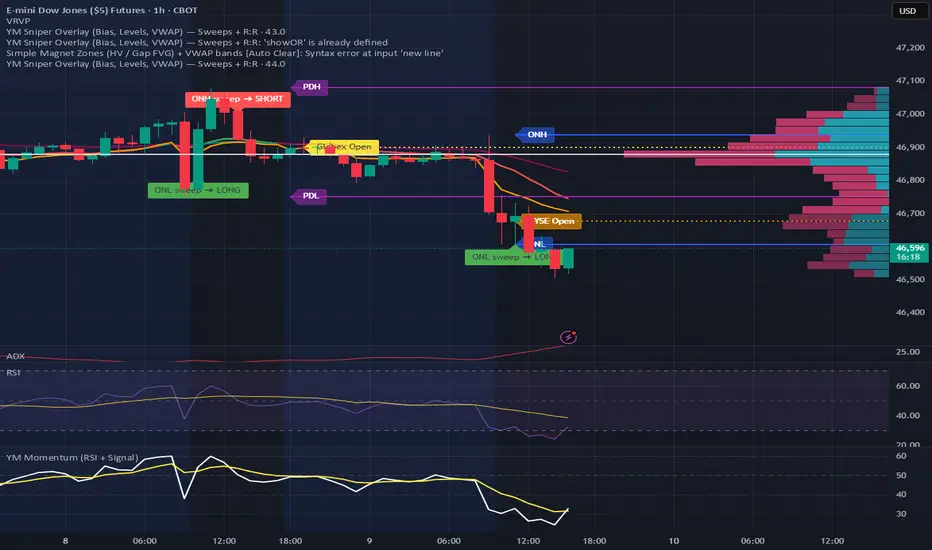
YM Sniper Overlay (Bias, Levels, VWAP) — Sweeps + R:RPDH/PDL/ONH/ONL that notifies you when breaking or retest
BMSB Watchlist Alert - Daily w/ 1% Proximity# Bull Market Support Band - Daily Updates with Proximity Alerts
## Overview
This indicator tracks the Bull Market Support Band (20-week SMA and 21-week EMA) with daily resolution updates and proximity warnings. The weekly moving averages update every day on your chart, giving you more frequent signals than traditional weekly-only scripts.
## What It Does
The script monitors price action relative to the BMSB and generates alerts for:
- Price crossing above or below either the 20W SMA or 21W EMA
- Price coming within 1% of either moving average (early warning system)
This proximity feature is useful for catching potential support/resistance tests before they actually happen, giving you advance notice to prepare for entries or exits.
## Key Features
- Weekly MAs that update daily for more responsive monitoring
- Configurable proximity threshold (default 1%, adjustable from 0.1% to 5%)
- Visual proximity zones shown as dotted lines around each MA
- Color-coded background highlighting (green when above both MAs, red when below both, orange when in proximity zone)
- On-chart labels for crosses and proximity warnings
- Status table showing current position relative to the band
## Setup for Watchlist Alerts
1. Add the indicator to any chart
2. Create alerts using these conditions:
- "BMSB Cross Alert" - fires on actual crosses
- "BMSB Proximity Alert" - fires when entering the 1% zone
3. Set interval to 1 day (recommended) or 4 hour for more frequent checks
4. Use "Once Per Bar Close" for the trigger option
5. Apply the same alert to your entire watchlist
## Settings
You can toggle on/off:
- Cross above alerts
- Cross below alerts
- Proximity alerts
- Proximity percentage adjustment
- Visual elements (labels, MA lines, proximity zones)
## Notes
The BMSB is commonly used in crypto markets to identify bull market pullback support levels. This implementation adds the proximity warning system to help you anticipate potential tests of these key levels rather than waiting for confirmed crosses.
Works on any timeframe but designed for daily monitoring of weekly moving averages.

Arithmetic Candles with Pivot Trend Signals📘 Script Description
🕯️ Arithmetic Candles
Instead of using traditional candlesticks, this script calculates:
Arithmetic Open = Average of open and close
Arithmetic Close = Average of high and low
This candle provides a smoother, more averaged-out representation of price action.
Benefit: Filters out noise and reveals a more "true" price midpoint per candle.
🧭 Pivot Point Levels (Classic)
Classic pivot levels are calculated using the previous day's values:
Pivot (P) = (High + Low + Close) / 3
R1 / S1: First resistance/support levels
R2 / S2: Extended resistance/support levels
These lines mark key price levels that often act as support or resistance.
📈 Trend Signals
The script generates trend signals when a selected price source crosses above or below the pivot:
Bullish Signal (green arrow): When price crosses above the pivot
Bearish Signal (red arrow): When price crosses below the pivot
You can choose the signal source:
Either the regular close price
Or the Arithmetic Candle midpoint: (arithOpen + arithClose) / 2
🎨 Visual Representation
Candles are colored green when arithClose > arithOpen, otherwise red
Pivot lines are drawn if enabled
Triangles mark trend change signals (bullish or bearish)
✅ Use Case
In sideways markets, Arithmetic Candles help filter out noise
Pivot Levels provide clear price zones for potential breakouts or reversals

Bull Market Support Band Alert (20W SMA & 21W EMA) - Multi-Alert═══════════════════════════════════════════════════════════════════
🎯 WHAT THIS INDICATOR DOES:
═══════════════════════════════════════════════════════════════════
This indicator monitors the Bull Market Support Band (BMSB) - a popular trend-following system that uses the 20-week Simple Moving Average (SMA) and 21-week Exponential Moving Average (EMA) to identify major market trends. It alerts you when price crosses either moving average on any stock in your watchlist.
═══════════════════════════════════════════════════════════════════
📈 THE BULL MARKET SUPPORT BAND STRATEGY:
═══════════════════════════════════════════════════════════════════
- ABOVE both MAs = Bullish trend (consider holding/buying)
- BELOW both MAs = Bearish trend (consider caution/selling)
- CROSSING ABOVE = Potential trend change to bullish
- CROSSING BELOW = Potential trend change to bearish
Originally popularized by cryptocurrency analysts, the BMSB has proven effective across all markets for identifying major trend changes.
═══════════════════════════════════════════════════════════════════
⚡ KEY FEATURES:
═══════════════════════════════════════════════════════════════════
✅ Single alert monitors your ENTIRE watchlist
✅ Works on ANY timeframe (daily, 4H, 1H) while maintaining weekly MA accuracy
✅ Visual signals when crosses occur (green/red arrows)
✅ Real-time status table showing current values
✅ Background coloring for quick trend identification
✅ Customizable alert settings for crosses above/below
═══════════════════════════════════════════════════════════════════
🔔 HOW TO SET UP ALERTS:
═══════════════════════════════════════════════════════════════════
1. Add this indicator to your chart
2. Click Alert (alarm icon)
3. Select "BMSB Watchlist Alert" → "BMSB Cross Alert"
4. Choose your alert frequency:
• "Once Per Bar" = Immediate alerts (for active traders)
• "Once Per Bar Close" = Confirmed signals (fewer false alarms)
5. CHECK "Apply to all symbols in watchlist" ← IMPORTANT!
6. Select your watchlist and create
═══════════════════════════════════════════════════════════════════
⚙️ RECOMMENDED SETTINGS:
═══════════════════════════════════════════════════════════════════
📍 FOR SWING TRADERS:
- Chart: Daily timeframe
- Alert Trigger: Once Per Bar Close
- Both crosses enabled
📍 FOR ACTIVE TRADERS:
- Chart: 4H or Daily timeframe
- Alert Trigger: Once Per Bar
- Both crosses enabled
📍 FOR LONG-TERM INVESTORS:
- Chart: Weekly timeframe
- Alert Trigger: Once Per Bar Close
- Focus on crosses above
═══════════════════════════════════════════════════════════════════
📊 VISUAL ELEMENTS:
═══════════════════════════════════════════════════════════════════
- BLUE LINE = 20-week Simple Moving Average
- RED LINE = 21-week Exponential Moving Average
- GREEN ARROWS = Price crossed above BMSB
- RED ARROWS = Price crossed below BMSB
- GREEN BACKGROUND = Price above both MAs (bullish)
- RED BACKGROUND = Price below both MAs (bearish)
- STATUS TABLE = Current price position and MA values
═══════════════════════════════════════════════════════════════════
💡 PRO TIPS:
═══════════════════════════════════════════════════════════════════
1. The indicator calculates WEEKLY MAs regardless of your chart timeframe
2. Best used with liquid stocks/cryptos with good volume
3. Consider waiting for daily/weekly close for confirmation
4. Crosses are more significant after extended periods above/below
5. Works great with additional confirmation (volume, RSI, etc.)
═══════════════════════════════════════════════════════════════════
⚠️ IMPORTANT NOTES:
═══════════════════════════════════════════════════════════════════
- FREE accounts limited to 1 active alert
- Alerts check based on YOUR selected timeframe, not the weekly MA calculation
- False signals possible during ranging/choppy markets
- Not financial advice - use as one tool among many
═══════════════════════════════════════════════════════════════════
👨💻 AUTHOR'S NOTE:
═══════════════════════════════════════════════════════════════════
Built for traders who want to monitor multiple stocks efficiently without creating dozens of individual alerts. Perfect for identifying major trend changes across your entire portfolio with a single alert.
Tags: #BMSB #BullMarketSupportBand #20WeekSMA #21WeekEMA #TrendFollowing #MovingAverage #WatchlistAlert #MultiTimeframe #SwingTrading #TrendTrading

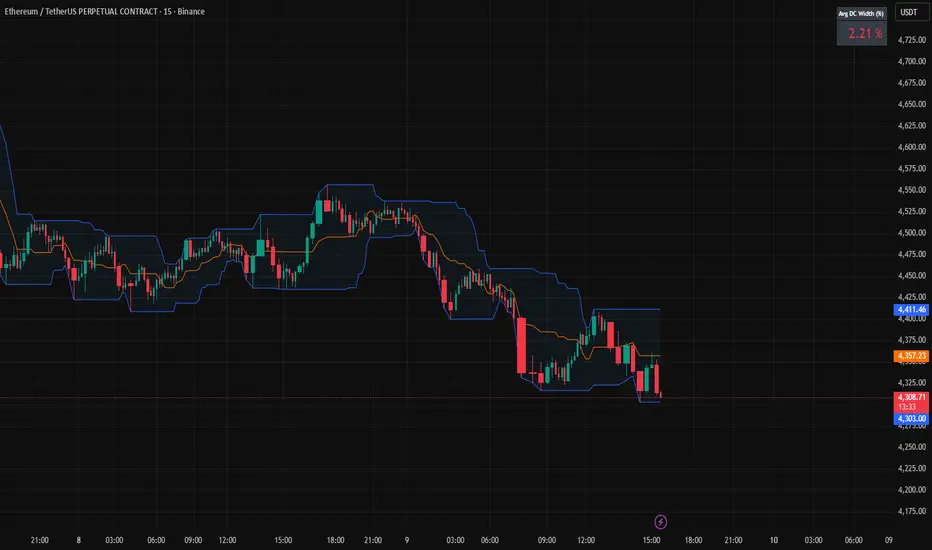
Donchian Channels + Avg Width % DashboardMeasures the average percentage width between the Donchian Channel’s upper and lower bands over a chosen period.
It quantifies how much the market has been moving relative to price — a direct gauge of realized volatility.
When the average width is small, price is range-bound and unlikely to reach fixed TP targets; when it expands, volatility is sufficient for trend or breakout trades.
Based on how fast your strategy is, set your TP% below the average percentage of the Band Width.
Session Breakout Detector (SBD)Overview:
The Session Breakout Detector (SBD) is a TradingView indicator designed to identify and visualize breakouts from major trading sessions. It tracks a selected session (Tokyo, London, or New York) and detects price movements beyond the session's high or low, assisting traders in spotting potential breakout opportunities.
Key Features:
- Session Selection: Choose between Tokyo, London, or New York sessions.
- Breakout Detection Modes:
- Confirmed Bar: Detects breakouts when a candle closes beyond the session's range.
- Intrabar: Detects breakouts as soon as the price exceeds the session's high or low within a
candle.
- Visual Indicators:
- Displays session high, low, and range with a colored box for clear visualization.
- Marks breakouts with green (bullish) or red (bearish) triangles.
- Optional 50-Period SMA: Adds a 50-period Simple Moving Average to the chart for trend
analysis.
- Alerts: Configurable alerts for bullish and bearish breakouts.
Usage Instructions:
1. Select Session: Choose the desired trading session (Tokyo, London, or New York) from the
input settings.
2. Choose Breakout Detection Mode: Select between 'By confirmed bar' or 'By intrabars' based
on your trading preference.
3. Enable SMA (Optional): Toggle the 'Use SMA?' option to display the 50-period Simple Moving
Average.
4. Set Alerts: Configure alerts for breakout signals as per your trading strategy.
⚠️Note: This indicator is intended for informational purposes only and should not be construed as financial advice. Users are encouraged to conduct their own research and consider their individual risk tolerance before making trading decisions.

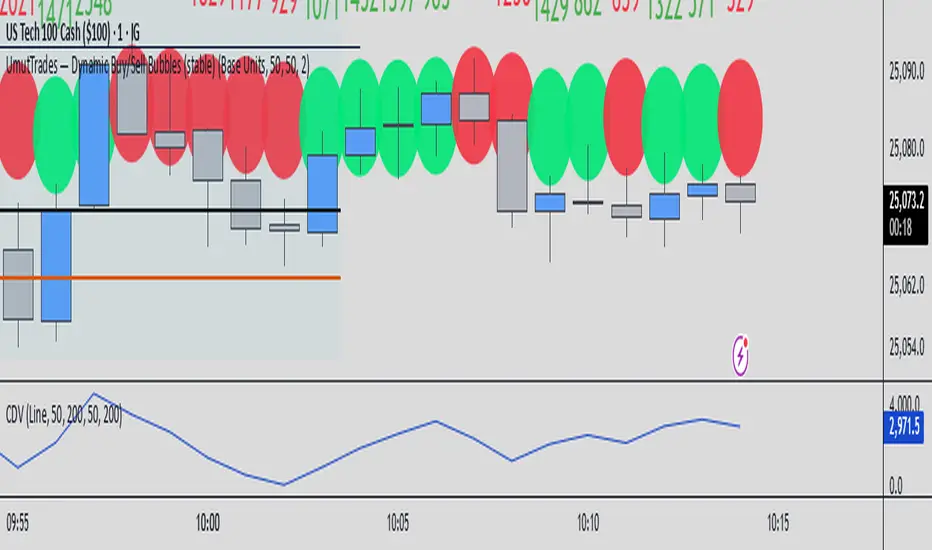
UmutTrades — Dynamic Buy/Sell Bubbles (stable)This indicator detects large buy and sell transactions based on user-defined thresholds (either in base units or quote value).
It places colored bubbles on the chart where those big orders occur green for buys and red for sells with the bubble’s color intensity and size reflecting how large the order is relative to your threshold.
TMA Bands with AlertsTMA Bands with Alerts uses bands to indicate the up and downtrend with alerts to show potential reversals. POAYEE


LA - MACD EMA BandsOverview of the "LA - MACD EMA Bands" Indicator
For Better view, use this indicator along with "LA - EMA Bands with MTF Dashboard"
The "LA - MACD EMA Bands" is a custom technical indicator written in Pine Script v6 for TradingView. It builds on the traditional Moving Average Convergence Divergence (MACD) oscillator by incorporating additional smoothing via Exponential Moving Averages (EMAs) and Bollinger Bands (BB) applied directly to the MACD line. This creates a multi-layered momentum and volatility tool displayed in a separate pane below the price chart (not overlaid on the price itself).
The indicator allows for customization, such as selecting a different timeframe (for multi-timeframe analysis) and adjusting period lengths. It fetches data from the specified timeframe using request.security with lookahead enabled to avoid repainting issues. The core idea is to provide insights into momentum trends, crossovers, and volatility expansions/contractions in the MACD's behavior, making it suitable for identifying potential trend reversals, continuations, or ranging markets.
Unlike a standard MACD, which focuses primarily on momentum via a single line, signal line, and histogram, this version emphasizes longer-term smoothing and volatility boundaries. It uses visual fills between lines to highlight bullish/bearish conditions, aiding quick interpretation. Below, I'll break down each component, its calculation, visual representation, and practical uses.
Detailed Breakdown of Each Component and Its Uses
MACD Line (Blue Line, Labeled 'MACD Line')
Calculation: This is the core MACD value, computed as the difference between a fast EMA (default length 12) and a slow EMA (default length 144) of the input source (default: close price). The EMAs are calculated on data from the selected timeframe.
Visuals: Plotted as a solid blue line.
Uses:
Measures momentum: When above zero, it indicates bullish momentum (prices rising faster in the short term); below zero, bearish momentum.
Trend identification: Rising MACD suggests strengthening uptrends; falling suggests downtrends.
Divergence spotting: Compare with price action—e.g., if price makes higher highs but MACD makes lower highs, it signals potential bearish reversal (and vice versa for bullish divergence).
In trading: Often used for entry/exit signals when crossing the zero line or other lines in the indicator.
MACD EMA (Red Line, Labeled 'MACD EMA')
Calculation: A 12-period EMA applied to the MACD Line itself.
Visuals: Plotted as a solid red line.
Uses:
Acts as a signal line for the MACD, smoothing out short-term noise.
Crossover signals: When the MACD Line crosses above the MACD EMA, it can signal a bullish buy opportunity; crossing below suggests a bearish sell.
Trend confirmation: Helps filter false signals in choppy markets by requiring confirmation from this slower-moving average.
In trading: Useful for momentum-based strategies, like entering trades on crossovers in alignment with the overall trend.
Fill Between MACD Line and MACD EMA (Green/Red Shaded Area, Titled 'MACD Fill')
Calculation: The area between the MACD Line and MACD EMA is filled with color based on their relative positions.
Color Logic: Green (with 57% transparency) if MACD Line > MACD EMA (bullish); red if MACD Line < MACD EMA (bearish).
Visuals: Semi-transparent fill for easy visibility without overwhelming the lines.
Uses:
Quick visual cue for momentum shifts: Green areas highlight bullish phases; red for bearish.
Enhances readability: Makes crossovers more apparent at a glance, especially in fast-moving markets.
In trading: Can be used to time entries/exits or as a filter (e.g., only take long trades in green zones).
Bollinger Bands on MACD (BB Upper: Black Dotted, BB Basis: Maroon Dotted, BB Lower: Black Dotted)
Calculation: Bollinger Bands applied to the MACD Line.
BB Basis: 144-period EMA of the MACD Line.
BB Standard Deviation: 144-period stdev of the MACD Line.
BB Upper: BB Basis + (2.0 * BB Stdev)
BB Lower: BB Basis - (2.0 * BB Stdev)
Visuals: Upper and lower bands as black dotted lines; basis as maroon dotted
Uses:
Volatility measurement: Bands expand during high momentum volatility (strong trends) and contract during low volatility (ranging or consolidation).
Mean reversion: When MACD Line touches or exceeds the upper band, it may signal overbought conditions (potential sell); lower band for oversold (potential buy).
Squeeze detection: Narrow bands (squeeze) often precede big moves—watch for breakouts.
In trading: Combines momentum with volatility; e.g., a MACD Line breakout above the upper band could confirm a strong uptrend.
BB Basis EMA (Green Line, Labeled 'BB Basis EMA')
Calculation: A 72-period EMA applied to the BB Basis (which is already a 144-period EMA of the MACD Line).
Visuals: Solid green line.
Uses:
Further smoothing: Provides a longer-term view of the MACD's average behavior, reducing noise from the BB Basis.
Trend direction: Acts as a baseline for the BB system—above it suggests bullish bias in momentum volatility; below, bearish.
Crossover with BB Basis: Can signal shifts in volatility trends (e.g., BB Basis crossing above BB Basis EMA indicates increasing bullish volatility).
In trading: Useful for confirming longer-term trends or as a filter for BB-based signals.
Fill Between BB Basis and BB Basis EMA (Gray Shaded Area, Titled 'BB Basis Fill')
Calculation: The area between BB Basis and BB Basis EMA is filled.
Color Logic: Currently set to a constant semi-transparent gray regardless of position.
Visuals: Semi-transparent gray fill.
Uses:
Highlights divergence: Shows when the shorter-term BB Basis deviates from its longer-term EMA, indicating potential volatility shifts.
Visual aid for crossovers: Makes it easier to spot when BB Basis crosses its EMA.
In trading: Could be used to identify overextensions in volatility (e.g., wide gray areas might signal impending mean reversion).
Zero Line (Black Horizontal Line)
Calculation: A simple horizontal line at y=0.
Visuals: Solid black line.
Uses:
Reference point: Divides bullish (above) from bearish (below) territory for all MACD-related lines.
In trading: Crossovers of the zero line by the MACD Line or BB Basis can signal major trend changes.
How It Differs from a Normal MACD
A standard MACD (e.g., the built-in TradingView MACD with defaults 12/26/9) consists of:
MACD Line: EMA(12) - EMA(26).
Signal Line: EMA(MACD Line, 9).
Histogram: MACD Line - Signal Line (bars showing convergence/divergence).
Key differences in "LA - MACD EMA Bands":
Periods: Uses a much longer slow EMA (144 vs. 26), making it more sensitive to long-term trends but less reactive to short-term price action. The MACD EMA is 12 periods (vs. 9), further emphasizing smoothing.
No Histogram: Replaces the histogram with fills and bands for visual emphasis on crossovers and volatility.
Added Bollinger Bands: Applies BB directly to the MACD Line (with a long 144-period basis), introducing volatility analysis absent in standard MACD. This helps detect "squeezes" or expansions in momentum.
Additional EMA Layer: The BB Basis EMA (72-period) adds a secondary smoothing level to the BB system, providing a hierarchical view of momentum (short-term MACD → mid-term BB → long-term EMA).
Multi-Timeframe Support: Built-in option for higher timeframes, unlike basic MACD.
Focus: Standard MACD is purely momentum-focused; this version integrates volatility (via BB) and multi-layer smoothing, making it better for trend-following in volatile markets but potentially overwhelming for beginners.
Overall, this indicator transforms the MACD from a simple oscillator into a comprehensive momentum-volatility hybrid, reducing false signals in trending markets but introducing lag.
Overall Pros and Cons
Pros:
Enhanced Visualization: Fills and bands make trends, crossovers, and volatility easier to spot without needing multiple indicators.
Reduced Noise: Longer periods (144, 72) smooth out whipsaws, ideal for swing or position trading in trending assets like stocks or forex.
Volatility Integration: BB adds a dimension not in standard MACD, helping identify breakouts or consolidations.
Customizable: Inputs for timeframes and lengths allow adaptation to different assets/timeframes.
Multi-Layered Insights: Combines short-term signals (MACD crossovers) with long-term confirmation (BB EMA), improving signal reliability.
Cons:
Lagging Nature: Long periods (e.g., 144) delay signals, missing early entries in fast markets or leading to late exits.
Complexity: Multiple lines and fills can clutter the pane, requiring experience to interpret; beginners might misread it.
Potential Overfitting: Custom periods (12/144/12/144/72) may work well on historical data but underperform in live trading without backtesting.
No Built-in Alerts/Signals: Relies on visual interpretation; users must manually set alerts for crossovers.
Resource Intensive: On lower timeframes or with lookahead, it might slow chart loading on Trading View.
This indicator shines in strategies combining momentum and volatility, like trend-following with BB squeezes, but test it on your assets (e.g., via backtesting) to ensure it fits your style.
For Better view, use this indicator along with "LA - EMA Bands with MTF Dashboard"

LA - EMA Bands with MTF DashboardDetailed Explanation of the LA - EMA Bands with MTF Dashboard Indicator
This custom Pine Script v6 indicator, designed for Trading View, overlays EMA-based price channels on the chart while incorporating a multi-timeframe (MTF) dashboard for broader market context. It focuses on visualizing trend direction and momentum through three sets of EMA bands, each representing different time horizons, and extends this with a tabular dashboard that summarizes signals across user-selected timeframes. The bands help identify support, resistance, and trend shifts, while the dashboard provides at-a-glance alignment across multiple periods, aiding in confirming trades or spotting divergences. Unlike volatility-based channels (e.g., Bollinger or Keltner), it relies solely on EMAs for simplicity and lag-reduced responsiveness.
Inputs Section
The script begins with user-configurable options grouped for ease. A timeframe input allows specifying a resolution for the EMA bands' data fetching, defaulting to the chart's timeframe if left empty—this enables higher-timeframe overlays on lower charts for context.
Next, a shared source input defines the price data for all midlines, defaulting to the midpoint of high and low (hl2) but customizable to close, open, or others.
The EMA bands have dedicated toggles and length inputs for each of the three sets: the first (long-term) defaults to 144 periods, the second (medium-term) to 72, and the third (short-term) to 12. These are inlined for compact settings panels, with minimum lengths of 1 to prevent errors.
A boolean toggle controls the visibility of the MTF dashboard. Following this are nine pairs of inputs for dashboard timeframes: each pair includes a show/hide toggle and an editable timeframe string (e.g., '1' for 1-minute, 'D' for daily). Defaults progress from short (1, 3, 5 minutes) to longer (15, 30, 60 minutes, daily, weekly, monthly), grouped in inlines for organization. Only enabled and non-empty timeframes appear in the dashboard.
Helpers Section
Two utility functions are defined here. The first computes an EMA on any source series over a specified length using Trading View's built-in function, reused throughout for midlines and bands.
The second function generates a signal string ("B" for buy/bullish, "S" for sell/bearish, or "-" for neutral) based on the direction of an EMA applied to high prices. It compares the current EMA value to the previous one, mirroring the band fill logic for consistency in the dashboard.
Core Components per Band Set:
Midline: An EMA calculated on a user-selectable source price (default: hl2, which is the midpoint between high and low prices). This acts as the central trend line.
Upper Band: An EMA applied directly to the high prices of each bar.
Lower Band: An EMA applied to the low prices of each bar.
These form a channel that captures the smoothed range of price action, highlighting potential support (lower band), resistance (upper band), and overall trend direction (midline).
Multiple Band Sets: The indicator includes three independent EMA band sets, each with its own length parameter for customization:
EMA1 (default length: 144) – Focuses on long-term trends.
EMA2 (default length: 72) – Targets medium-term trends.
EMA3 (default length: 12) – Emphasizes short-term momentum.
Each set can be toggled on or off via input checkboxes, allowing users to reduce chart clutter if needed.
Visual Elements:
Midline Plot: Displayed as a line colored based on its direction compared to the previous bar: green for rising (bullish), red for falling (bearish), and black for neutral (flat).
Band Fill: The area between the upper and lower bands is filled with a semi-transparent color indicating the trend of the upper band: light green for rising (suggesting expanding highs/upward momentum) and light pink for falling (contracting highs/downward pressure). The bands themselves are plotted in blue with a thin linewidth.
Multi-Timeframe Support: Users can input a custom timeframe (e.g., 'D' for daily), and the indicator fetches data from that resolution. This enables higher-timeframe context on lower-timeframe charts, such as viewing daily EMA bands on a 1-hour chart.
Calculation Mechanics:
All EMAs are computed using Trading View's built-in ta.ema() function.
Data is retrieved in a single request.security() call for efficiency, with lookahead enabled to avoid repainting.
No multipliers or volatility adjustments are included, making it a simple EMA-based envelope rather than a true volatility channel.
In practice, this indicator helps traders identify trend strength, potential breakouts (price crossing bands), or mean-reversion opportunities (price bouncing within bands). It's particularly useful for swing or position trading where multi-period alignment (e.g., all midlines green) signals conviction.
Pros
Multi-Period Insight: By combining short (12), medium (72), and long (144) periods, it offers a layered view of trends across time horizons, helping confirm alignments or divergences without needing multiple separate indicators.
Visual Clarity: Color-coded trends and fills make it easy to spot bullish/bearish shifts at a glance, reducing analysis time.
Flexibility: Custom timeframe input allows for multi-timeframe analysis, while shared source and toggles provide user control.
Simplicity and Efficiency: Purely EMA-based, it's computationally light and avoids overcomplication, making it accessible for beginners while still useful for spotting channel-based setups like squeezes or expansions.
No Repainting: With lookahead, plots are stable once bars close.
Cons
Lagging Nature: EMAs inherently lag price action, especially longer ones like 144-period, which may cause delayed signals in fast-moving or ranging markets.
Lack of Volatility Adjustment: Unlike Keltner Channels or Bollinger Bands, it doesn't incorporate ATR or standard deviation, so bands may not accurately reflect true volatility—potentially leading to false breakouts in high-volatility environments.
Chart Clutter: Displaying all three band sets simultaneously can overcrowd the chart, particularly on lower timeframes or volatile assets.
Subjective Interpretation: Color changes and band interactions require trader discretion; there's no built-in alerting or quantitative signals, which might lead to inconsistent results.
Market Dependency: Defaults may not suit all assets (e.g., stocks vs. crypto); shorter periods like 12 could whipsaw in noisy markets, while 144 might be too slow for intraday trading.
Justification for Default Values (12, 72, and 144)
The default lengths of 12, 72, and 144 are not arbitrary but draw from established trading principles, particularly W.D. Gann's geometric and numerical theories, as well as Fibonacci sequences, to create a harmonic progression for short-, medium-, and long-term analysis. Here's the rationale:
12 (Short-Term): This is a common period for capturing recent momentum in technical indicators, often seen in setups like the MACD (which uses 12- and 26-day EMAs). It aligns with natural cycles, such as the 12 months in a year, and in Gann theory, 12 serves as a base unit for squaring price and time (e.g., in the "Square of 12" where multiples like 12, 24, etc., measure cycles in days, weeks, or months). At 12 periods, the EMA reacts quickly to price changes without excessive noise, making it ideal for short-term trend detection.
72 (Medium-Term): This acts as an intermediate bridge, derived from Gann's divisions of the 360-degree circle (a key Gann concept representing a full cycle). Specifically, 72 is 360/5 (relating to pentagonal geometry and natural harmonics) and appears in Gann's time cycle measurements (e.g., as a multiple in the Square of 12: 12×6=72). It's roughly half of 144, providing a balanced midpoint for medium-term trends without overlapping too closely with the others. In practice, 72 periods smooth out short-term fluctuations while still responding to developing trends.
144 (Long-Term): This is a powerhouse number in trading lore, being both 12 squared (12×12=144, central to Gann's "Square of 144" for monthly charts and major cycle turns, as there are 12 months in a year) and a Fibonacci sequence value (1, 1, 2, 3, 5, 8, 13, 21, 34, 55, 89, 144...). Fibonacci periods are popular in moving averages for their alignment with natural growth patterns in markets, and 144 is often used for long-term regime definition (e.g., confirming trends over 144 bars). It helps identify major support/resistance in extended cycles.
Overall, these values form a geometric/harmonic series (12, 72=12×6, 144=12×12), promoting alignment with market cycles as per Gann and Fibonacci principles, rather than generic lengths like 50 or 200. They can be adjusted based on the asset or timeframe, but the defaults provide a starting point rooted in time-tested trading numerology for balanced multi-period analysis.
Please use this along with other indicators (eg. Pivot, MACD, etc) for better results.

Market Pressure Differential (MPD) [SharpStrat]Market Pressure Differential (MPD)
Concept & Purpose
The Market Pressure Differential (MPD) is a proprietary indicator designed to measure the internal balance of buying and selling pressure directly on the price chart.
Unlike standard momentum or trend indicators, MPD analyzes the structural behavior of each candle—its body, wicks, and overall range—to determine whether the market is dominated by expansion (buying aggression) or contraction (selling absorption).
This indicator provides a visual overlay of market pressure that adapts dynamically to volatility, helping traders see real-time shifts in participation intensity without using oscillators.
In simple terms:
When MPD expands upward → buyer pressure dominates.
When MPD contracts downward → seller pressure dominates.
Calculation Overview
MPD uses a structural candle formula to compute directional pressure:
Body Ratio = (Close − Open) / (High − Low)
Wick Differential = (Lower Wick − Upper Wick) / (High − Low)
Raw Pressure = (Body Ratio × Body Weight) + (Wick Differential × Wick Weight)
Then it applies:
EMA smoothing (to stabilize short-term noise)
Standard deviation normalization (to maintain consistent scaling)
ATR projection (to adapt the signal visually to volatility)
This produces the MPD projection line and the pressure ribbon, drawn directly on the main chart.
Customizable Inputs
Users can adjust color schemes, EMA smoothing length, ATR parameters, normalization length, and body/wick weighting to adapt the indicator’s sensitivity and aesthetic to different markets or chart themes.
How to Use
The Market Pressure Differential (MPD) visualizes the real-time balance between buying and selling pressure. It should be used as a contextual bias tool, not a standalone signal generator.
The white line represents the MPD projection, showing how market pressure evolves in real time based on candle structure and volatility.
The red line represents the ATR envelope, which defines the market’s expected volatility range.
MPD reacts quickly to candle structure, so trend bias is based on how its projection behaves relative to the ATR envelope:
Above the ATR band → positive pressure and bullish bias.
Below the ATR band → negative pressure and bearish bias.
Hovering near the ATR band → neutral or indecisive conditions.
The MPD percentage in the label represents the normalized strength of pressure relative to recent volatility.
Positive % = buying dominance.
Negative % = selling dominance.
Higher absolute values = stronger momentum compared to volatility.
To trade with MPD:
Watch candle colors and the projection line — green or positive % shows buyer control, red or negative % shows seller control.
Note transitions above or below the ATR level for early signs of momentum shifts.
Combine MPD signals with price structure, key levels, or volume for confirmation.
This helps reveal which side controls the market and whether that pressure is strong enough to overcome typical volatility.
Disclaimer
It introduces a novel structural–pressure approach to visualizing market dynamics.
For educational and analytical purposes only; this does not constitute financial advice.

Gho$t EMA CloudSimple 9/14EMA With Cloud system. Ghost EMA Cloud is a clean, minimal trend-tracking indicator designed to visualize short-term momentum shifts. It plots the 9-EMA (gray) and 14-EMA (white) while shading the area between them with dynamic cloud colors — green when momentum turns bullish, red when it weakens. The smooth cloud instantly highlights crossovers that often precede breakout or reversal moves. Optional 5-EMA and 12-EMA layers can be toggled on for extra precision without cluttering the chart. Ideal for intraday and swing traders, Ghost EMA Cloud helps you confirm entries, spot trend continuations, and time exits with clear visual simplicity and speed.

Simple Premarket High/LowA very simple script to mark pre-market highs and lows. Useful for momentum trading, discovering breakouts against pre-market levels.

MA Paketi This advanced MA & ATR Channel Indicator allows you to monitor both short-term and long-term trends on the same chart.
The script includes 9, 21, 50, 100, and 200-period moving averages (MAs) and also lets you add a custom MA of your choice.
Around the 200 MA, a ±6 ATR channel dynamically defines volatility-based support and resistance zones.
Key Features:
🔹 Five classic MAs (9, 21, 50, 100, 200)
🔹 User-defined custom MA (SMA, EMA, WMA, RMA, HMA options)
🔹 MA200-centered ±ATR channel (fully adjustable multiplier and period)
🔹 ATR-based dynamic volatility band
🔹 Alert conditions (notifies when price breaks above or below the channel)
🔹 Clean, colorful, and professional visual design
This indicator helps you analyze trend direction, momentum shifts, and volatility-driven reversal zones simultaneously.
Perfect for swing, scalp, and position traders alike.

CVD Pro – Smart Overlay + Signals (with Persist Mode)What this Indicator Does
CVD Pro visualizes Cumulative Volume Delta (CVD) data directly on your main price chart — helping you detect real buying vs. selling pressure in real time.
Unlike most CVD scripts that run in a separate subwindow, this one overlays price-mapped CVD curves on the candles themselves for better confluence with market structure and FVG zones.
The script dynamically scales normalized CVD values to the price range and uses adaptive smoothing and deviation bands to highlight shifts in trader behavior.
It also includes automatic bullish/bearish crossover signals, displayed as on-chart labels.
⚙️ Main Features
✅ Price-mapped CVD Overlay
CVD is normalized (Z-score) and projected onto the price chart for easy visual correlation with price structure.
✅ Multi-Timeframe Presets
Three sensitivity presets optimized for different chart environments:
Strict (4H) → Best for macro trends and high-timeframe structure.
Balanced (1H / 30m) → Great for active swing setups.
Sensitive (15m) → Captures short-term intraday reversals.
✅ Dynamic Bands & Smoothing
Deviation bands visualize statistical extremes in delta pressure — helping to identify exhaustion and divergence points.
✅ Smart Buy/Sell Signal Logic
Automatic label triggers when the CVD Overlay crosses its smoothed baseline:
🟢 BULL LONG → Rising CVD above the mean (buyers in control).
🔴 BEAR SHORT → Falling CVD below the mean (sellers in control).
✅ Persist Mode
Toggle to keep the last signal visible until a new one forms — ideal for traders who prefer clean chart annotations without noise.
✅ Clean, Minimal Overlay
Everything happens directly on your chart — no extra windows, no clutter. Designed for use with Smart Money Concepts, Fair Value Gaps (FVGs), or volume imbalance setups.
🧩 Use Case
CVD Pro is designed for traders who:
Use Smart Money Concepts (SMC) or ICT-style trading
Watch for FVG reactions, breaker blocks, and liquidity sweeps
Need to confirm order flow direction or momentum strength
Trade intraday or swing setups with precision entries and clear bias confirmation
⚡ Recommended Settings
4H / 1H: Use Strict mode for major structure and confirmation.
1H / 30m: Balanced mode for clear mid-term trend alignment.
15m: Sensitive mode to catch scalps and lower-TF shifts.
🧠 Pro Tips
Combine with RSI or Market Structure Breaks (MSS) for additional confluence.
A strong CVD divergence near a key FVG or 0.5–0.705 Fibonacci zone often signals reversal.
Persistent CVD crossover + price structure break = high-probability entry.
🧩 Credits
Created by Patrick S. ("Nova Labs")
Concept inspired by professional order-flow analytics and adaptive Z-Score normalization.
Would you like me to write a shorter “public summary” paragraph (for the short description at the top of TradingView, the one-liner users see before expanding)?
It’s usually a 2–3 sentence hook like:
“Overlay-based CVD indicator that merges volume delta with price structure. Detect true buying/selling pressure using adaptive normalization, deviation bands, and clean bullish/bearish crossover signals.”

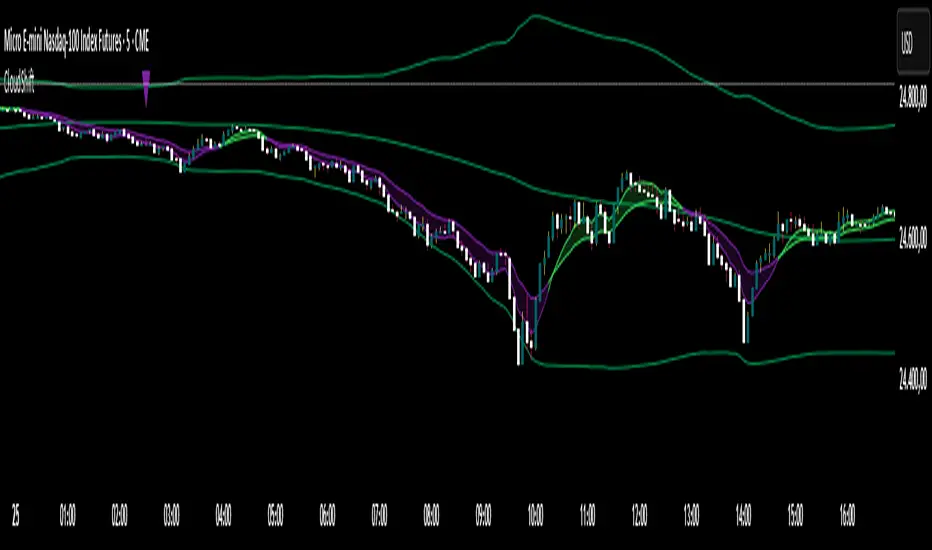
CloudShiftCloudShift + Bollinger Bands
This version of CloudShift now includes fully optimized Bollinger Bands with all three dynamic lines:
Upper Band: Highlights expansion during volatility spikes.
Lower Band: Identifies compression and accumulation zones.
Centerline (Basis): A smooth reference of the moving average, providing better visual balance and directional context.
The bands are drawn with thin, clean lime lines, designed to integrate perfectly with the cloud logic — keeping your chart minimalist yet powerful.
This update enhances the CloudShift indicator by providing a clear visual framework of market volatility and structure without altering its original logic.
Recommended for use on: NASDAQ, S&P 500, and other high-volatility futures.
Recommended timeframe: 5–15 minutes.
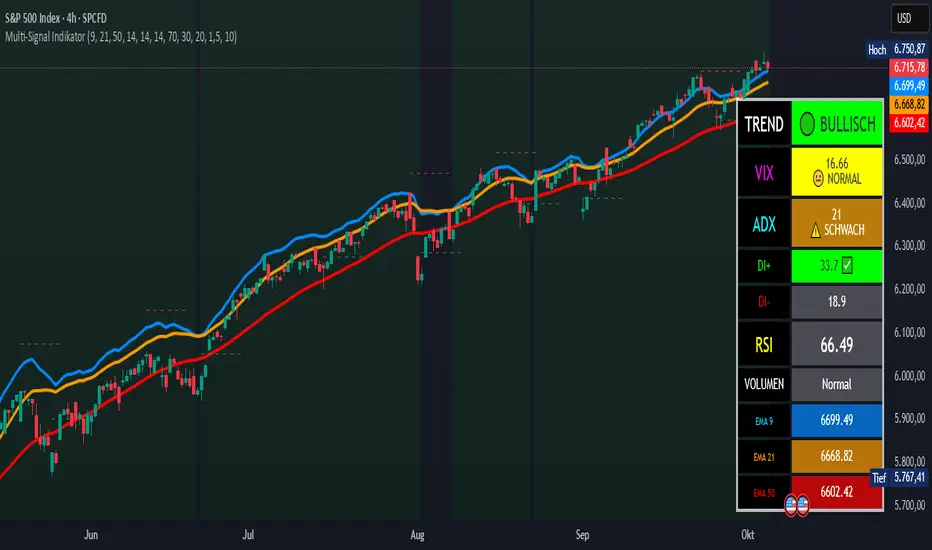
Multi-Signal IndikatorHier ist eine professionelle Beschreibung für deinen Indikator auf Englisch:
Multi-Signal Trading Indicator - Complete Market Analysis
This comprehensive trading indicator combines multiple technical analysis tools into one powerful dashboard, providing traders with all essential market information at a glance.
Key Features:
Trend Analysis: Three EMAs (9, 21, 50) with automatic trend detection and Golden/Death Cross signals
Momentum Indicators: RSI with overbought/oversold zones and visual alerts
Trend Strength: ADX indicator with DI+ and DI- showing the power of bullish and bearish movements
Market Fear Gauge: VIX (Volatility Index) integration displaying market sentiment from calm to panic levels
Volume Confirmation: Smart volume analysis comparing current activity against 20-period average
Support & Resistance: Automatic pivot point detection with dynamic S/R lines
Buy/Sell Signals: Combined signals only trigger when trend, RSI, and volume align perfectly
Visual Dashboard: Color-coded info panel showing all metrics in real-time with intuitive emoji indicators
Perfect for: Day traders, swing traders, and investors who want a complete market overview without cluttering their charts with multiple indicators.
Customizable settings allow you to adjust all parameters to match your trading style.
BTC 4H — No-3% Pullback Moves (>=7%, wick-to-wick)4h candles move without pullbacks 3%
in settings you can set a pullback %
and i try to got middle % of such moves

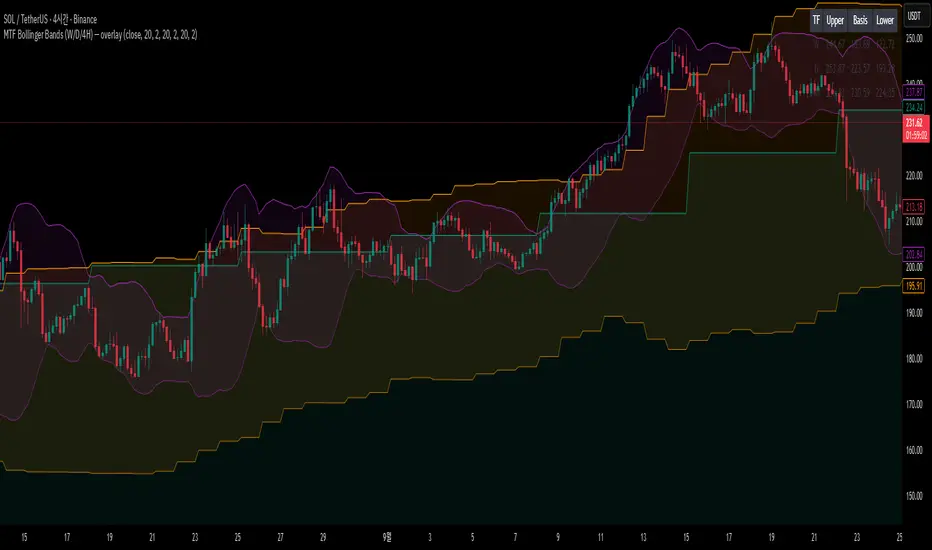
MTF Bollinger Bands (W/D/4H)MTF Bollinger Bands (W/D/4H)
Always mark the 1W 1D 4H bolinger band regardless of the time frame.