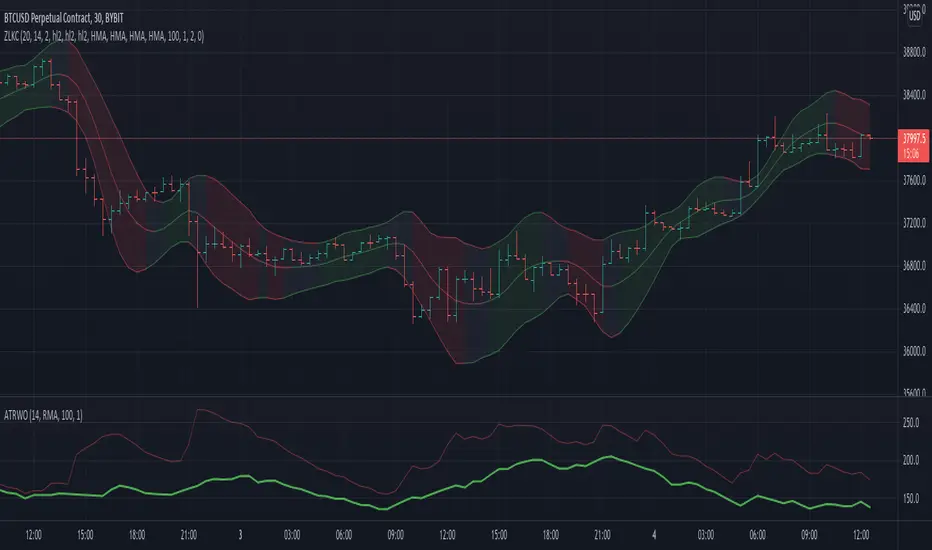
Zero Lag Keltner ChannelsThis is Keltner Channelz (KC) with Zero Lag Moving Average (ZLMA as base). It is smoother and has less lag than the original (EMA/SMA) variant.
It also can be used as a trend indicator and trend confirmation indicator. The upper and lower bands are green if it is an up trend, and red if a down trend. If both have the same color it is a stronger trend.
Bands
Anchored VWAP w/ Stdev and VWMA CloudThis is a fun little project that allows you to anchor the Volume Weighed Average Price (VWAP) to a specific day and plot up to 4 standard deviations up or down.
I've also added a Volume Weighted Moving Average (VWMA) plot and accompanying cloud to more easily visualize how volume-based momentum affects trends.
Typically, you'll see price respecting the VWMA Cloud and can expect price bounces off of the VWAP standard deviations.
When setting the initial anchor point, it's best to select a day with high volume and volatility.
This idea is not 100% original, but I couldn't find 1) a public script combining the ideas and 2) the correct plotting of the standard deviation via accumulation.
Happy Trading!
FAQ
Why is your script Protected?
Users like to take my open-source code and charge to use it without my permission.
How do I use this to trade?
Add it to your chart and see what stacks up with your current setup. I trade Forex, so what looks bad on my charts might look golden on yours.
How long have you been doing this?
I've been coding for about 8 years and actively trading for 2 years. My degree is in Robotics Engineering and I became obsessed with investing at 22.
How do you trade?
Hurst + SNR + MESA MAMA + ATR + LSTM + Pure Grid. You can't completely code this setup using Pinescript, but if you learn C++ or Python you're there!
Are your returns good?
I average 0.68% every weekday or 22.65% monthly, using the method above.
Can you build my indicator or strategy?
Absolutely! If it hasn't been done before and it improves our community, then consider it done.
But can you build an indicator or strategy for me and only me?
Citing the house rules, I cannot solicit for any purpose. So saying "PM me" would be a grievous violation of said rules, obviously.

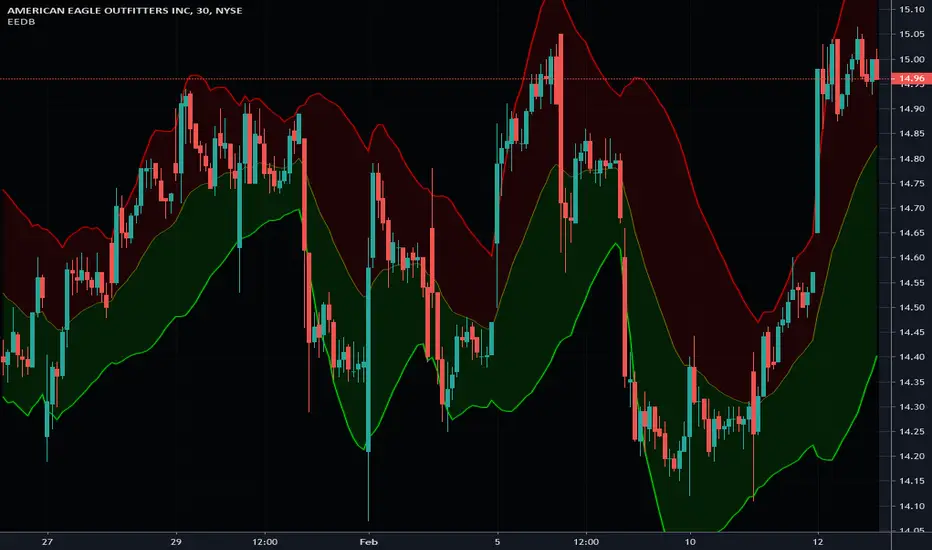
Enhanced Exponential Deviation Bands - Vitali ApirineEverybody has heard of Bollinger banding right? Well, if you are looking for those, you have come to the wrong place. This is something very similar though! These are "Enhanced Exponential Deviation Bands" in the overlay panel employing PSv4.0, originally devised by Vitali Apirine for an article in TASC - July of 2019 Traders Tips. This indicator is freely available for all members to use.
The comments section below is solely just for commenting and other remarks, ideas, compliments, etc... regarding only this indicator, not others. When available time provides itself, I will consider your inquiries, thoughts, and concepts presented below in the comments section if you do have any questions or comments regarding this indicator. When my indicators achieve more prevalent use by TV members, I may implement more ideas when they present themselves as worthy additions. As always, "Like" it if you simply just like it with a proper thumbs up, and also return to my scripts list occasionally for additional postings. Have a profitable future everyone!
NoScoobies Bollinger BandsBollinger Bands strategy that I am trying out, however I can't get my strategy.close to work. Looking for help.
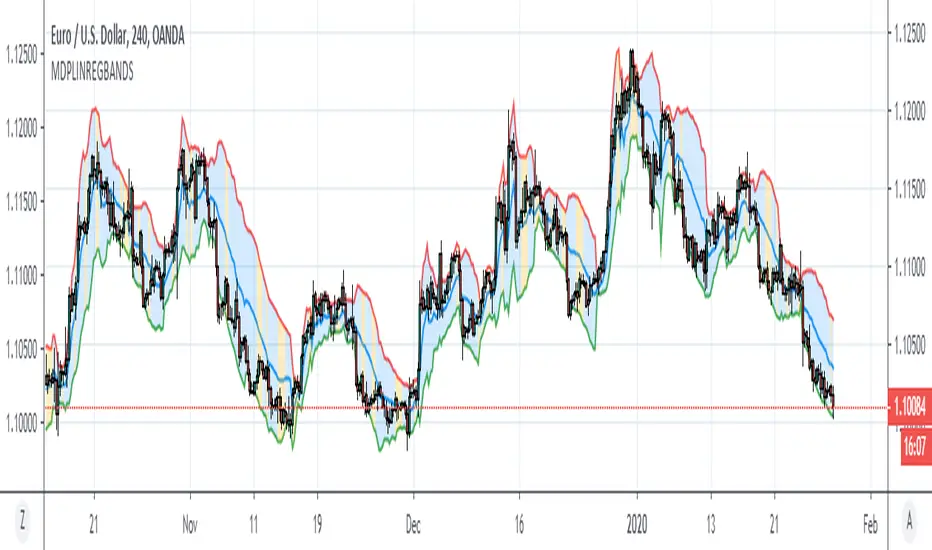
Minkowski Distance Period Linear Regression BandsHello, this script was created by using Linear Regression Bands Function with variable Function Minkowski Distance Adaptive Period.
Function Linear Regression Bands :
Minkowski Distance Function Original Script by RicardoSantos :
Functions saved from overloads . And suitable for mutable variable periods.
Regards.
SFL ATR BandsMany traders use ATR as a way to determine stop loss placement. It usually works like this:
- Stop loss for a short trade = high of last candle + ATR value
- Stop loss for a long trade = low of last candle – ATR value
This is an indicator that allows you to do just that: it gives you an easy way to view current and historical volatility using ATR-based price bands .
Features
The indicator is configurable with the following settings:
ATR period
ATR multiplier
ATR applied to highs/lows OR the close price
Bands offset
Only show for the last X candles
How To Use This Indicator
Since this indicator shows average volatility bands, it is a good measure of how much the price moves. So we can use ATR bands in a number of ways:
it’s an easy way to see where you can place your stop loss
you can use a multiple of ATR as your trade target
you can trail your stops alongside the ATR bands

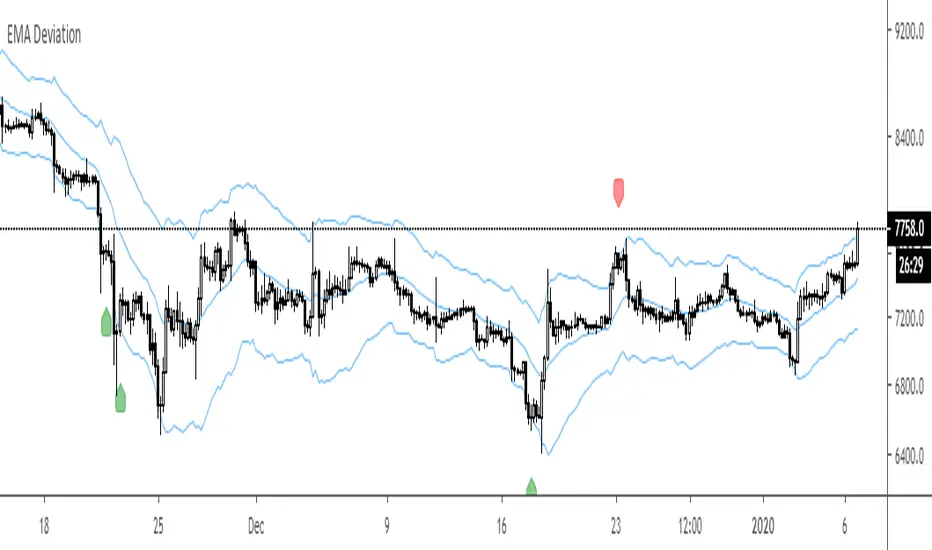
EMA Deviation #1Useful for finding reversal points or as a signal to take profit
Would not recommend higher ma settings.
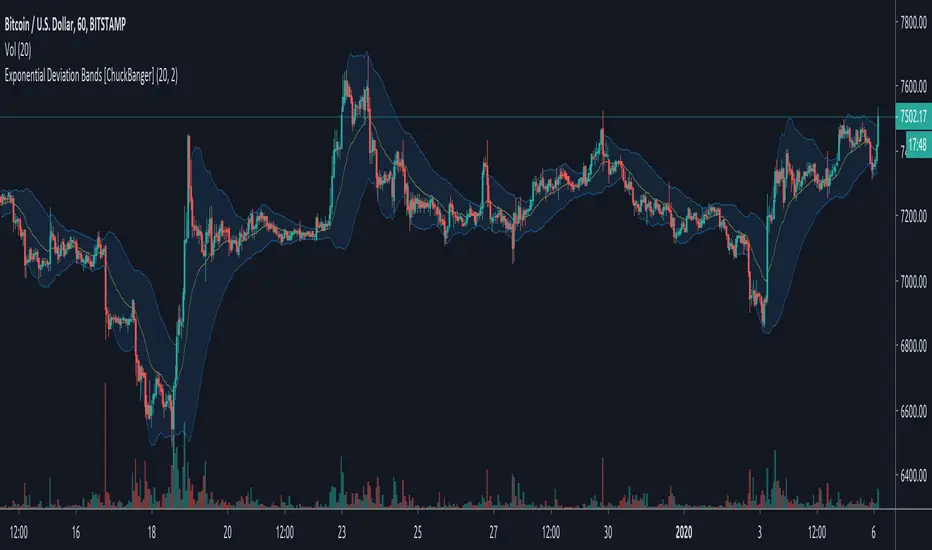
Exponential Deviation Bands [ChuckBanger]This is Exponential Deviation Bands. It is a price band indicator based on exponential deviation rather than the more traditional standard deviation, as you find in the well-known Bollinger Bands calculation. As compared to standard deviation bands, exponential deviation bands apply more weight to recent data and generate fewer breakouts. There fore it is a much better tool to identifying trends.
One strategy on the daily can be
Buy next bar if closing price crosses below the lower bands
Sell if price is equal to the current value of the upper bands
Ehlers Fractal Adaptive Moving Average with Bands [Bitcoinduke]FRAMA – What is it?
Fractal Adaptive Moving Average Technical Indicator ( FRAMA ) was developed by John Ehlers, code was implemented by TradingView user Shizaru. I've updated it to Pine Script 4 and added Bands Extension.
This indicator is constructed based on the algorithm of the Exponential Moving Average , in which the smoothing factor is calculated based on the current fractal dimension of the price series.
Advantages:
possibility to follow strong trend movements
determine moments of price consolidation ( FRAMA sufficiently slow down at these moments)
FRAMA + Bands
The FRAMA serves as a base for the Upper and Lower Bands which are used as a way to measure volatility by observing the relationship between the Bands and price. Typically the Upper and Lower Bands are set to two standard deviations away from the FRAMA ; however it should be adjusted depending on the task.

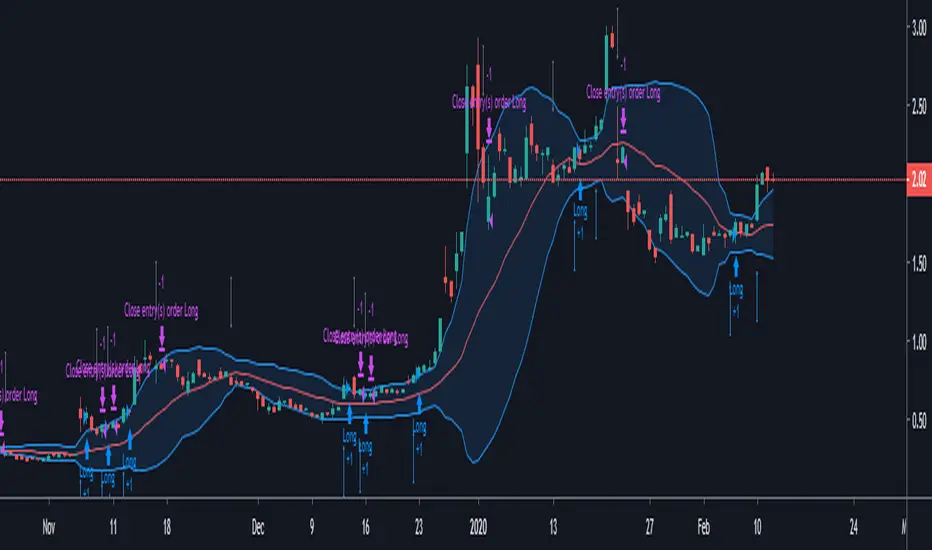
Cuban's Reversion BandsThere are quite a few band indicators out there, ATR, VWAP, Bollinger, Fib, etc. however, I could never find anything that could scale accurately during periods of high volatility. That brought me to writing this indicator.
These bands use my Volume-Weighted Anchored Trend (VWAT) for the basis and highlight the standard deviation that you might expect high probability reversals to occur from.
I use these bands in my own trading system. The default settings are quite effective but you're able to modify the std multiplier within the settings as you see fit.
Generally, I would only play reversals during a ranging environment, however even if the market is trending, these bands will assist in spotting a weakening trend.
An ideal trend reversal would be a wick into the outer band, followed shortly by a weaker sweep of the previous move and wicking the inner band.
Hopefully you'll find this useful in your trading!

Godemode Custom BandsCustom band indicator that relies on secret sauce and generates a mid line, and upper line and a bottom line. Used for crypto markets and other markets. Want more description? Contact me. Private indicator for use for a few people. Access will most likely not be given.

Bollinger Bands Trend Model-BuschiEnglish
In general, Bollinger Bands are used as an indicator to visualize the "reversion to the mean". However, in this model, by using smaller variable values (default: 10 time intervals instead of 20, 1 standard deviation instead of 2), they are used as an trend following indicator. Two consecutive closes above the upper band form a buy signal (symbol 'B' above bar) which is reversed by two consecutive closes below the lower band (symbol 'S' under bar) and vice versa. The corresponding buying (green) and selling (red) zones are coloured between the bands.
Deutsch
Im Allgemeinen werden Bollinger-Bänder als ein Indikator verwendet, um die "Rückkehr zum Mittelwert" zu visualisieren. In diesem Modell werden sie durch kleine Variablen-Werte (Standardwert: 10 Zeitintervalle anstatt 20, 1 Standardabweichung anstatt 2) jedoch als Trendfolge-Indikator verwendet. Zwei aufeinanderfolgende Schlusskurse über dem oberen Band (Symbol 'B' über dem Balken) bilden ein Kaufsignal, das durch zwei aufeinanderfolgende Schlusskurse unter dem unteren Band (Symbol 'S' unter Balken) umgekehrt wird. Gleiches gilt umgekehrt. Die entsprechenden Kauf-Zonen (grün) und Verkauf-Zonen (rot) werden zwischen den Bändern eingefärbt.

Fibonacci BandsFibonacci Bands are derived from Fibonacci ratios expansion from a fixed moving average.
These bands help traders find key areas of support and resistance . "Fibonacci bands" are
computed by adding a Fibonacci ratio distance (Up and Down) from a "key moving" average
(21, 34, 89 periods). An 8 period average of "True range" is computed. The multiples of
Fibonacci ratios of this range are added to the fixed moving average to compute Fibonacci
Bands
One of the best ways to find trend reversals is to watch the price action near the extreme bands
(both lower and higher). Markets tend to reverse when prices trade outside of the band for a
few bars and again trade inside the bands. After reversals, markets also tend to trade from one
extreme band to the other end (opposite) of the extreme bands.

Variable Index Dynamic Average (VIDYA) BandsThis adds volatility bands to the Variable Index Dynamic Average (VIDYA). The bands are calculated using the exponential moving average of the standard deviation of the VIDYA.
Thanks to everget for programming the VIDYA for tradingview.

Enhanced Widner Projection Bands - Mel Widner, Ph.D.Everybody has heard of Bollinger banding right? Well, if you are looking for those, you have come to the wrong place. This is something very similar though! These are "Enhanced Widner Projection Bands" in the overlay panel employing PSv4.0, originally devised by Mel Widner, Ph .D. for an article in TASC - July of 1995 Traders Tips. This indicator is freely available for all members to use.
Also, this is a companion indicator for my "Projection Oscillator"(displayed underneath) using modified code from that. The projection bands visually display how the wave forms are generated for the "Projection Oscillator" when the period controls are matched between both indicators. You will then see how the alignments are correlated between the projection bands and the projection oscillator. In this script however, the upper and lower banding is controlled independently, but can be controlled tandemly by enabling an override. I decided to incorporate some of my banding technology as well, offering color schemes, line thickness, and transparency controls. I also discovered a way to improve 1px line dithering using a simple technique. Overall, it's fairly easy to use, so I won't elaborate beyond what you have read already.
The comments section below is solely just for commenting and other remarks, ideas, compliments, etc... regarding only this indicator, not others. When available time provides itself, I will consider your inquiries, thoughts, and concepts presented below in the comments section if you do have any questions or comments regarding this indicator. When my indicators achieve more prevalent use by TV members, I may implement more ideas when they present themselves as worthy additions. As always, "Like" it if you simply just like it with a proper thumbs up, and also return to my scripts list occasionally for additional postings. Have a profitable future everyone!

MA-ChannelA MA band with adjustable coefficient for ease of dialing in on various assets...Play around with the Length AND coef to get the "Best Fit" for the asset you're working with (ie, as few penetrations through the bands as possible in extremes).
Extended Recursive Bands - Maximum Efficiency With Extra OptionsIntroducing A New Calculation For Efficient Bands Calculation !
Here it is ! The Recursive Bands Indicator, an indicator specially created to be extremely efficient, i think you already know that calculation time is extra important in algorithmic trading, and this is the principal motivation for the creation of the proposed indicator. Originally described in my paper "Pierrefeu, Alex (2019): Recursive Bands - A New Indicator For Technical Analysis" , the indicator framework has been widely used in my previous uploaded indicators, however it would have been a shame to not upload it, however user experience being a major concern for me, i decided to add extra options, which explain the term "extended".
On The Indicator Calculation
You can skip this part if it doesn't interest you. The calculation of the indicator is based on recursion, but i want to explain the mathematical formula described in the paper.
I've seen some users trying to remake it from the calculations, however there was always something weird, and i understand, mathematical notations are always a bit weird, even myself don't always write them correctly/understand them, however this one is relatively simple to understand.
First lets explain each elements of the calculation :
α = smoothing constant, or 2/(length+1)
max/min = maximum and minimum function, max return the greatest input value while min return the lowest one, for example :
max(4,2) = 4 while min(4,2) = 2
the "||" notation mean taking the absolute value, for example : |-1| = abs(-1) = 1
The calculation after the max/min function is called the correction factor, and is the core of the indicator. The last two variables are just here to provide an initial value for upper and lower, basically when we start our calculations we will assign the value of the closing price for upper and lower.
The motivation behind using a smoothing constant in range of (0,1) was to tell the reader that the indicator is easily made adaptive, this is what i did on my adaptive trailing stop indicator by using the efficiency ratio as smoothing variable, the user can use 1/length instead of the provided calculation for alpha.
If you interested on the indicator main logic, it is actually really simple, by using upper = max(price,upper) and lower = min(price,lower) we would get the maximum/minimum price value at time t , therefore upper can only be greater or equal than its precedent value, while lower can only be lower or equal than its precedent value, in order to fix that we subtract/sum upper/lower with a value, this allow the upper band to be lower than its precedent value and lower to be greater than its precedent value, this is the role of the correction factor.
The Indicator
The indicator display one upper and one lower band, every common usages applied to bands indicators such as support/resistance, breakout, trailing stop...etc, can also be applied to this one. length control how reactive the bands are, higher values of length will make the bands cross the price less often.
In order to provide more flexibility for the user i added the option to use various methods for the calculation of the indicator, therefore the indicator can use the average true range, standard deviation, average high-low range, and one totally exclusive method specially designed for this indicator.
Classic Method
This option make the indicator use its classical calculation, this is the most efficient method of all.
Atr Method (atr)
This method use the average true range as correction factor, notice that lower values of length can still produce wide band.
Standard Deviation Method (stdev)
This method use a biased estimate of the standard deviation as correction factor.
The method produce smoother bands that converge more slowly toward the price in comparison with the classic correction factor.
Average High-Low Range Method (ahlr)
This method use the average of the high-low range as correction factor, extremely similar to the average true range.
Rising Falling Volatility (rfv) Method
A new method created for this indicator, this correction factor use the absolute prices changes when price value is greater/lower than any length past values of the price, this allow to have more boxy shaped bands, work best with greater values of length.
The bands can be in contact with this method, a possible fix in the future.
Conclusion
The recursive band indicator is one of my greatest indicators in my opinion (i would love to have yours), as you can see the idea behind it is extremely simple and allow for a super efficient band indicator, which was the original motivation behind it, in order to provide more fun for the users i also added more option for the correction factor, this allow the user to be creative and not get stuck with the original calculation.
Like the trend step indicator family we have almost ended our series on the recursive band framework, 1 more trailing stop will be added in the future, and then we'll have more "boring" stuff until i find something cool again, it shouldn't be long ;)
Thanks for reading !

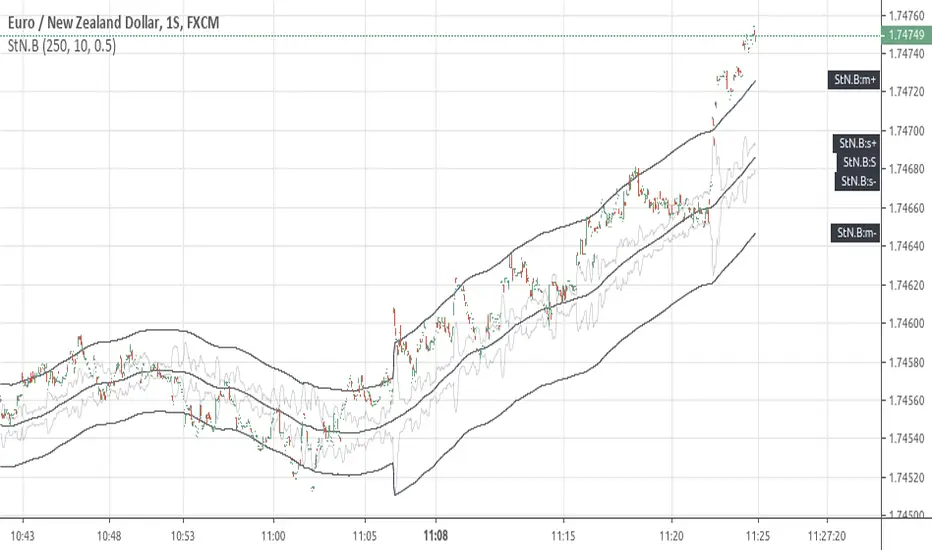
[RS]Signal to Noise BandsEXPERIMENTAL:
Bands using Signal to Noise Calculation.
The bands calculation is similar to bolingers in the aspect that both use standard deviation.
Smart Envelope - Running Away From The TrendIntroduction
Envelopes indicators consist in displaying one upper and one lower extremity on the price chart. They are most of the time built by adding/subtracting a volatility estimator (rolling stdev, atr, range...etc) to a central tendency estimator (SMA, EMA, LSMA...etc) . Their interpretation is often subject to debate amongst technical analyst, some will use a support and resistance methodology, where price will start a downtrend once it cross the upper extremity, and a down trend once it cross the lower one. Others will prefer a breakout methodology, where price will reach higher highs once it cross the upper extremity, and lower lows when it cross the lower one. Because of price non stationarity its hard to select the best methodology, the support and resistance one will mostly work on ranging markets, while the breakout methodology mostly work on trending ones.
Therefore new methods where proposed, instead of using moving averages with a high lag, faster filters where used, such as the least squares moving average or zero lag exponential moving average, other band indicators where also created using adaptive filters, but improvements remain relatively low. The most difficult task would be to make extremities with the ability to return accurate support and resistances levels, and today i want to provide a new way to construct such extremities by using the recursive bands framework that allow extremely creative and efficient indicators.
The Main Idea
With classical bands indicators, the upper and lower extremity will still be correlated with the main trend, the problem behind such method is that we can't use a support and resistance methodology with trending markets, the fact that reversals exist tells us that our extremities will always be crossed by the main trend, here is an example :
Here the support is correlated with the main trend, in order for it to be accurate we must assume the trend will go on for ever, and will only detect higher lows, this is what we expect with the orange line, but we can see that a severe down trend totally destroy our plan.
In short we need to give some headroom to our extremities, and thus one extremity can't be correlated with the main trend.
The proposed Indicator
We want to minimize the correlation between the extremities, so if the upper extremity rise, the lower one must fall. This allow to give some headroom and allow the user to anticipate larger movements, this is how bands seeking to give support and resistances points should work.
The indicator has a length setting that control the wideness of the extremities, unlike other indicators low values such as 14 can still create really wide bands, take that into account.
length = 5. Lower length values allow for more motion from the extremities, but does not necessarily involve detecting shorter terms support and resistances levels. The factor setting is not that important, but it allow to return extremities with more motion when high, and really wide bands when below 1 and greater than 0.
Central Tendency Estimator
Something fun with the recursive band framework is that the bands are no longer based on the central tendency estimator but its the central tendency estimator who is based on the bands. The central tendency estimator can also provide support and resistances points with the price, like classical moving averages, altho its lack of motion is this time a downside.
Conclusion
Altho the extremities are more accurate than other band indicators, the problem remain the same, larger trend will always break the extremities and continue creating higher/lower highs/lows, at this point our stop loss would certainly be triggered. This is a huge downsides of contrarian strategy, we sure might anticipate reversals earlier, but we are exposed to larger price movements, therefore the risk is extreme.
But the proposed methodology might still prove useful to develop more robust support and resistances levels based on envelopes indicators.
Thanks for reading !

R100 Volatility Combo Bands v1 (*v*)The Volatility Combo Bands are made from 4 separate volatility bands- two Bollinger Bands (10 and 20 period) and two Price Headley Acceleration Bands (10 and 20 period). The Volatility Combo Bands plot the innermost upper and lower points from these bands and then plots a mid-line. By default, only the standard 20 period Bollinger Bands and Combo Bands with mid-line are displayed, but can be configured however you want.
Try it out- see squeezes earlier, ride the bands earlier in trending markets, trade pullbacks to the Combo Bands and mid-line, trade the range of the band or use them to help identify potential support and resistance levels. Hopefully they can add another dimension to identifying volatility contraction patterns or whatever you currently use these things for!
I hope you get some value out of it. Only conditions of use are that if you improve it, let me know and if you publish something that uses it, don't hide the code! Enjoy!
Code for the Price Headley Acceleration Bands pinched and modified from LazyBear - thankyou.

Price-Curve ChannelIntroduction
Although many will use lines in order to make support and resistances, others might use curves, this is logical since trends are not always linear. Therefore it was also important to take this into consideration, and when i published the price-line channel indicator, i already started a curved version of it. Therefore i propose this new indicator based on the recursive bands framework that allow to return curved support and resistances. The benefits of this indicator are : a totally stable approach, user friendly, and extremities able to converge faster toward the price.
The Indicator
The indicator is way faster than the price-line channel one, this is due to the fast convergence toward the price of the extremities. Length control the reactivity of the indicator, while mult is more related to the rate of convergence, values of mult lower than 1 will make the curve converge slower,
mult = .5
Higher values of mult will make the extremities converge faster toward the price.
mult = 2
Unlike the price-line channel indicator this one is directly "readjusted", this is due to the fact that the extremities are no longer linear, of course a "perfectly" curved version could come in an update, but for the moment it wasn't really a necessity.
Comparison With Price-Line
The fact that the extremities converge faster toward the price allow to possibly capture more tops/bottoms/retracements. However the extremities of both indicator have the same behavior regarding their accuracy, for example the upper extremity have a higher chance to detect a retracement when on a downtrend, while the lower extremity have higher chance to detect a retracement while on a up-trend.
On The Indicator Construction
The recursive bands framework is the core of the indicator, it is important to use it. The curved effect is given by multiplying the correction factor by the barssince function, therefore the correction factor is no longer constant which in return allow for a non linear output.
The size is divided by the square of length in order to keep a certain logic between the output and the length period.
Conclusion
The recursive bands framework prove again to be quite interesting, lot of indicators can be made using it, i only posted a fraction of what can be done with it, which make the recursive bands indicator one of the best indicators i ever made in my opinion.
The proposed indicator is stable, and don't require nightmarish manipulations (unlike the linear channels indicator), its ability to detect possible support and resistances points, although subjective, remain a feature of the indicator. The use of recursion make the indicator efficient. I hope the indicator find some use in the community.
Thanks for reading !
Linear version.
Note
Respect the house rules, always request permission before publishing open source code. This is an original work, requesting permission is the least you can do.
I apologize for any grammatical/orthographic error in this post.

Price-Line Channel - A Friendly Support And Resistance IndicatorIntroduction
Lines are the most widely used figures in technical analysis, this is due to the linear trends that some securities posses (daily log SP500 for example), support and resistances are also responsible for the uses of lines, basically linear support and resistances are made with the assumption that the line connecting two local maximas or minimas will help the user detect a new local maxima or minima when the price will cross the line.
Technical indicators attempting to output lines have always been a concern in technical analysis, the mostly know certainly being the linear regression, however any linear models would fit in this category. In general those indicators always reevaluate their outputs values (repainting), others non repainting indicators returning lines are sometimes to impractical to set-up. This is what has encouraged me to make a simpler indicator based on the framework used in the recursive bands indicator that i published.
The proposed indicator aim to be extremely flexible and easy to use while returning linear support and resistances, an option that allow readjustment is also introduced, thus allowing for a "smarter" indicator.
The Indicator
The indicator return two extremities, the upper one aim to detect resistance points while the lower one aim to detect support points. The length setting control the steepness of the line, with higher values of length involving a lower slope, this make the indicator less reactive and interact with the price less often.
The name "price-line" comes from the fact that the channel is dependent on its own interaction with the price, therefore a breakout methodology can also be used, where price is up-trending when crossing with the upper extremity and down trending when crossing with the lower one.
Readjusted Option
The line steepness can be readjusted based on the market volatility, it make more sense for the line to be more steep when the market is more volatile, thus making it converge faster toward the price, this of course is done at the cost of some linearity. This is achieved by checking the "readjustment" option. The effects can be shown on BTCUSD, below the indicator without the readjusted option :
when the "readjustment" option is checked we have the following results :
The volatile down movement on BTCUSd make the upper extremity converge faster toward the price, this option can be great for volatile markets.
Conclusion
The recursive bands indicator prove to be an excellent framework that allow for the creation of lots of indicators, the proposed indicator is extremely efficient and provide an easy solution for returning linear support and resistances without much drawbacks, the readjusted option allow the indicator to adapt to the market volatility at the cost of linearity.
The performance of the indicator is relative to the motion of the price, however the indicator show signs of returning accurate support and resistances points. I hope the indicator find its use in the community.
Thanks for reading !
Note
Respect the house rules, always request permission before publishing open source code. This is an original work, requesting permission is the least you can do.

G-Channels - Efficient Calculation Of Upper/Lower ExtremitiesIntroduction
Channels indicators are widely used in technical analysis, they provide lot of information. In general, technical indicators giving upper/lower extremities are calculated by adding/subtracting a volatility component to a central tendency estimator. This is the case with Bollinger bands, using the rolling standard deviation as volatility estimator and the simple moving average as central tendency estimator, or the Keltner channels using the exponential moving average and the average true range.
Lots and lots and lots (i can go on) of those indicators have been made, they only really need a central tendency estimator, which can be obtained from pretty much any filter, however i find interesting to focus on the efficiency of those indicators, therefore i propose a super efficient channel indicator using recursion. The average resulting from the upper/lower extremity of the indicator provide a new efficient filter similar to the average highest/lowest.
The calculation - How Does It Works
Efficiency is often associated to recursion, this would allow us to use past output values as input, so how does the indicator is calculated? Lets look at the upper band calculation :
a := max(src,nz(a(1))) - nz(a(1) - b(1))/length
src is the closing price, a is upper extremity, b is the lower one. Here we only need 3 values, the previous values of a and b and the closing price. Basically a := max(src,nz(a(1))) mean :
if the closing price is greater than the precedent value of a then output the closing price, else output the precedent value of a
therefore a will never be inferior to its precedent value, this is useful for getting the maximum price value in our dataset however its not useful to make an upper band, therefore we subtract this to a correction factor defined as the difference between a and b , this force the upper band to have lower values thus acting like a band without loosing its "upper" property, a similar process is done with the lower band.
Of course we could only use 2 values for making the indicator, thus ending with :
a := max(src,nz(a(1))) - nz(abs(close - a(1))/length
In fact this implementation is the same as the one proposed in my paper "Recursive Bands - A New Indicator For Technical Analysis", its also what i used for making the indicator "Adaptive Trailing Stop", this would be more efficient but i used the difference between the upper and lower extremities for a reason.
The Central tendency Estimator
This is the reason why i didn't implemented a more efficient version. Basically this central tendency estimator is just the average between the upper and lower extremities, it behave like the average of the highest/lowest over length period, its central plot in the Donchian channel indicator. Below is a comparison of both with length = 100 :
But why is our average so "boxy"? The extremities are not boxy, so why the average is sometimes equal to its previous value? Explain!
Its super easy to understand, imagine two lines, if their absolute change is the same and they follow an opposite direction, then their average is constant.
the average of the green and red line is the orange line. If both lines follow the same direction then their average will also follow this direction.
When both extremities follow the same direction, the average will also do the same, when both follow an opposite direction then the average will be equal to its precedent value, this is also due to the fact that both extremities are based on the same correction factor (a-b) , else the average wouldn't act that way, now you understand why i made this choice.
Conclusion
I proposed an efficient implementation of a channel indicator that provide an interesting central tendency estimator. This simple implementation would allow for tons of interesting concepts, some of my indicators use a similar approach and allow for great outputs, you'll see them soon enough. I hope this indicator find its use in the community, remember to ask before using this indicator in a script you want to publish.
Thanks for reading !
If you want to discuss about anime stuff send me a pm but don't do it in the commend section.
