Média de Amplitude de Variação (ATR)

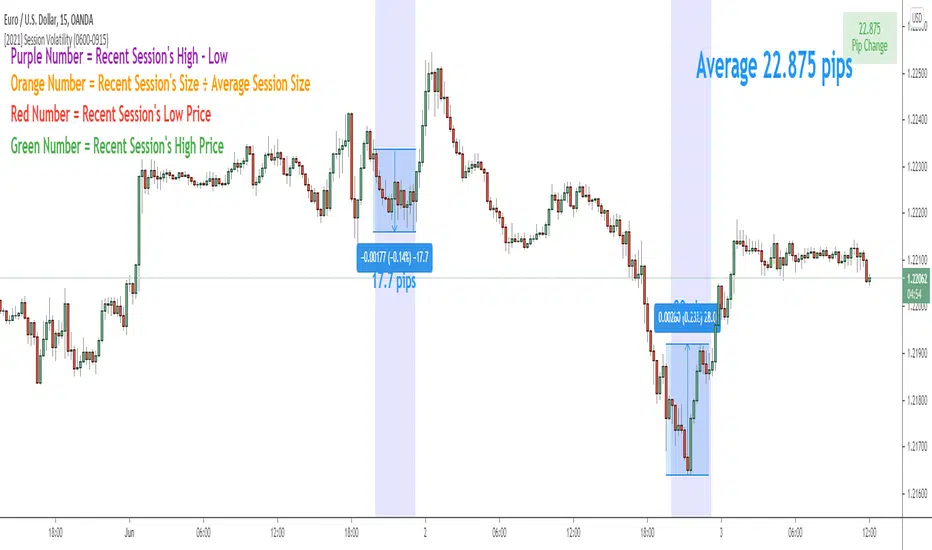
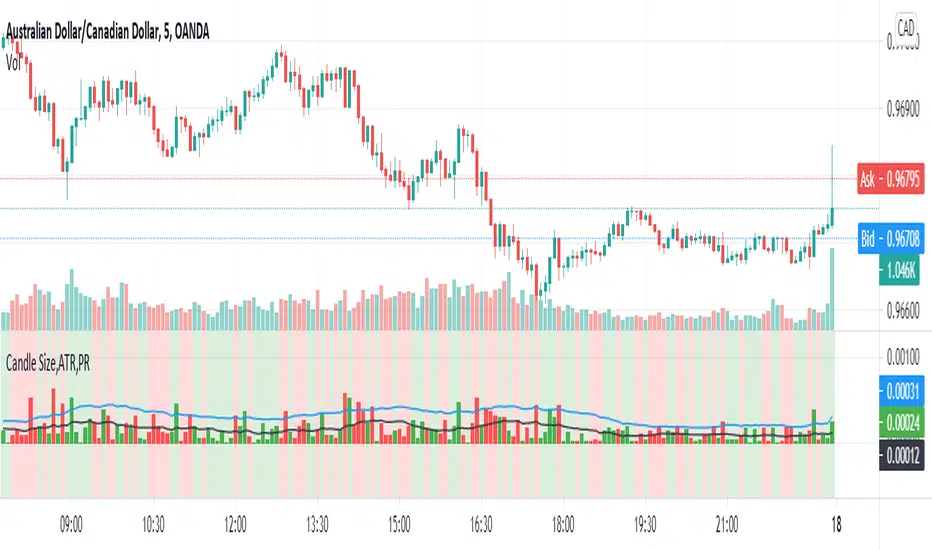
Session Volatility CalculatorHey traders!
This script calculates the average volatility of trading sessions.
You specify a start date, an end date, and a session time (eg. market open, Asian session etc)
The script then scans through all the price action on your chart and calculates the average price movement during that specified period.
What Is It For?
I created this script for my own purposes when developing certain strategies and testing certain ideas.
The purpose of this script is to give you an idea of how much price tends to move during certain times of day for certain markets.
You could think of it as a "session's average true range".
In crypto and forex this might be how much price tends to move on certain pairs during the Australian/Asian session, or the European session, or the overnight U.S. session etc.
In stocks this might be how much a symbol tends to move during the first hour of the day or the last hour of the day.
The point of calculating this information is for better understanding how markets move during certain times of day.
It's not a perfect science obviously since some days can be wilder than others depending on what fundamental events are developing, but it's useful information to have for times when there are no expected volatility-inducing events.
This info can help with optimizing targets and stop loss placement for certain day-trading strategies, and just generally getting an idea of what kinds of moves you might reasonably expect out of overnight positions or certain times of day etc - or at least that's what I use it for.
Settings
Hover your mouse over the "i" symbol to get more information on the script's settings, but here's a brief description:
Start Date: The date to begin calculating from (set to 1000 by default so it scans the entire chart).
End Date: The date to stop calculating (set to 2099 by default so it scans the entire chart)
Time Session: This is the time session during the day that you want to analyze.
Color Background: If turned on, this setting changes the background color to highlight the session.
Indicator Values
The indicator outputs a handful of values onto your chart. This is what the colors correspond to:
Top-Right Box: The average price range during the given time of day over historical price action.
Green Number: The recent session's highest price.
Red Number: The recent session's lowest price.
Purple Number: The recent session's price range (high - low).
Orange Number: The recent session's range ÷ the average (outputs a relative % of the average).
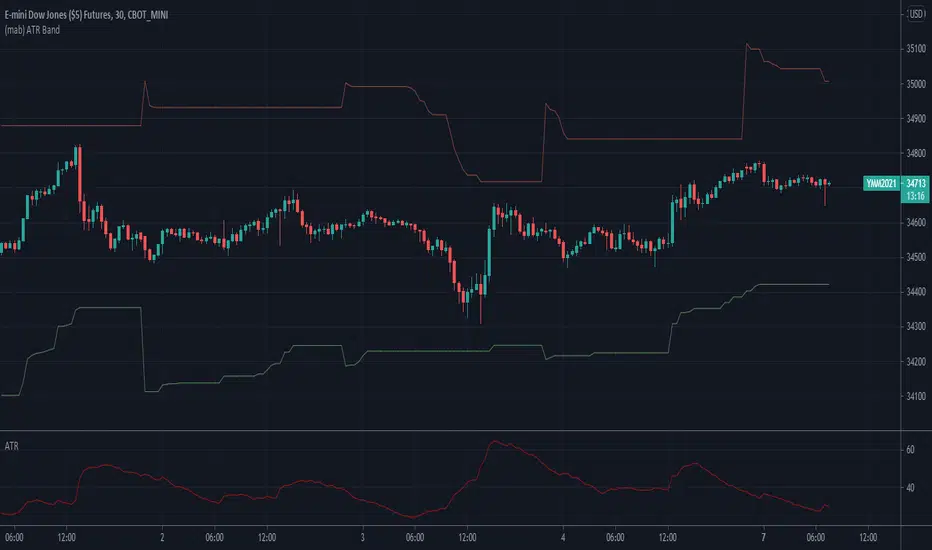
[JL] ATR HL CloudI am playing ATR now.
This script is made to watch ATR and highest-lowest.
ATR is calculated by max of short period and long period.
Up cloud is lowest price plus ATR * Multi
Dn cloud is highest price decrease ATR* Multi
Higher and higher cloud means up trend
Lower and lower cloud means dn trend

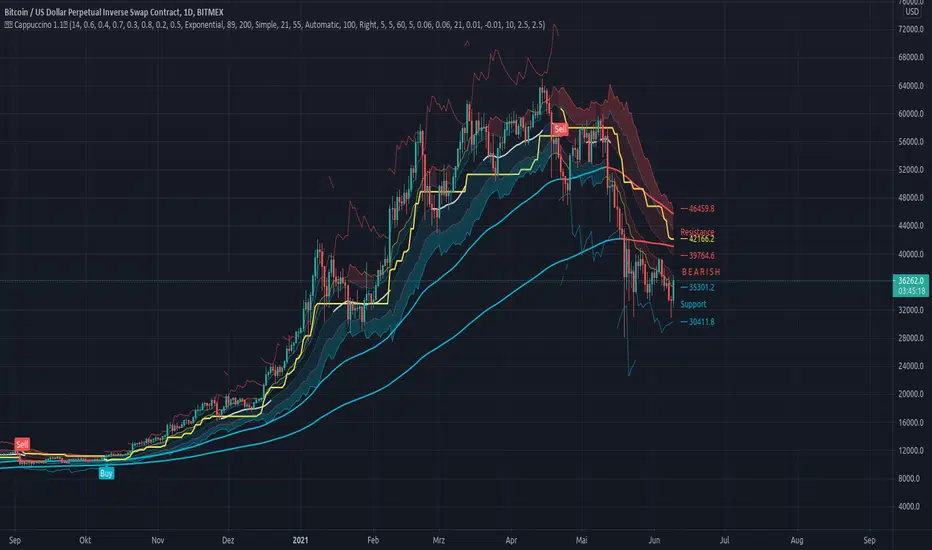
Cappuccino IndicatorThis is a indicator I built on the basis of RSI and price action.
It is the Cappuccino-Indicator. It calculates back the estimated price based on RSI with some optional filters and gives signals for buy and sell.
it works as follows:
- the current RSI value is calculated back to a estiamated market price
- shoutout to some developers who made some functions possible, this was a long work, I cannot find Your sources anymore, I'm sorry. Text me I will publish Your credits. You are awesome and I respect Your work.
- The principle is simple. as suggested by RSI Rookies the market is bullish when in certain RSI Levels, and bearish when in other
- This indicator also combines some trend channels for easier spotting good entries
- The Cappuccino Indicator tries to keep you in a trade as long as possible
- It uses ATR based Trailing SL for you to not get rekt
- It is just a piece of software, You're trading on Your own risk
Have fun.
[JL] ATR Labels with FX Risk Position(USD)I always use ATR to set up SL. So I changed ATR Labels to calculate risk dollars based on curency pairs.
I can not update old ATR Labels title. So I publish this new script.
This pip value calculation is based on USD currency.
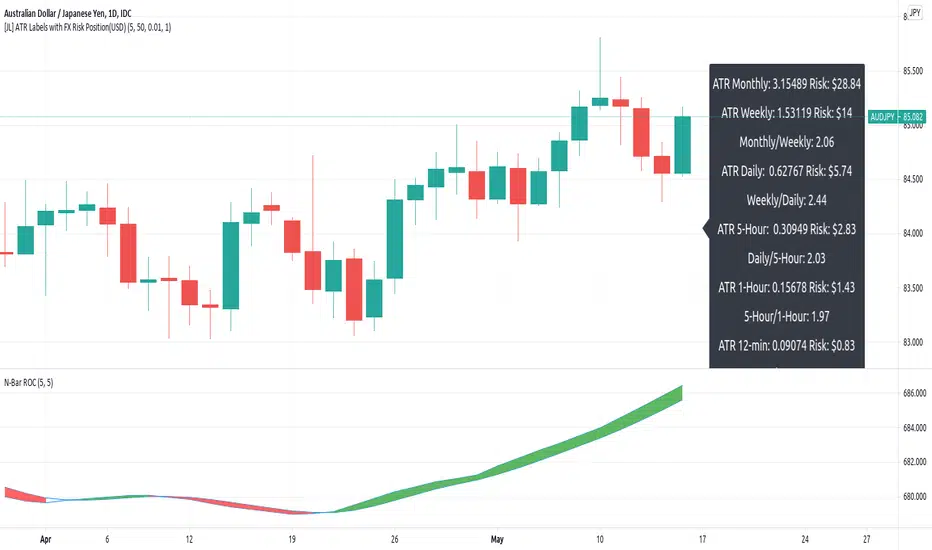
[JL] ATR LabelsJust need to see ATR values when I made Renko script. So I make this script.
I like number 5 so I use 5 to timeframe.
Calculate ATR for the following:
- Monthly
- Weekly
- Daily
- 5-Hour
- 1-Hour
- 12-Min
Label default displayed on right side and middle of 50 bars.

Position Sizing w/ ADR&ATR TrackingScript to use for position sizing based on portfolio size, max position, and max loss inputs. The option to use custom entry and stop are available, but default to last price for entry, and Low of Day (LoD) for stop. The ATR % is a measure of the low of day to current price as a percentage move.
Credit to LonesomeTheBlue for the base code on position sizing and TheScrutiniser/GlinckEastwoot for ADR formula
-Nelgoth, best of luck

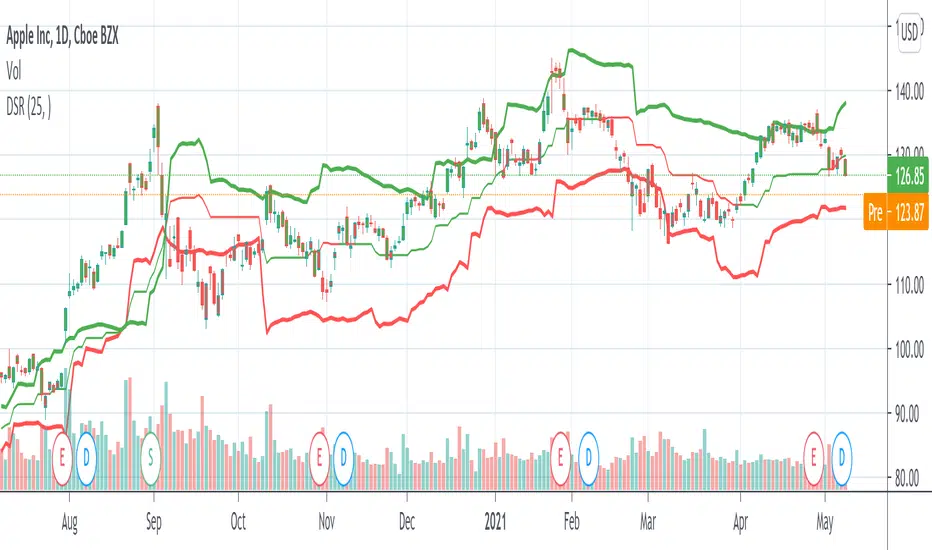
Dynamic Support And Resistance [CC]The Dynamic Support And Resistance Indicator was created by Mike Siroky (Stocks and Commodities pgs 14-18) and this is a handy indicator that will show you useful support and resistance levels no matter how the stock is doing right now. I have color coded the middle line to show buy and sell signals so buy when the line turns green and sell when it turns red.
Let me know if there are any other indicators you want me to publish!
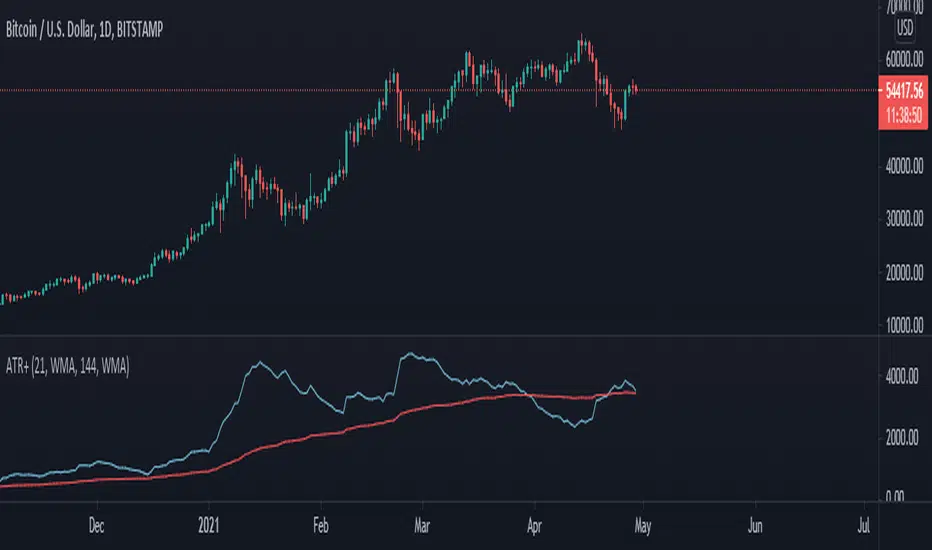
[kai]mATRThis indicator is for calculating the volatility of any interval
mTR (green line): TR is extended to calculate multiple bars at once with magnification setting.
mATR (red line): ATR is extended to calculate multiple bars at once with magnification setting.
dev (blue line): standard deviation
If you turn on "divide source" in the settings, it will be the price volatility.
dev will be the same as BBW
このインジケーターは任意の区間のボラリティを計算するための物です
mTR(緑線) : TRを倍率設定で複数のバーをまとめて計算する用に拡張したものです
mATR(赤線) : ATRを倍率設定で複数のバーをまとめて計算する用に拡張したものです
dev(青線) : 標準偏差
設定で「divide source 価格変動率」をONにすると価格変動率になります
devはBBWと同じになります

(JS) Interchanging ATR & VWAP BandsOkay so this is pretty simple, but I think it's a great tool for day trading especially. I just took the default VWAP and Keltner channel scripts and combined them together.
The top option allows you to choose which one you'd prefer to use, "Use ATR instead of VWAP" .
The next options, "ATR Source", "KC Length", and "ATR Length" are the parameters for the ATR Bands.
"Number of Bands" allows you to choose how many bands you'd like to be on display (you can choose 1-8).
"Use Expoential MA" and "Band Style" are more default parameters from Keltner Channels used to set up the ATR Bands.
The "ATR Bands" are just stacked Keltner Channels separated by 1 ATR each, whereas the "VWAP Bands" are separated by standard deviation just like the default script from Trading View.
In these example chart, you can see the weekly VWAP with 8 deviation bands and 5 ATR bands with Keltner Channels.

Double Average True Range - Taylor V1Double ATR Line, Assist on Trend, Volume and Unnormal Price Movement.
- Fast Line ATR
- Slow Line ATR
1) Able to Change The ATR = Period
2) Able to Change The ATR = Moving Average Type
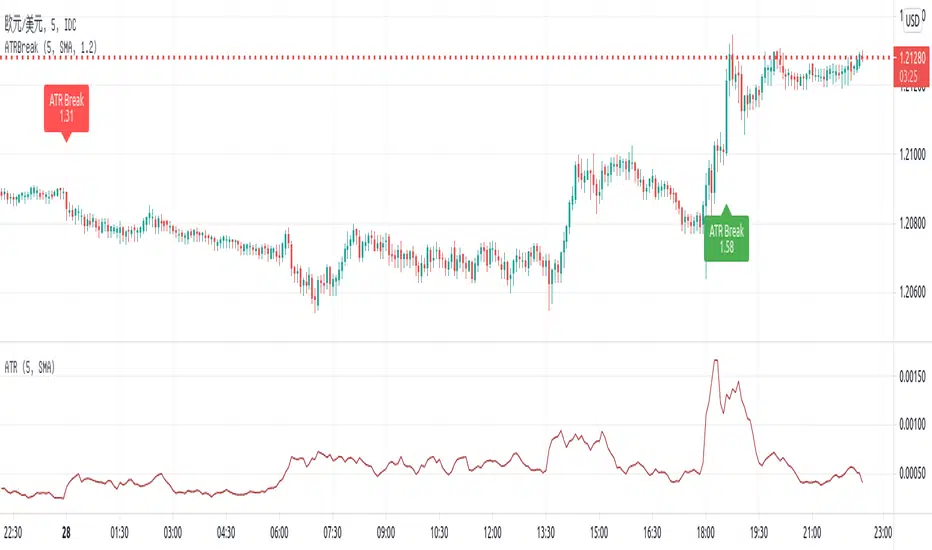
ATR Break on chartThis script is putting one of my old trading method, ATR Break, on chart.
It used to win many times in Dukascopy strategy contest a few years ago.
Pine script is quite easy to learn and very powerful. So I coded it to have a quick view for ATR break on chart.
The rule is simple:
- Current close - open / Previous ATR(5) > alertlevel (1.2), long signal
- Current open - close / Previous ATR(5) > alertlevel (1.2), short signal
The script will display label on the chart with the value of abs(close - open) / Previous ATR(5) to feel the strength.
I used to use the method on 5-min even 1-min chart. SL for 200 points and TP for 5-10 points
Average Trading Range Percentage
Average high/low trading range for the current timeframe.
Daily high/low trading range.

Baus BandsThe Baus Bands are a simplified version of another one of my trend following indicators, the Neapolitan Bands. This version only shows the trend trading zones in green and red. An additional 21 EMA with an ATR band was added as part of my own trend trading rules using these bands.
How do I read this indicator?
Is the blue band between and not touching the green or red clouds? The condition is ranging.
Is the blue band touching the green cloud? The condition is a bullish trend.
Is the blue band touching the red cloud? The condition is a bearish trend.
The trend trading rules are exactly the same as the default Neapolitans, but include an extra condition.
A trend has started once 2 conditions are met:
Price has entered either trending cloud.
The 21 EMA ATR band in blue is within the same cloud.
With those conditions met, if you expect the trend to continue, trade pull-backs to the blue band in the direction of the trending cloud.
Isn't this just a 21 EMA trading pull-backs strategy?
No. The 21 EMA alone is not sufficient in my opinion to define a range or trend technically. Always buying the 21 EMA pull-back, especially in a range, is not a great strategy by itself unless you've already identified price as trending. Baus Bands adds that trend identification.
Why make this?
Baus Bands show the conditions I personally use for catching trends and identifying ranges with these indicators, and shows only the information I use.
What's the purpose of the ATR band around the 21 EMA?
Sometimes price will open and close below the 21 EMA and cause some technical analysts will say the trend is over. I added the ATR specifically to get a volatility based, upper and lower bound range around the 21 EMA. that way I have an acceptable price range where price could move past the 21 EMA and still keep a trend valid using similar rules. I then saw that so long this ATR band (not the 21 EMA itself) was touching those trending clouds, then the trend has a good chance of continuing as long as that was true.

Roc & Atr
Roc & Atr Orders
My indicator, where I compare the 20 bar change percentage with the 14 bar atr band, I hope it will be useful to everyone. the green zones can be interpreted as BUY and the red zone as SELL zone. In graphs with high motion and low atr, the channel narrowing can be interpreted as BUY and the channel opening as SELL.
No indicator shows you the right way ... The best way is your own thoughts

ATR Daily Levels Band NakitxuAverage True Range
What Is the Average True Range (ATR)?
The average true range (ATR) is a technical analysis indicator, that measures market volatility by decomposing the entire range of an asset price for that period.
The true range indicator is taken as the greatest of the following: current high less the current low; the absolute value of the current high less the previous close; and the absolute value of the current low less the previous close.
The ATR is then a moving average, generally using 14 days, of the true ranges.
This script is an especial request of a TradingView user.
Shows 5 levels based on ATR daily, plotted in wherever timeframe you are using:
level 1: prv day ATR + prv day close
level 2: prv day ATR + prv day high
level 3: level 2 - prv day ATR
level 4: prv day close - prv day ATR
level 5: prv day low - prv day
Only show the levels if you are in a timeframe daily or lower than daily.


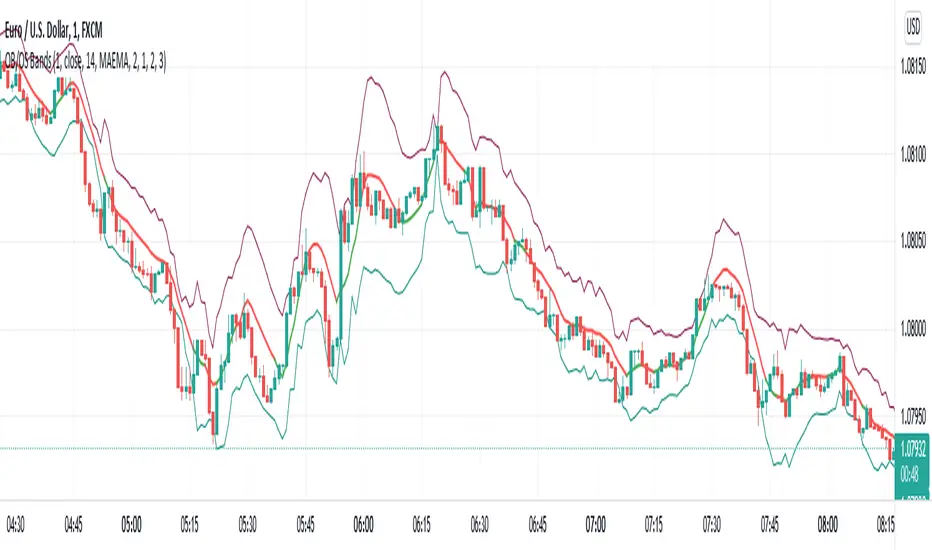
Overbought/Oversold BandsThe basis of this script is my "Hybrid Overbought/Oversold Detector" which uses many different oscillators to confirm overbought/oversold conditions. The main idea is to generate higher and lower bands around the desired moving average using an average of the volatility (ATR) and the standard deviation (StDev), of course by interfering detected overbought/oversold condition.
Simply put, the more the asset become overvalued/undervalued, the tighter the channel would be and every breakout of the bands announces a return back into the channel in near future.
By default, the multiplier of the standard deviation in the indicator settings is set to 2 which means only less than 5% of price actions would appear outside the bands. Also the default multiplier of the ATR is set to 3 which leads to some similar result, but to achieve more strict results setting StDev multiplier to 3 and ATR multiplier to 4 would be useful.
The type of the central moving average could be picked up from 6 different types which are:
- SMA (Simple Moving Average)
- EMA (Exponential Moving Average)
- HMA (Hull Moving Average)
- LSMA (Least Squares Moving Average)
- TMA (Triangular Moving Average)
- MAEMA (My Personalized Momentum Adjusted EMA)
The latter one leads to a useful combination of the channel with the momentum.
Also the script has multi-timeframe features and the user could apply calculations from other time frames to the current chart.
Hope the idea would be helpful!
Advanced Average True RangeThis indicator allows you to improve your stop loss placement. It displays two lines based on the ATR ( Average True Range ), an upper line based on the current price + ATR and a lower line based on the current price - ATR. The ATR is multiplied by 2 but you can change this in the indicator settings.

Dziwne MFI Overlay (with highlight)It is simply your traditional MFI , except that your 50 line became the actual price.
Why and how could it be useful? This indicator helps to spot more easily and efficiently divergences .
You could also use it for trend reversals as you usually do with your 50 line, but I would suggest to set a higher length for the MFI, like 155 or something like that.
