Ticker SummaryTicker Summary provides at-a-glance summary information about a ticker near the current bar on the chart:
P/E ratio
Fwd P/E ratio
PEG ratio
Floating shares vs. total shares outstanding
% of trading volume that was short over the last 3 days
Average True Range (ATR) over last 14 days
There are a few less common items of information:
How many ATR multiples the ATR is extended over the last 10 bars. This gives an idea of how far the stock is currently extended.
"R-frequency", explained below.
An optional "ATR Reticule" is shown near the price. This is useful for traders that use ATR as a guideline for price targets and stop losses. On the left is the # of ATRs the stock is currently above the session open. On the right is the # of ATRs the stock is extended above the 10-bar moving average.
R-frequency: a measure of liquidity relevant to your own trading size. It is the frequency at which 1-R of your trading account is traded for a stock. Formula:
(1-R worth of shares) / (average dollar value traded per second), where:
"1-R worth of shares" is how many shares you would buy for a stop loss of -1 ATR, with max risk dollar value based on the Balance and Max Risk % indicator options.
"Average dollar value traded per second" is the 14-day average of (avg(high, low and close) * daily volume)
R-frequency of a second or less is very liquid. If the value is higher (for example, over 60 seconds) the stock is less liquid and you may have some trouble filling limit orders quickly.
Média de Amplitude de Variação (ATR)

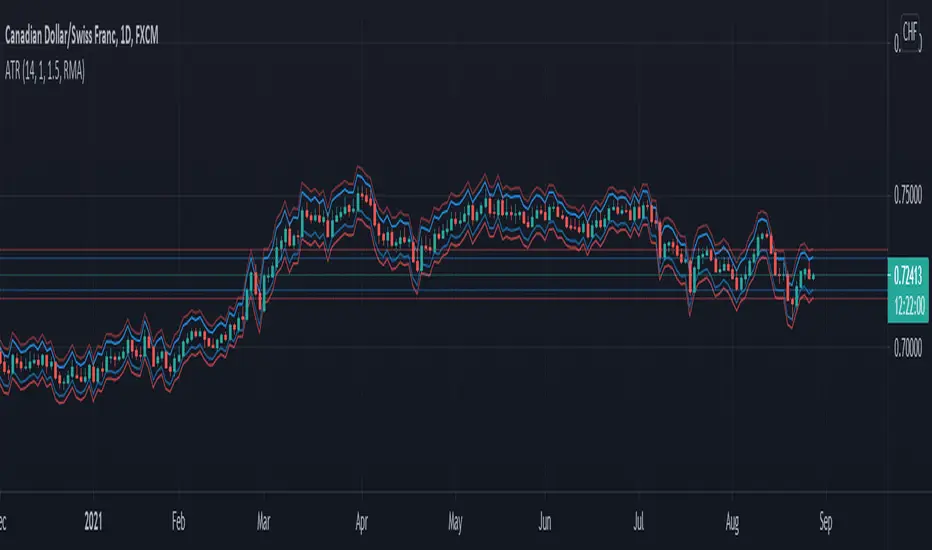
NNFX ATRBefore I begin I want to mention:
1. This is an indicator specially made for NNFX traders who use the ATR rule of ATR1x for Take Profit and ATR1.5x for Stop Loss
2. It is a product of combining the in-built ATR and Dillon Grech's ATR ()
The indicator:
1. It can be used for a quick look using the lines to see instead of calculating whether price hit a TP or SL. However I have kept the Main ATR for those who want to record the ATR into the spreadsheet when back testing or forward testing
2. When placing a buy/long order, TP is blue and appears above price, SL is red and appears below price
3. When placing a sell/short order, TP is blue and appears below price, SL is red and appears above price
4. The Main ATR, which is yellow, is way below price because I didn't want the chart to be overwhelmed by a 5th line in the middle of 2 TPs and SLs aka make the chart look claustrophobic
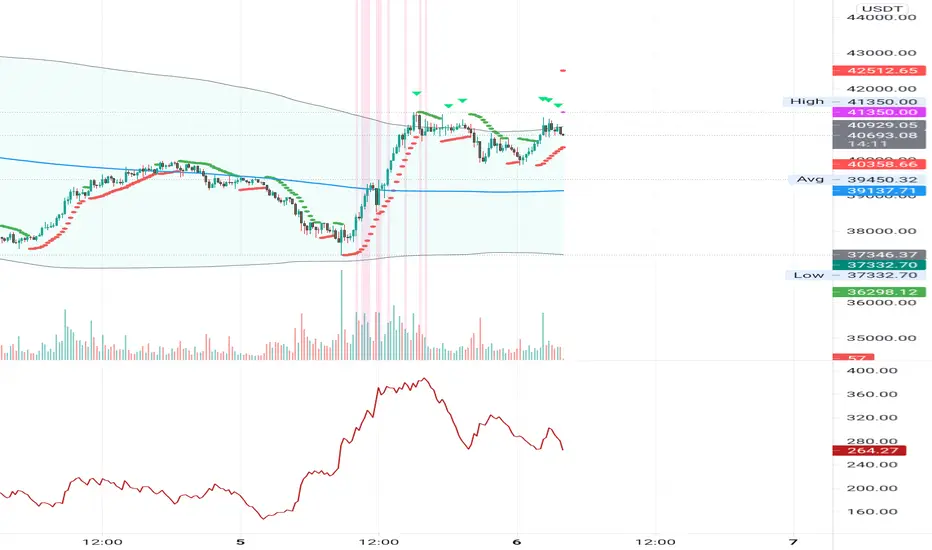
ATR Start & Stop BotThis script is using Average True Range (ATR) and works very well on the Bitcoin 4 hour timeframe to determine when to stop and start your bots.
It has a very similar visual to the EMA RSI Indicator found here:
This 'ATR Start & Stop Bot' is better because it has less confusion during sideways market movement.
As an example - You are using 3commas and have a Composite bot setup with several alt coins, you can use this indicator with the ' Stop bot ' alert to disable your composite bot from taking trades at times when the market is on a trend that looks in the red.
Alternatively you can use the ' Start bot ' alert to turn your bot back on during the green uptrends.
Using this indicator with these alerts on the Bitcoin 4-Hour chart add a great layer of automation to your already existing bots.
Credits:
Original 'ATR Stops' indicator belong to the user failathon and that script is found here:
Also credits to Dradian for the alert additions.

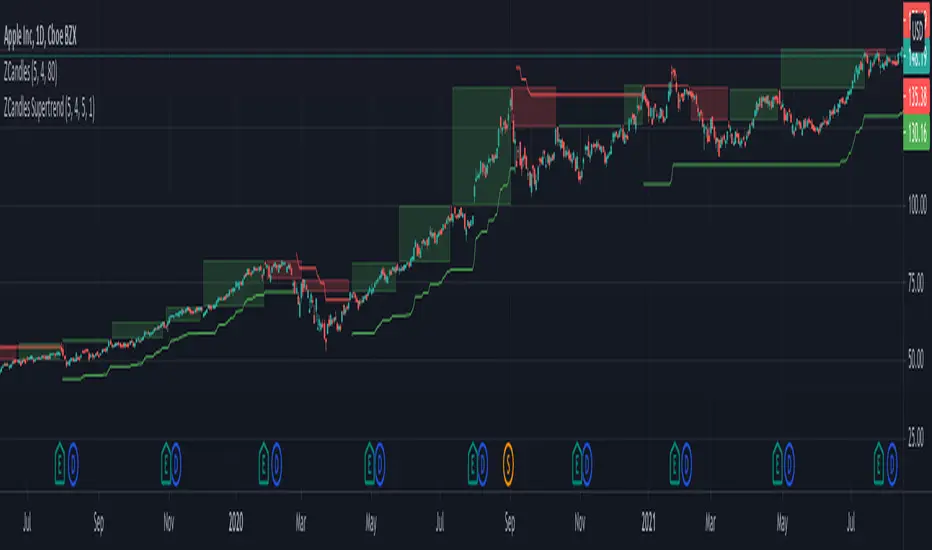
Zigzag Candles SupertrendHere it is, as promised, supertrend based on Zigzag candles.
Earlier scripts on the Zigzag Candles expedition are here:
Zigzag-Candles
Zigzag-Candles-MA
Zigzag candles parameters Length and CandleSize remain as is. Along with this, we also add MALength and AtrMult to calculate ATR based on the new candles and to use it to derive supertrend.
UseZigzagCandles - selecting this will apply supertrend on zigzag candles and ignore the actual price candles completely.
UseClosePrices - Uses close price as base instead of high/low. Can be used in both modes of price candles and zigzag candles.
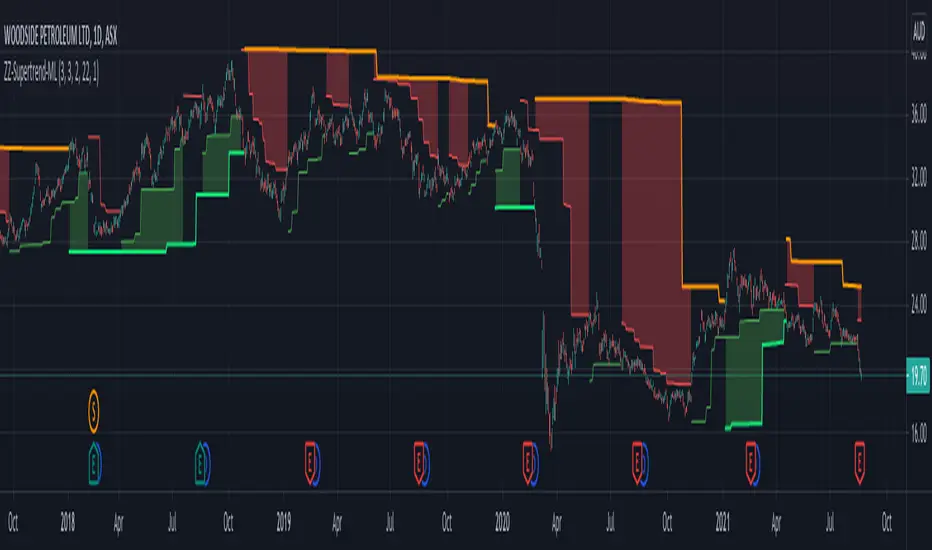
Multilevel ZigZag SupertrendVery much similar to :
I have slightly changed code to accommodate multiple zigzags. Also removed possibility of external source to keep it simple.
Indicator shows 2 Level zigzag based supertrends. Second zigzag used is multi level zigzag and hence, this acts as higher timeframe filter and can be considered as overall trend bias.
REMORA StrategyStrategy:
Finding entry using pullback or Buy On Dip method.
This indicator using EMA line and ATR strategy to find best entry.
EMA line consist of :
EMA 20, EMA 50 and EMA 90.
Entry signal when candle rebound on EMA line and rocket signal appeared.
Exit when "SL" signal appeared.

Dr.Om's SuperTrend IndicatorRiding along the Super Trend -
Super Trend Bullish candle (STBullCandle) is a candle where low is lower than supertrend and close is greater than super trend.
Conditions for going Long -
1. High of current candle should be higher than high of STBullCandle.
2. We can consider 1 or 2 candles after the STBullCandle for this condition.
3. If filterRsi is enabled, then we make an additional check of RSI being greater than the weighted moving average.
4. Should not be holding an existing long position
5. SuperTrend should be positive
Super Trend Bearish candle (STBearCandle) is a candle where high is higher than supertrend and close is lower than super trend.
Conditions for going Short -
1. Low of current candle should be lower than low of STBullCandle.
2. We can consider 1 or 2 candles after the STBearCandle for this condition.
3. If filterRsi is enabled, then we make an additional check of RSI being lower than the weighted moving average.
4. Should not be holding an existing short position
5. SuperTrend should be negative.
If holding long, EXIT LONG Position Criteria -
1. SL would be if close is lesser than the ST candle low
2. Direction of ST becomes Negative
3. If Reward to Risk ratio is given, then exit if target is achieved.
If holding short, EXIT SHORT Position Criteria -
1. SL would be if close is higher than the ST candle high
2. Direction of ST becomes +ve
3. If Reward to Risk ratio is given, then exit if target is achieved.

Average Zigzag Range (AZR)Here is an attempt calculate Average Zigzag Range (AZR). This can be used similar to ATR. Using AZR instead of ATR for trailing stop calculation may yield better outcome in trend trading.
Logic is simple.
Calculate zigzag based on ZigzagLength
Calculate distance between each zigzag pivots
Calculate simple moving average of last MALength pivots
Use DoubleMA option to further smooth AZR using a Secondary Moving Average

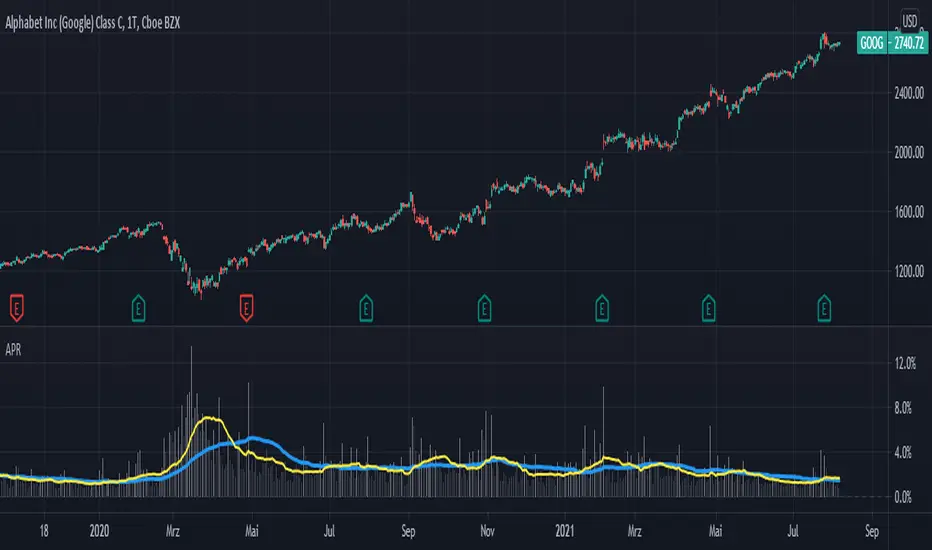
Averange Percentage RangeThis Indicator displays the two different Averange Percentage Range (APR) and the Percentage Range of the current bar.
If the long term APR is over the short term it indicates a lower volatility otherwise a higher.
You can set the calculation method, rising for (highest/lowest-1)*-100 or falling for (lowest/highest-1)*-100.
Relative ATR by Alejandro PThis is an indicator that expands the usability of ATR into a strong and valuable volatility indicator.
With the Relative ATR you can quickly see when the current market volatility its extremely low, normal or extremely high in relation to the past.
This provides traders with a much more valuable insight as to the current market conditions than normal volatility indicators.
A trader can, for example, decide to filter its strategy to only periods where the ATR is in its lowest percentiles which tells him that the market is unusually "quiet" recently and there may be a big breakout about to happen.
Or a trader can use the filter to avoid getting whipsawed with their strategy by avoiding taking trades when the Relative ATR is at its highest percentiles.

ATR Mark Up/DownThis script looks for a period with increased volatility, as measured by ATR (Average True Range), then it looks for a high or a low in that area.
When price is above EMA (200 is default, can be changed), it looks for the highs and adds multiples of ATR to the high. Default values for multipliers are 3,9 and 27, meaning that the script will show 3xATR level above the high, 9xATR above the high and 27xATR above the high.
When price is below EMA it looks for the lows and subtracts multiples of ATR from the low.The script will show 3xATR level below the low, 9xATR below the low and 27xATR below the low.
Multipliers values can be changed as well, making it a versatile tool that shows potential levels of suppport/resistance based on the volatility.
Possible use cases:
Breakout trading, when price crosses a certain level, it may show potential profit targets for trades opened at a breakout.
Stoploss helper. Many traders use ATR for their stoplosses, 1 ATR below the swing low for long trades and 1 ATR above the swing high for short trades are common values used by many traders. In this case, the Lookback value comes handy, if we want to look maybe at a more recent value for swing high/low point.
The levels shown by this indicator are not guaranteed to be or not to be reached by price, these levels should be used in confluence with other indicators and looked at as a visual helper.
That's all, hope you enjoy it!
PS.
*It does not plot the ATR. I don't know how to do it and IF it can be done
** It does not plot the EMA. If necessary,it can be added in a future update
tr_volThis indicator shows the annualized volatility, computed using the ewma method. It also uses average true range (ATR) as the daily return, rather than the typical close-to-close percentage change. You can uncomment the "comparison" series to see how it compares to the standard deviation, daily log return method. The standard deviation method weights all periods equally and doesn't account for intra-day ranges, meaning it is less responsive to new information than the ewma method and doesn't weight large intra-day moves as heavily.
The long-run median is also displayed. This feature sometimes fails if there are too many bars.

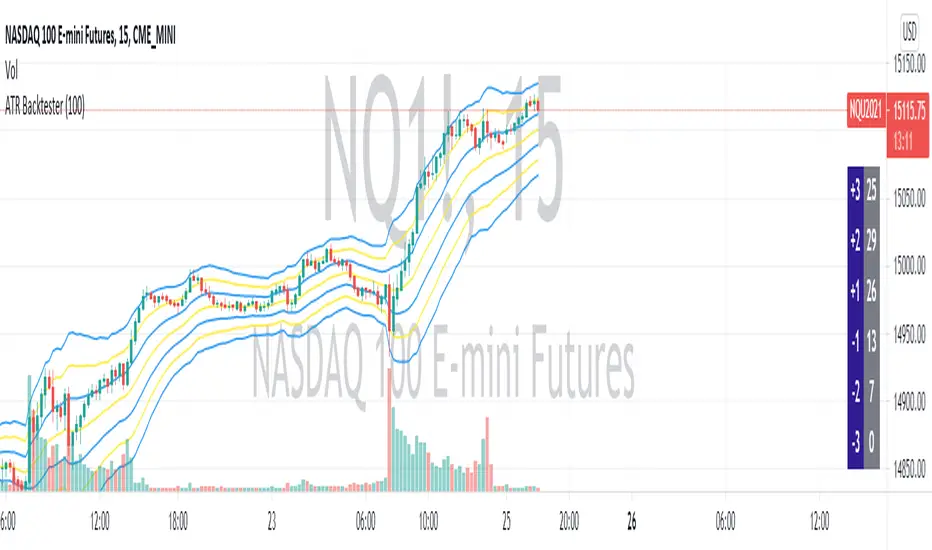
ATR BacktesterATR backtester... input the desired number of bars backwards (I'd recommend 100 or so), and then it'll spit out in the columns on the right side of the screen how many times each ATR was hit. Helps to tell at a glance where bullish and bearish is for the stock. May not be insanely useful since you can just look at the chart, but feel free to use the code yourself for something.
ZigZag SupertrendBack to my favourite supertrend. But, this time on the basis of zigzag pivots.
This is similar to forming supertrend based on pivot high lows - but instead of using pivot poitns, we are using zigzag pivots here.
Zigzag is derived using the same method as this script:
But, have removed labels and display options of zigzag. Older lines are also immediately deleted so that it can work well in lower timeframes without any error. Number of zigzaglines to be kept in memory depends on the parameter History
WaitForConfirmation option when selected only considers the confirmed zigzaglines and will ignore present zigzag line which is forming. This is not going to make much difference as the present zigzag line will be always opposite to low or high it formed and hence will not affect the stop loss levels or reversals.
WaitForClose is for supertrend determination. When checked uses close prices. If unchecked uses highs and lows for supertrend direction update.
ATR parameters allow you to set an adjustment below pivot high lows. This is required because support and resistence are often zones rather than single point. Hence, adds bit more wiggle room for trend continuation and delays frequent reversals on pullbacks.

SD - Average True Range v5 - DoubleSD - Average True Range - Daily Weekly Monthly Yearly v5
It gives ATR intervals as 4 hours, daily, weekly, monthly and yearly. The expectation is to fill the ATR targets within the specified ranges. It can be used to determine target points on charts with a clear direction on the train.
Unlike the previous version, it is provided to use 2 different periods in the same indicator.
Note: Developed based on the source codes of the original SD ADR indicator.

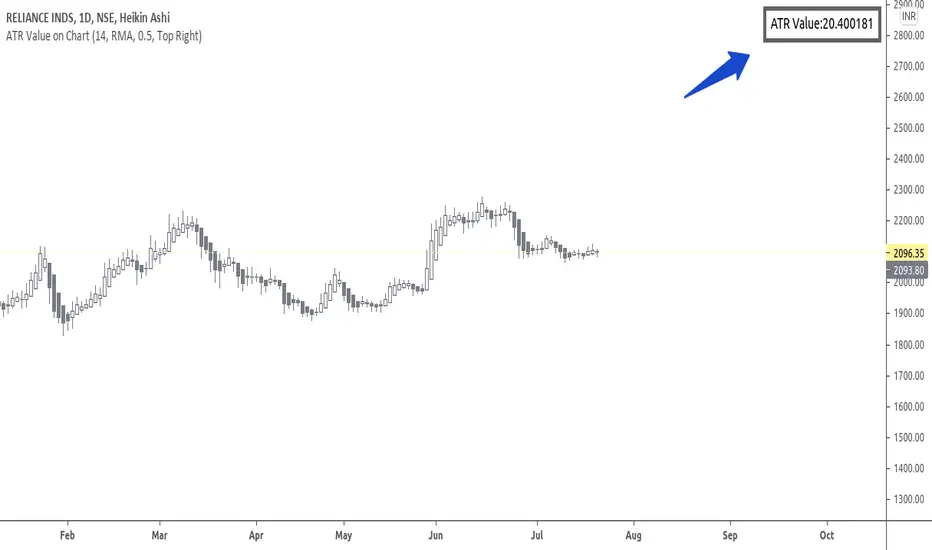
ATR Value on ChartHi Friends & TradingView community.
Greetings to you.
Many traders use ATR to set Stop loss.
The built in ATR indicator plots the ATR values as a line. However, many traders do not want the ATR to be plotted on their charts, but are only interested in the ATR value as such.
This script does that - it just prints the latest ATR with your set Multiplier value on the chart. I have used the built-in ATR indicator and made necessary additions to the code.
I hope this script proves useful to traders.
Queries / feedback welcome.
All the best.
Volatility semaphore Support&Resistance multi timeframe [LM]Hello Traders,
I would like to introduce you volatility semaphore support&resistance levels. The idea is the same as the pivot
semaphore script of mine to spot the importance of support&resistence.
It is little bit different than previous script as it uses different line API than previous volatility support& resistance multi timeframe . You have more control over hat and how many lines are rendered(better to use odd numbers in line count setting as it always finds 2 S/R lines). Also this indicator has setup for contol whether you want wicky candles or no by setting percentage of candle body that is accepted.
I hope you will enjoy it.

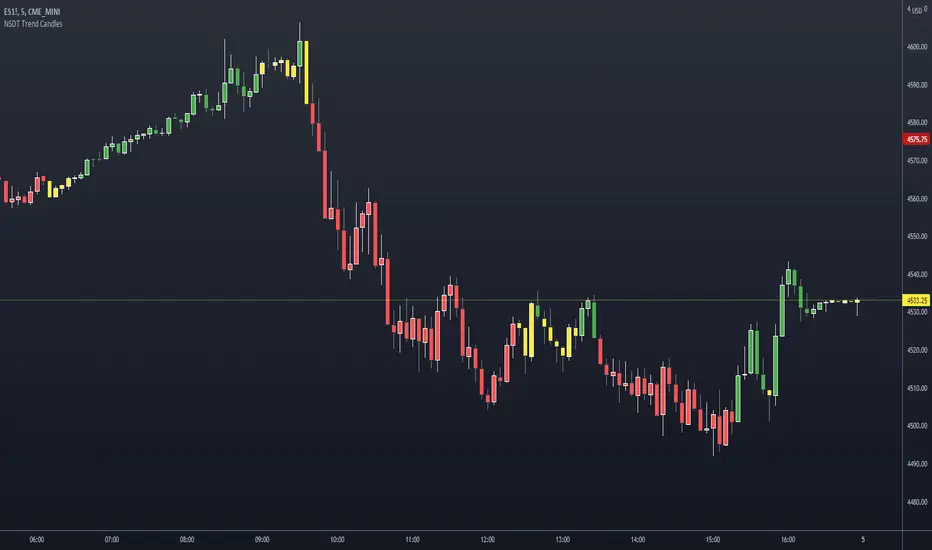
NSDT Trend CandlesThis script changes the color of the candles based on uptrend (green), downtrend (red), neutral/chop (yellow). It uses an ATR and Pivots to determine the direction, or lack of. Since all markets move differently and market volatility changes, you will need to adjust the settings to find a potential match for the day. It's pretty simple to use. Just enter in the direction of the trend and exit (or reverse) when the candle color changes.
Average Daily Range TableThis is the last script to complete Vladimir Poltoratskiy's setup found in his books.
Poltoratskiy argues that you should not take any fractal corridors higher than 50% of the Average Daily Range. To be honest, even 40% is a lot, because then, your target will be 160% ADR away from your entry and one "fracture" just can't be enough to predict moves this big.
I chose a table to visually represent the indicator because it doesn't change its value during the day. It takes far less room on the chart.
There are also two simple moving averages. You may use the as an indicator if the relative volatility as of late is extremely low and in that case, perhaps, expect an increase in the coming days. They are applied to the Average Daily Range, not one day range!

ATR Stop Loss FinderThis Indicator uses Average True Range (ATR) to determine a safe place to put stop losses to avoid being stop hunted or stopped out of a trade due to a tight stop loss. Default multiplier setting is 1.5. For a more conservative stop loss use 2 and for a tighter stop loss use 1. ATR and stop loss prices are displayed in table at bottom of screen. Use high(red) for shorts and low(teal) for longs.

ATR SLHi traders,
As you know, ATR trailing stop is very popular indicator. So I decided to make my own one.
The logic is simple.
If the price is above the RMA(src,len), then put a SL at OPEN - ATR value of that time period
otherwise, put a SL at OPEN + ATR value of that time period.
Stay safe ^^

ADR% / ATR / LoD dist. TableDisplays the following values in a table in the upper right corner of the chart:
ADR%: Average daily range (in percent).
ATR: Average true range (hidden by default).
LoD dist.: Distance of current price to low of the day as a percentage of ATR.
All values are calculated based on daily bars, no matter what time frame you are currently viewing. Doesn't work for time frames >1D, which is why the table is not shown on weekly/monthly charts.
Credit to MikeC / TheScrutiniser and GlinckEastwoot for ADR% formula

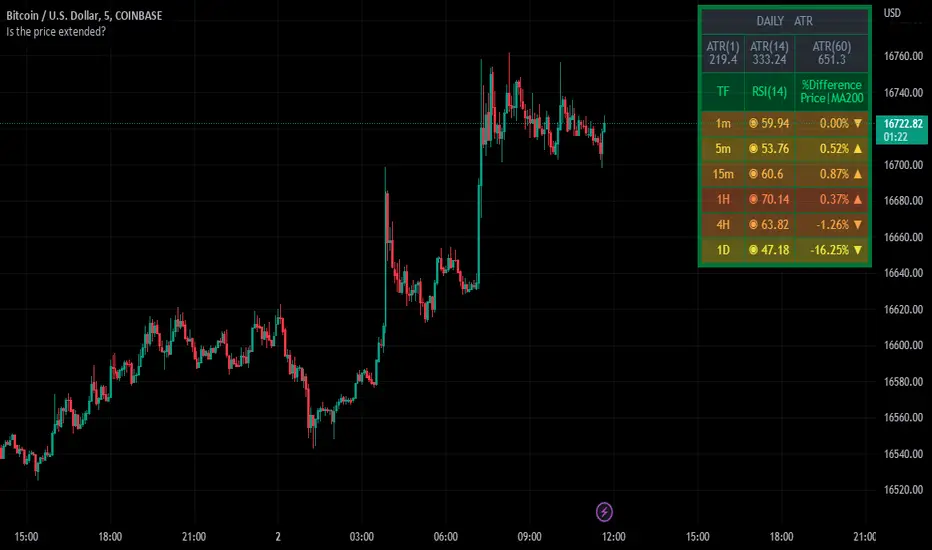
Table Identifies the Price Extensively Using RSI, MA, and ATR ⬤ INDICATOR KEY
⬤ INTRODUCTION
The indicator has presented as a table to show the perspective result of different indicators to help the user identify the status of the price if it’s extended or not. The table starts with the ATR section, which gives out a better look to compare the current day’s candle wide versus the average candle wide of a certain length of period that selected by the user. The second section of the table, showing RSI values at the most common upper timeframes, and the different percentages between the current price and long-term moving average entered by the user.
⬤ INDICATOR OVERVIEW
⬤ FINAL COMMENTS
▸This’s not a trading signal, but it helps to make a trading decision whether to set targets, stop loss, and enter a new trade.
▸If you found this content useful, please consider supporting presented indicators projects through PayPal which mentioned in the signature box, below.
▸ Trade Safe✌️.
⬤ OTHER GREAT INDICATORS CREATED BY MUQWISHI
📈 Muqwishi Volumetric Candle
📈 Support and Resistance For Day Trader | By MUQWISHI