INVITE-ONLY SCRIPT
B&S v3.2
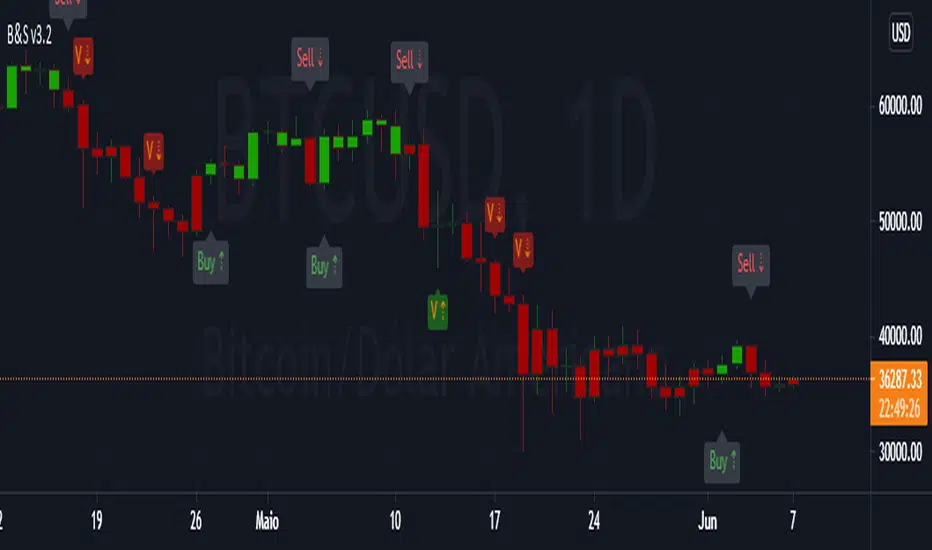
This strategy uses RMA, Moving Average used in RSI , to create the buy and sell signals. It is the exponentially weighted moving average with alpha = 1/length.
IT SHOWS ON THE GRAPH:
Volume (V ⇣/V ⇡) when Market Makers moving smart money.
When 200SMA is above 100SMA (T ⇡) 200SMA is below 100SMA (T ⇣)
HOW TO USE?
If you are trading any asset that is in an uptrend, avoid shorting until the sign (T ⇣) appears followed by the Institutional Volume signal (V ⇣) indicating reversion.
If you are trading any asset that is in a downtrend, avoid long positions until the signal (T ⇡) appears followed by the Institutional Volume signal (V ⇡) indicating reversal.
For long operations use "🕗 360" setting for Daily timeframe.

For Day Trade use "🕗 30" for 1 hour or 30 minutes timeframe.

IT SHOWS ON THE GRAPH:
- Buy: Long position.
- Sell: Short position.
- V ⇣: Institutional volume .
- V ⇡: Institutional volume .
- T ⇣: Downtrend.
- T ⇡: Uptrend.
Volume (V ⇣/V ⇡) when Market Makers moving smart money.
When 200SMA is above 100SMA (T ⇡) 200SMA is below 100SMA (T ⇣)
HOW TO USE?
If you are trading any asset that is in an uptrend, avoid shorting until the sign (T ⇣) appears followed by the Institutional Volume signal (V ⇣) indicating reversion.
If you are trading any asset that is in a downtrend, avoid long positions until the signal (T ⇡) appears followed by the Institutional Volume signal (V ⇡) indicating reversal.
For long operations use "🕗 360" setting for Daily timeframe.
For Day Trade use "🕗 30" for 1 hour or 30 minutes timeframe.
Script sob convite
O acesso a este script é restrito aos usuários autorizados pelo autor e pode requerir pagamento. Você pode adicioná-lo a seus favoritos, mas só poderá utilizá-lo após solicitar permissão e obtê-la do autor. Contate dc_analytics para mais informações, ou siga as instruções do autor abaixo.
O TradingView não sugere pagar por um script e usá-lo, a menos que você confie 100% no seu autor e entenda como o script funciona. Em muitos casos, você pode encontrar uma boa alternativa de código aberto gratuita nos nossos Scripts da Comunidade.
Instruções do autor
″Send me message for more information.
Quer usar esse script no gráfico?
Aviso: por favor leia antes de solicitar acesso.
Aviso legal
As informações e publicações não devem ser e não constituem conselhos ou recomendações financeiras, de investimento, de negociação ou de qualquer outro tipo, fornecidas ou endossadas pela TradingView. Leia mais em Termos de uso.