INVITE-ONLY SCRIPT
NMA indicator
Atualizado
Indicator “NMA”
Class: oscillator/trend deviations
Trading type: intraday
Time frame: 5 min – 60 min
Purpose: search for divergences
Level of aggressiveness: standard
Indicator «NMA» is used to determine the divergence points between current prices and their fair (theoretical, calculated) values. Presence of strong divergence is a signal that prices have entered overbought/oversold zone. This, in turn, is a basis for position opening opposite to the current price dynamics.
Structure of the indicator
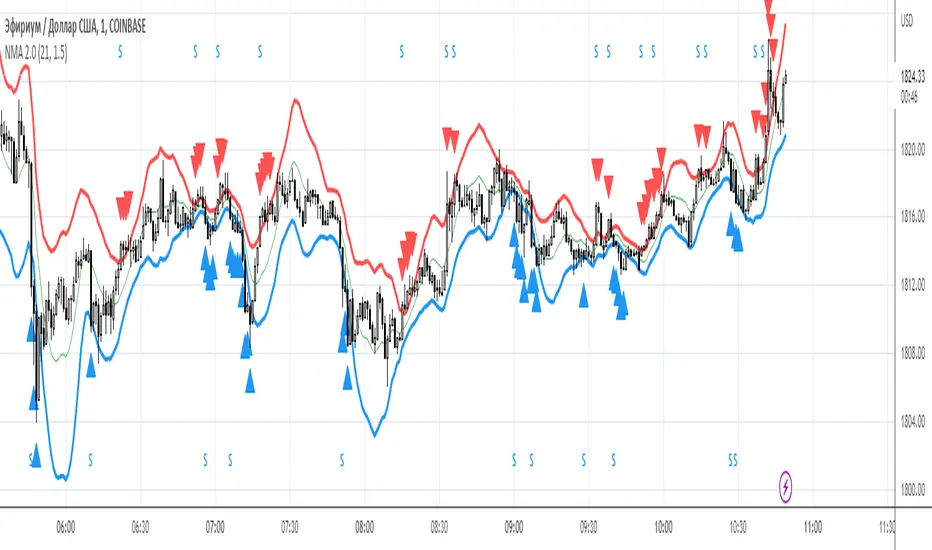
Indicator consists of colored lines and signal triangles, displayed on the chart.
- green line – shows current fair price. When current price is close to this line it means that there are no any significant divergences in the price dynamics. The green line is also a take-profit line – at this price positions should be closed;
- blue line – shows synthetic support level (analogue of the oversold zone), which is changing dynamically. From blue line “buy” trades are recommended;
- red line – shows synthetic resistance level (analogue of the overbought zone), which is changing dynamically. From red line “sell” trades are recommended;
To ease the trading process indicator displays on the chart “buy” and “sell” signals in form of blue/red triangles.
Input parameters of the indicator
To set up the indicator a number of input parameters are used:
- AR period (period of indicator, by default = 21) – is used to calculate fair (theoretical) prices based on linier auto regression model.
- Number of deviations (the number of standard deviations, by default = 1.5) – this parameter regulates the level of aggressiveness of the indicator. The bigger the parameter is the less signals are generated, but higher the quality if these signals is.
Rules of trading
Indicator can be used on the any time frame. For the intraday purposes periods from 5 min to 1 hour are recommended.
The general rules are as follows:
- if price crosses the blue line up-down – this is a signal that current price has fallen too much relatively its theoretical value (analogue of the oversold zone);
- if price crosses the red line down-up – this is a signal that current price has risen too much relatively its theoretical value (analogue of the overbought zone);
- “buy” from the blue line. For additional indication blue triangle is displayed on the chart;
- “sell” from the red line. For additional indication red triangle is displayed on the chart;
- take-profits are set near the green line
- stop-losses are not provided. Positions are closed after the opposite signal appears.
Class: oscillator/trend deviations
Trading type: intraday
Time frame: 5 min – 60 min
Purpose: search for divergences
Level of aggressiveness: standard
Indicator «NMA» is used to determine the divergence points between current prices and their fair (theoretical, calculated) values. Presence of strong divergence is a signal that prices have entered overbought/oversold zone. This, in turn, is a basis for position opening opposite to the current price dynamics.
Structure of the indicator
Indicator consists of colored lines and signal triangles, displayed on the chart.
- green line – shows current fair price. When current price is close to this line it means that there are no any significant divergences in the price dynamics. The green line is also a take-profit line – at this price positions should be closed;
- blue line – shows synthetic support level (analogue of the oversold zone), which is changing dynamically. From blue line “buy” trades are recommended;
- red line – shows synthetic resistance level (analogue of the overbought zone), which is changing dynamically. From red line “sell” trades are recommended;
To ease the trading process indicator displays on the chart “buy” and “sell” signals in form of blue/red triangles.
Input parameters of the indicator
To set up the indicator a number of input parameters are used:
- AR period (period of indicator, by default = 21) – is used to calculate fair (theoretical) prices based on linier auto regression model.
- Number of deviations (the number of standard deviations, by default = 1.5) – this parameter regulates the level of aggressiveness of the indicator. The bigger the parameter is the less signals are generated, but higher the quality if these signals is.
Rules of trading
Indicator can be used on the any time frame. For the intraday purposes periods from 5 min to 1 hour are recommended.
The general rules are as follows:
- if price crosses the blue line up-down – this is a signal that current price has fallen too much relatively its theoretical value (analogue of the oversold zone);
- if price crosses the red line down-up – this is a signal that current price has risen too much relatively its theoretical value (analogue of the overbought zone);
- “buy” from the blue line. For additional indication blue triangle is displayed on the chart;
- “sell” from the red line. For additional indication red triangle is displayed on the chart;
- take-profits are set near the green line
- stop-losses are not provided. Positions are closed after the opposite signal appears.
Notas de Lançamento
Version with AlertsScript apenas com convite
O acesso a este script é restrito aos usuários autorizados pelo autor e pode requerir pagamento. Você pode adicioná-lo a seus favoritos, mas só poderá utilizá-lo após solicitar permissão e obtê-la do autor. Contate Trade24Fx para mais informações, ou siga as instruções do autor abaixo.
TradingView does not suggest paying for a script and using it unless you 100% trust its author and understand how the script works. In many cases, you can find a good open-source alternative for free in our Community Scripts.
Instruções do autor
″Please address all questions about this indicator (including access to it) in private messages.
Quer usar esse script no gráfico?
Aviso: por favor leia antes de solicitar acesso.
Авторские индикаторы
bit.ly/2oBvkHY
Больше информации на нашем ютьюб-канале
youtube.com/channel/UCYEOurJfasXWyYnrriGwsqQ
bit.ly/2oBvkHY
Больше информации на нашем ютьюб-канале
youtube.com/channel/UCYEOurJfasXWyYnrriGwsqQ
Aviso legal
As informações e publicações não devem ser e não constituem conselhos ou recomendações financeiras, de investimento, de negociação ou de qualquer outro tipo, fornecidas ou endossadas pela TradingView. Leia mais em Termos de uso.