Operator Entry Detector and their Support and resistance Zones
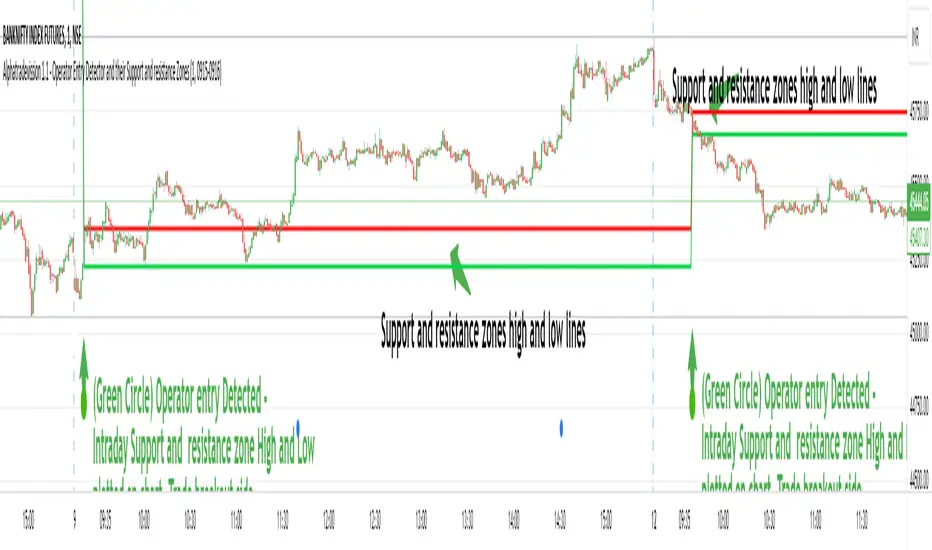
The indicator is designed to detect specific market conditions related to operator entries and identify support and resistance zones.
Developed by Sarangdhar, this version is labeled as Alphatradevission 1.1
Key Features:-
Utilizes Heavy Volume Change to identify operator entry signals.
Displays support and resistance zones based on the Specific Calculated Volume Length values.
Highlights potential trend reversal or continuation zones using specific chart patterns and Specific Calculated Volume Change Length values
Settings:
Option to hide/show lines and labels for a cleaner chart presentation.
Defines regular trading hours and considers the 9:15 AM candle for analysis.
Visual Elements:
Uses various shapes and colors to represent different market scenarios:
Circles for the 9:15 AM candle to Understand New Trading Session Started.
Triangles for Volume change signals.
Different colors for distinct VC levels.
Green diamonds with numbering for identified trend starter signals.
Signals and Zones:
Detects specific VC values to signal potential trend starters, small sharks, and big sharks.
Labels support and resistance zones based on the 9:15 AM candle and VC signals.
Highlights reversal and trend continuation zones based on Specific VC length given in script.
Customization:
Traders can adjust input parameters to suit their preferred timeframes and market conditions.
The option to hide/show lines and labels allows users to customize the indicator display.
How users can make profit using this script ?
Usage Tips: Chart 1 min time frame
Users may consider potential trend changes or continuations based on identified VC signals.
Support and resistance zones can be utilized for setting stop-loss or take-profit levels.
1. That zone will act as support and resistance through out day.
5. Trade Breakout direction of that range. As range break market trend start in that direction.
6. If Candle range High break - traders view must be buying the stock with stoploss just below the candle range and vice versa.
Note :-
1. Avoid Fake breakout of candle range . take entry after breakout confirmation. You can take entry after retest to that candle range.
Giving below example of reversal and trend continuation zones high low line by hiding intraday Support and resistance zone lines you can costomize it as per use,
https://www.tradingview.com/x/zabQNvLZ/
Script sob convite
Somente usuários aprovados pelo autor podem acessar este script. Você precisará solicitar e obter permissão para usá-lo. Normalmente, essa permissão é concedida após o pagamento. Para obter mais detalhes, siga as instruções do autor abaixo ou entre em contato diretamente com I_am_Operator_Detector.
A TradingView NÃO recomenda pagar ou usar um script, a menos que você confie totalmente em seu autor e entenda como ele funciona. Você também pode encontrar alternativas gratuitas e de código aberto em nossos scripts da comunidade.
Instruções do autor
Aviso legal
Script sob convite
Somente usuários aprovados pelo autor podem acessar este script. Você precisará solicitar e obter permissão para usá-lo. Normalmente, essa permissão é concedida após o pagamento. Para obter mais detalhes, siga as instruções do autor abaixo ou entre em contato diretamente com I_am_Operator_Detector.
A TradingView NÃO recomenda pagar ou usar um script, a menos que você confie totalmente em seu autor e entenda como ele funciona. Você também pode encontrar alternativas gratuitas e de código aberto em nossos scripts da comunidade.