PROTECTED SOURCE SCRIPT
Atualizado Linear Momentum and Performance Indicators by Akram Elsherbini
This indicator pack is simply the adaptation of the formulas proposed in the Linear Momentum and Performance Indicators Thesis by Akram Elsherbini.
Elsherbini, Akram. (2019). Linear Momentum and Performance Indicators. 10.13140/RG.2.2.20941.18407.
https://www.researchgate.net/publication/340915305_Linear_Momentum_and_Performance_Indicators
Thesis Abstract:
“Momentum is not the same as velocity. A lot of words are used in physics, and they all have precise meanings in physics, although they may not have such precise meanings in everyday language. Momentum is an example, and we must define it precisely.” (Feynman, 1965). Since momentum indicators have been introduced to the field of technical analysis, many analysts use momentum when they refer to price acceleration. As the study of price movement is the main concern of technical analysts, the laws of motion, including Newton’s second law, are applied to prices to clarify the difference between price acceleration, momentum and force. This paper will attempt to adjust the price momentum and force concepts introduced by Welles Wilder and Alexander Elder, respectively. By introducing the concept of linear momentum, new indicators will emerge to dissect the market performance into six main elements: market’s force, pressure, strength, power, intensity, and dynamic strength. This will lead to a deeper insight about market action. The leading performance indicators can be used simultaneously to identify price turning points and filter irrelevant divergences. The linear momentum and the new performance indicators should make a significant change in categorising several indicators in technical analysis.
I highly recommend you read through the Thesis, (15 pages) if you want a deeper understanding of how these indicators function and how you could possibly use them along with other indicators.
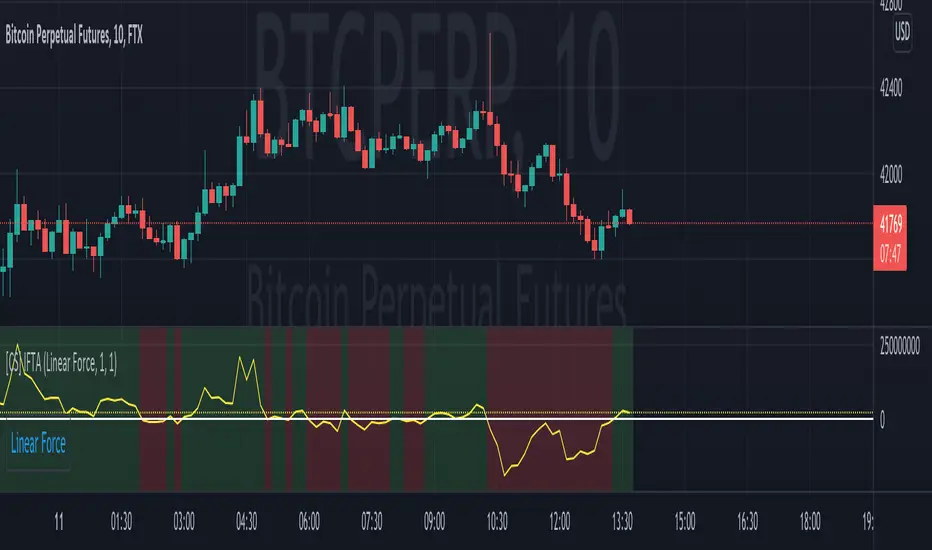
This indicator plots as an Oscillator about 0.
The pack contains the 12 different Oscillators types, only one can be active at a time, so if you want to show multiple, just place duplicates of this indicator on your chart and simply change between types in the settings:
Elsherbini, Akram. (2019). Linear Momentum and Performance Indicators. 10.13140/RG.2.2.20941.18407.
https://www.researchgate.net/publication/340915305_Linear_Momentum_and_Performance_Indicators
Thesis Abstract:
“Momentum is not the same as velocity. A lot of words are used in physics, and they all have precise meanings in physics, although they may not have such precise meanings in everyday language. Momentum is an example, and we must define it precisely.” (Feynman, 1965). Since momentum indicators have been introduced to the field of technical analysis, many analysts use momentum when they refer to price acceleration. As the study of price movement is the main concern of technical analysts, the laws of motion, including Newton’s second law, are applied to prices to clarify the difference between price acceleration, momentum and force. This paper will attempt to adjust the price momentum and force concepts introduced by Welles Wilder and Alexander Elder, respectively. By introducing the concept of linear momentum, new indicators will emerge to dissect the market performance into six main elements: market’s force, pressure, strength, power, intensity, and dynamic strength. This will lead to a deeper insight about market action. The leading performance indicators can be used simultaneously to identify price turning points and filter irrelevant divergences. The linear momentum and the new performance indicators should make a significant change in categorising several indicators in technical analysis.
I highly recommend you read through the Thesis, (15 pages) if you want a deeper understanding of how these indicators function and how you could possibly use them along with other indicators.
This indicator plots as an Oscillator about 0.
The pack contains the 12 different Oscillators types, only one can be active at a time, so if you want to show multiple, just place duplicates of this indicator on your chart and simply change between types in the settings:
- Liner Force / Momentum Index
- Pressure Index
- Strength Index
- Power Index
- Intensity Index
- Dynamic Strength Index
- Integral Liner Force / Momentum Index
- Integral Pressure Index
- Integral Strength Index
- Integral Power Index
- Integral Intensity Index
- Integral Dynamic Strength Index
Notas de Lançamento
Special shoutout to CryptoStatistical for the code of the formula's simplified, I had been researching the thesis and adapting the formulas from it but after finishing I had discovered CryptoStatistical had already adapted the formulas from the thesis in a cleaner manner. I have adopted the code and expanded upon it to add more utility and functions over time.tradingview.com/v/Qhc5U3kV/
Added a switch to enable the use of ATR values, which affects the output of only some of the oscillators.
Extract from the thesis referenced at the top of this indicator description, the bottom of page 14.
"True Range
Developed by J. Welles Wilder, the true range TR is a set
of conditions that helps in measuring volatility. Stocks and
commodities are frequently subject to gaps that occur when the
instrument opens below or above the previous session’s range.
Indicators based on the high–low range would fail to capture
volatility from gaps. Wilder created the true range to capture
this missing volatility."
"The H-L part in the pressure, intensity, strength, and dynamic
strength indicators can be substituted by the TR conditions
based on the traders need. "
The thesis mentions TR but I have adopted the Average True Range.
Notas de Lançamento
Added a check condition to warn if the exchange in the chart being used is providing volume dataNotas de Lançamento
Fixed typo for the selection of IntegralDynamicStrength indicatorNotas de Lançamento
- Added ability to apply various Moving average types to indicators
- Added ability to change Timeframe
Script protegido
Esse script é publicada como código fechado. No entanto, você pode gerenciar suas escolhas de bate-papo. Por favor, abra suas Configurações do perfil
Aviso legal
As informações e publicações não se destinam a ser, e não constituem, conselhos ou recomendações financeiras, de investimento, comerciais ou de outro tipo fornecidos ou endossados pela TradingView. Leia mais nos Termos de Uso.