OPEN-SOURCE SCRIPT
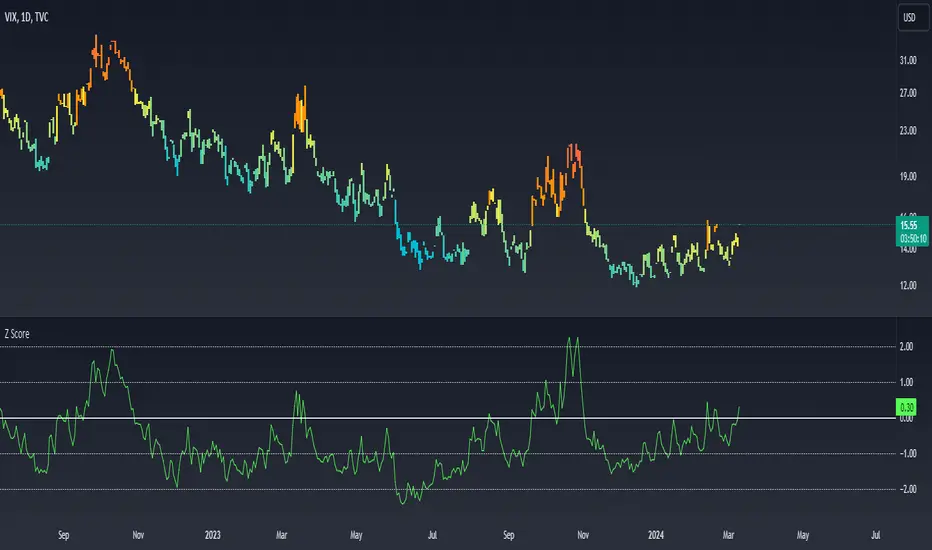
Atualizado Z Score

What Is Z-Score?
Z-score is a statistical measurement that describes a value's relationship to the mean of a group of values. Z-score is measured in terms of standard deviations from the mean. If a Z-score is 0, it indicates that the data point's score is identical to the mean score. A Z-score of 1.0 would indicate a value that is one standard deviation from the mean. Z-scores may be positive or negative, with a positive value indicating the score is above the mean and a negative score indicating it is below the mean.
CBOE Volatility Index
VIX is the ticker symbol and the popular name for the Chicago Board Options Exchange's CBOE Volatility Index, a popular measure of the stock market's expectation of volatility based on S&P 500 index options. It is calculated and disseminated on a real-time basis by the CBOE, and is often referred to as the fear index or fear gauge. To summarize, VIX is a volatility index derived from S&P 500 options for the 30 days following the measurement date, with the price of each option representing the market's expectation of 30-day forward-looking volatility. The resulting VIX index formulation provides a measure of expected market volatility on which expectations of further stock market volatility in the near future might be based
Z Scores of VIX
When the Z-scored VIX indicator exceeds the +2 standard deviation mark, the system forecasts mean reversion and decreasing volatility and the possibility of an upward trend in S&P500.
When the Z-scored VIX indicator falls below -2 standard deviations, the system predicts future increasing volatility and the possibility of a downward trend in S&P500.
Notas de Lançamento
Heat MapScript de código aberto
Em verdadeiro espírito do TradingView, o criador deste script o tornou de código aberto, para que os traders possam revisar e verificar sua funcionalidade. Parabéns ao autor! Embora você possa usá-lo gratuitamente, lembre-se de que a republicação do código está sujeita às nossas Regras da Casa.
Aviso legal
As informações e publicações não se destinam a ser, e não constituem, conselhos ou recomendações financeiras, de investimento, comerciais ou de outro tipo fornecidos ou endossados pela TradingView. Leia mais nos Termos de Uso.
Script de código aberto
Em verdadeiro espírito do TradingView, o criador deste script o tornou de código aberto, para que os traders possam revisar e verificar sua funcionalidade. Parabéns ao autor! Embora você possa usá-lo gratuitamente, lembre-se de que a republicação do código está sujeita às nossas Regras da Casa.
Aviso legal
As informações e publicações não se destinam a ser, e não constituem, conselhos ou recomendações financeiras, de investimento, comerciais ou de outro tipo fornecidos ou endossados pela TradingView. Leia mais nos Termos de Uso.