Rate of Change Suite [QuantraSystems]
Introduction
The "Rate of Change Suite" (𝓡𝓸𝓒 𝓢𝓾𝓲𝓽𝓮) refines traditional RoC concepts by incorporating additional elements that provide more nuanced views of market trends, potential reversions, and momentum shifts.
Its main benefits are that it allows traders to detect momentum changes and frontrun trend shifts.
The suite is designed to be highly adaptable, catering to various trading styles, timeframes and market conditions. It is comprised of 3 metrics:
The RoC base line plots the rate of change, the Signal Histogram to confirm trends, and the Signal Confirmation Oscillator to inform reversal probabilities. For the early detection of trend shifts, the 𝓡𝓸𝓒 𝓢𝓾𝓲𝓽𝓮 is a comprehensive tool for the toolkit of modern traders.
A core component of the 𝓡𝓸𝓒 𝓢𝓾𝓲𝓽𝓮 is the ability to apply its processing techniques to any other indicator found on TradingView - essentially leveraging the signal power of existing analysis methods. This is achieved by modifying the ‘Source’ input.
Legend
𝓡𝓸𝓒 base line: The primary component of the suite, the RoC Line, offers a direct view of market momentum. An upward trending RoC line informs the potential for a long position, while a downward trend might signal the opportunity for a short position. Both include a secondary confirmation by the color change of the line itself. The Heikin Ashi transformed version of the RoC line provides greater resistance to rapid movements, or outliers.
Signal Histogram: This feature works in tandem with the base RoC Line, providing an additional third confirmation of trends. A rising histogram supports the presence of an upward trend. Conversely, a declining histogram aligns with downward trends.
Signal Confirmation Oscillator: This dotted-line is crucial for detecting peaks or troughs in market momentum: These can precede reversals or shifts in the prevailing trend. Traders can use this signal to anticipate and prepare for potential changes quicker than others.
Case Study
Primarily a tool to follow trends, the 𝓡𝓸𝓒 𝓢𝓾𝓲𝓽𝓮 implies much more – you can trade with a confirmed trend signal entry and a mean reversion signal for the exit:
Here we see two practical cases of the 𝓡𝓸𝓒 𝓢𝓾𝓲𝓽𝓮 on the 1h BTC chart.
In the first scenario, the trader waits for three confirmations from the indicator.
- The 𝓡𝓸𝓒 baseline to lead the run and looks for confirmation two and three:
- 𝓡𝓸𝓒 base line color shifts
- and the Signal Histogram follows past the null midline.
The trader has adjusted their risk beforehand and enters the long position.
The 𝓡𝓸𝓒 𝓢𝓾𝓲𝓽𝓮 shows traders when to take profit:
- The Signal Confirmation Oscillator (SCO, dotted line) moves beyond the 𝓡𝓸𝓒 baseline and the Signal Histogram. The trader can take 50% of the profit already.
- The trader waits patiently, and if the SCO reverses, the rest of the position is closed.
The same works inversely for the second trade, which successfully frontran the decline shortly after.
Recommended Settings
Day Trading (1H chart)
Length: 30
Smooth Length: 10
Display Variant: Classic
Choose Mode: Trend Following
Investing – Follow Trend (1D chart)
Default settings
Notes
Quantra Standard Value Contents:
The Heikin-Ashi (HA) candle visualization smoothes out the signal line to provide more informative insights into momentum and trends. This allows earlier entries and exits by observing the indicator values transformed by the HA.
Various visualization options are available to adjust the indicator to the user’s preference: Aside from HA, a classic line, or a hybrid of both.
A special feature of Quantra’s indicators is that they are probabilistically built - therefore they work well as confluence and can easily be stacked to increase signal accuracy.
To add to Quantra's indicators’ utility we have added the option to change the price bars’ colors based on different signals:
Choose Mode for Coloring
- Trend Following (Indicator above mid line counts as uptrend, below is downtrend)
- Extremes (Everything beyond the SD bands is highlighted to signal mean reversion)
- Candles (Color of HA candles as barcolor)
- Reversions (Only for HA) (Reversion Signals via the triangles if HA candles change trend while beyond the SD bands, high probability entries/exits)
- Divergence Sensitivity: Quantra’s 𝓡𝓸𝓒 𝓢𝓾𝓲𝓽𝓮 is finely tuned to detect divergences, a key feature for identifying possible trend reversals.
- Trend Following and Reversions: Primarily a tool for trend following, the 𝓡𝓸𝓒 𝓢𝓾𝓲𝓽𝓮 is also adept at spotting potential reversions and slowdowns in momentum.
- Range Trading Compatibility: In its Heikin Ashi Candles mode, the suite becomes particularly effective for range trading strategies.
- High Customizability: Traders can customize the suite with various visualization options, including classic line representation, HA transformation, and bar coloring. These can be based on Heikin Ashi Candles or Trend Following approaches, providing flexibility to adapt to different trading scenarios.
Methodology
The 𝓡𝓸𝓒 𝓢𝓾𝓲𝓽𝓮 is built on a foundation of functions that define and calculate the Rate of Change. They employ a variety of moving average types (SMA, EMA, DEMA, TEMA, WMA, etc.) which can be selected to optimize the RoC line.
- A bespoke function to calculate Heikin-Ashi values is engineered to offer a more consistent view of the trend.
- The Signal Histogram is derived by mathematically processing the base RoC signal. The Signal Confirmation Oscillator is based on a modified formula, adjusted to align with the RoC dynamics.
- With a range of customization options for its visual presentation, including color schemes and display styles, the 𝓡𝓸𝓒 𝓢𝓾𝓲𝓽𝓮 is designed to cater to both trend following indications as well as finding signals for mean reversion trades. This multifaceted approach enables the 𝓡𝓸𝓒 𝓢𝓾𝓲𝓽𝓮 to allow the trader to combine signals of both types to de-risk his positions.
Added 'Compressed Signal Mode'.
- Cleaned up input menu for more uniform structure.
- Added signal table.
- Added standard deviation bands.
- Added trending and mean reverting regime calculator. This utilizes the midline cross of the signal confirmation oscillator.
- Updated alert name.
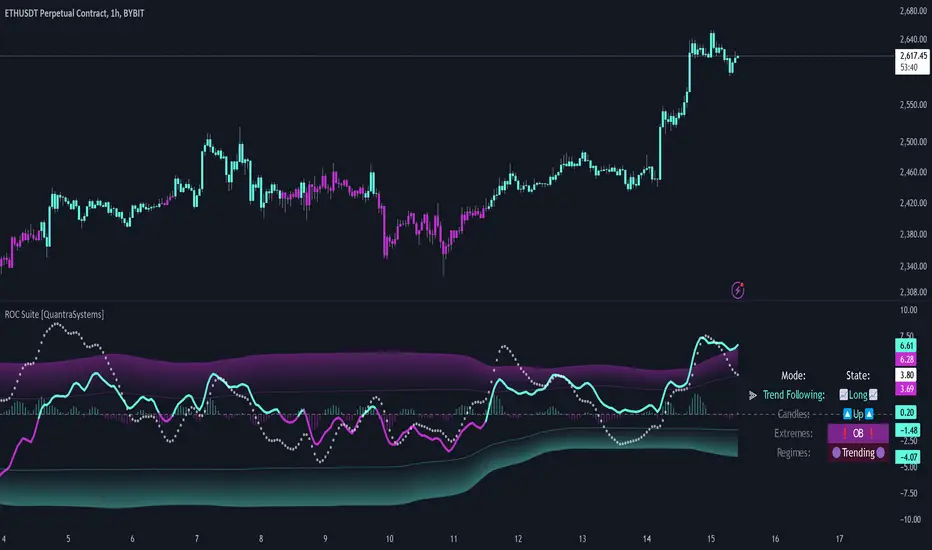
- Added the below image - in line with the Regime Calculator update above.
Script sob convite
Somente usuários aprovados pelo autor podem acessar este script. Você precisará solicitar e obter permissão para usá-lo. Normalmente, essa permissão é concedida após o pagamento. Para obter mais detalhes, siga as instruções do autor abaixo ou entre em contato diretamente com Cryptosystems.
A TradingView NÃO recomenda pagar ou usar um script, a menos que você confie totalmente em seu autor e entenda como ele funciona. Você também pode encontrar alternativas gratuitas e de código aberto em nossos scripts da comunidade.
Instruções do autor
neither are any signals from us or our indicators.
Join the Cryptosystems Community (formerly QuantraSystems)👇
discord.gg/FMZDM3bZ9T
Aviso legal
Script sob convite
Somente usuários aprovados pelo autor podem acessar este script. Você precisará solicitar e obter permissão para usá-lo. Normalmente, essa permissão é concedida após o pagamento. Para obter mais detalhes, siga as instruções do autor abaixo ou entre em contato diretamente com Cryptosystems.
A TradingView NÃO recomenda pagar ou usar um script, a menos que você confie totalmente em seu autor e entenda como ele funciona. Você também pode encontrar alternativas gratuitas e de código aberto em nossos scripts da comunidade.
Instruções do autor
neither are any signals from us or our indicators.
Join the Cryptosystems Community (formerly QuantraSystems)👇
discord.gg/FMZDM3bZ9T