INVITE-ONLY SCRIPT
Kenji
Kenji
Class: average analysis
Trading type: intraday
Time frame: 4H
Purpose: work in trend
Level of aggressiveness: standard
Indicator «Kenji» is a brand new look on the average analysis. The main problem of most of the trading strategies and indicators based on average analysis is a number of false signals in case of flat (for example frequent crossing of the averages, frequent changes of the average direction etc). As the result average analysis can’t show its real power and effectiveness.
Indicator «Kenji» using a unique algorithm allows avoiding the most common traps of the average analysis and significantly increasing the quality of the signals.
It generates signals for the comfort trading in local trend. Indicator provides information both on timing of the position entry and timing on profit fixation. Also it helps to determine the level of aggressiveness of the concrete signal. This makes «Kenji» indicator a very useful tool for amateur and experienced traders.
Structure of the indicator
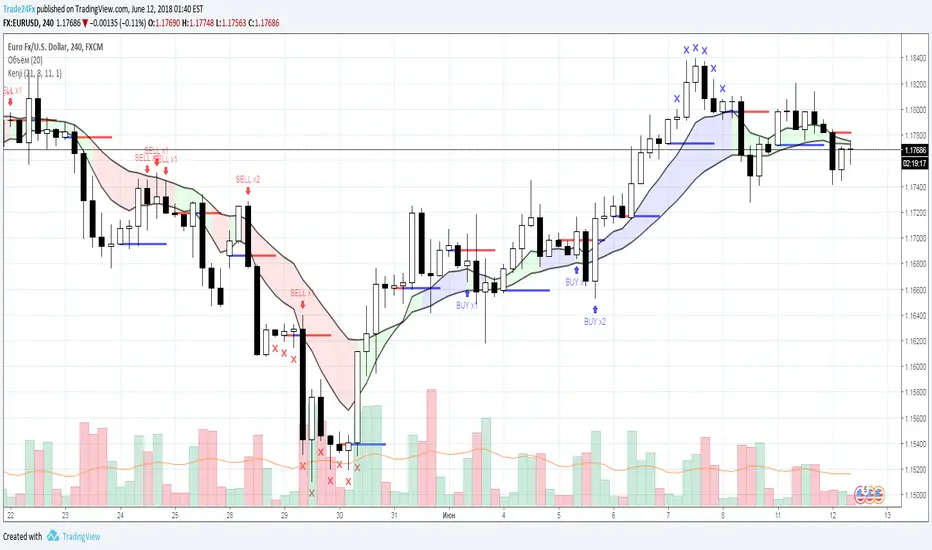
Indicator consists of colored zones and level lines:
- colored zones (marked blue, red or green) – used for color identification of the trading possibilities and to detect the entry points;
- level lines (marked red and blue depending on current price direction) – used for color identification of the fact that current price direction is up/down.
To ease the trading process indicator displays on the chart “buy” and “sell” signals. These signals are divided into 2 groups: standard (trading with basic lot size) and aggressive (trading with double basic lot size). Take-profit zones are also displayed on the chart. They are represented with the blue/red x-crosses. Red x-crosses show zones where profits on “sell” positions should be taken. Blue x-crosses show zones where profits on “buy” positions should be taken.
Input parameters of the indicator
To set up the indicator a number of input parameters are used:
- Slow Average Period – period of the slow average. The bigger the period is the more conservative reaction of the average for the price changes are.
- Fast Average Period - period of the fast average. The bigger the period is the more conservative reaction of the average for the price changes are.
- Correlation Period – period used in correlation analysis to calculate the level of interconnection between the averages.
Rules of trading
When signal “buy”/”sell” is appeared on the chart corresponding trade should be opened.
Profit for “sell” position should be fixed when the red x-cross appears on the chart. Profit for “buy” position should be fixed when the blue x-cross appears on the chart.
Class: average analysis
Trading type: intraday
Time frame: 4H
Purpose: work in trend
Level of aggressiveness: standard
Indicator «Kenji» is a brand new look on the average analysis. The main problem of most of the trading strategies and indicators based on average analysis is a number of false signals in case of flat (for example frequent crossing of the averages, frequent changes of the average direction etc). As the result average analysis can’t show its real power and effectiveness.
Indicator «Kenji» using a unique algorithm allows avoiding the most common traps of the average analysis and significantly increasing the quality of the signals.
It generates signals for the comfort trading in local trend. Indicator provides information both on timing of the position entry and timing on profit fixation. Also it helps to determine the level of aggressiveness of the concrete signal. This makes «Kenji» indicator a very useful tool for amateur and experienced traders.
Structure of the indicator
Indicator consists of colored zones and level lines:
- colored zones (marked blue, red or green) – used for color identification of the trading possibilities and to detect the entry points;
- level lines (marked red and blue depending on current price direction) – used for color identification of the fact that current price direction is up/down.
To ease the trading process indicator displays on the chart “buy” and “sell” signals. These signals are divided into 2 groups: standard (trading with basic lot size) and aggressive (trading with double basic lot size). Take-profit zones are also displayed on the chart. They are represented with the blue/red x-crosses. Red x-crosses show zones where profits on “sell” positions should be taken. Blue x-crosses show zones where profits on “buy” positions should be taken.
Input parameters of the indicator
To set up the indicator a number of input parameters are used:
- Slow Average Period – period of the slow average. The bigger the period is the more conservative reaction of the average for the price changes are.
- Fast Average Period - period of the fast average. The bigger the period is the more conservative reaction of the average for the price changes are.
- Correlation Period – period used in correlation analysis to calculate the level of interconnection between the averages.
Rules of trading
When signal “buy”/”sell” is appeared on the chart corresponding trade should be opened.
Profit for “sell” position should be fixed when the red x-cross appears on the chart. Profit for “buy” position should be fixed when the blue x-cross appears on the chart.
Script sob convite
O acesso a este script é restrito aos usuários autorizados pelo autor e pode requerir pagamento. Você pode adicioná-lo a seus favoritos, mas só poderá utilizá-lo após solicitar permissão e obtê-la do autor. Contate Trade24Fx para mais informações, ou siga as instruções do autor abaixo.
O TradingView não sugere pagar por um script e usá-lo, a menos que você confie 100% no seu autor e entenda como o script funciona. Em muitos casos, você pode encontrar uma boa alternativa de código aberto gratuita nos nossos Scripts da Comunidade.
Instruções do autor
″
Quer usar esse script no gráfico?
Aviso: por favor leia antes de solicitar acesso.
Авторские индикаторы
bit.ly/2oBvkHY
Больше информации на нашем ютьюб-канале
youtube.com/channel/UCYEOurJfasXWyYnrriGwsqQ
bit.ly/2oBvkHY
Больше информации на нашем ютьюб-канале
youtube.com/channel/UCYEOurJfasXWyYnrriGwsqQ
Aviso legal
As informações e publicações não devem ser e não constituem conselhos ou recomendações financeiras, de investimento, de negociação ou de qualquer outro tipo, fornecidas ou endossadas pela TradingView. Leia mais em Termos de uso.