OPEN-SOURCE SCRIPT
Advanced 5-Candle Pattern Predictor
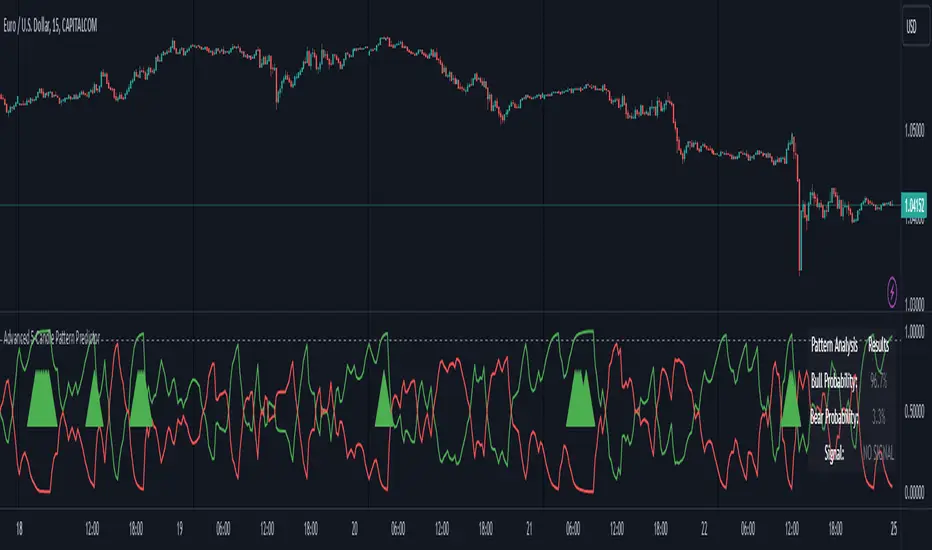
This advanced indicator uses machine learning techniques and multiple analysis methods to predict potential bullish or bearish moves based on the last 5 candles. It combines volume analysis, momentum indicators, and pattern recognition to generate high-probability trading signals.
Key Features:
- Sophisticated 5-candle pattern analysis
- Volume-confirmed signals
- Multi-timeframe trend analysis
- Advanced momentum tracking
- Real-time probability scoring
How It Works:
The indicator analyzes multiple factors for each candle:
1. Body/wick ratios and relationships
2. Volume correlation with price movement
3. Momentum shifts between candles
4. Trend strength and direction
5. Technical indicator confluence (RSI, MACD)
Signals are generated only when:
- Pattern probability exceeds the threshold (default 75%)
- Volume confirms the movement
- Multiple technical factors align
- Trend strength supports the direction
Parameters:
- Probability Threshold: Minimum probability required for signal generation (0.6-1.0)
- Volume Threshold: Required volume multiplication factor (1.0-3.0)
Visual Feedback:
- Green line: Bullish probability
- Red line: Bearish probability
- Gray dashed line: Threshold level
- Large green/red arrows: High-probability signals
- Detailed information table showing current probabilities and signals
Usage Tips:
1. Higher threshold values generate fewer but potentially more reliable signals
2. Look for confluence between probability scores and volume confirmation
3. Use in conjunction with your regular trading strategy for confirmation
4. Best used on timeframes 15m and above for more reliable patterns
Warning:
Past performance does not guarantee future results. This indicator should be used as part of a complete trading strategy with proper risk management.
Script de código aberto
Em verdadeiro espírito do TradingView, o criador deste script o tornou de código aberto, para que os traders possam revisar e verificar sua funcionalidade. Parabéns ao autor! Embora você possa usá-lo gratuitamente, lembre-se de que a republicação do código está sujeita às nossas Regras da Casa.
Aviso legal
As informações e publicações não se destinam a ser, e não constituem, conselhos ou recomendações financeiras, de investimento, comerciais ou de outro tipo fornecidos ou endossados pela TradingView. Leia mais nos Termos de Uso.