OPEN-SOURCE SCRIPT
MTF Volume Flow Indicator
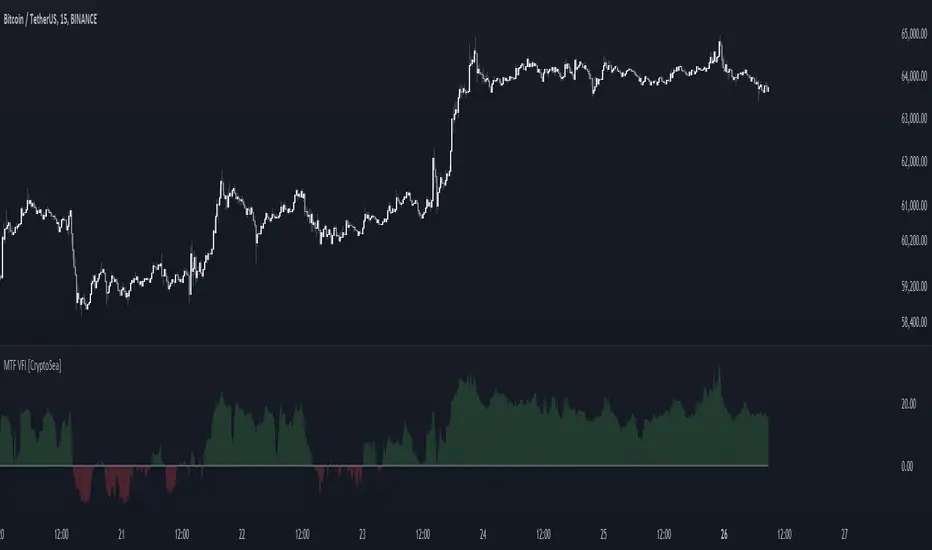
The MTF Volume Flow Indicator (MTF VFI) is an advanced and versatile tool that enhances market analysis by tracking the flow of volume across multiple timeframes. By integrating volume flow with multi-timeframe analysis, this indicator provides traders with a comprehensive understanding of market trends, momentum, and potential reversals.

Key Features

How It Works

Alerts
Application
The MTF Volume Flow Indicator (MTF VFI) by CryptoSea is an essential tool for traders who seek to gain a deeper understanding of market trends and volume dynamics across multiple timeframes. Its advanced features and customization options make it a valuable addition to any trader’s toolkit.
Key Features
- Multi-Timeframe Volume Flow Analysis: The MTF VFI computes the Volume Flow Indicator across various timeframes, ranging from 1 minute to 1 month. This multi-timeframe analysis enables traders to observe and compare volume flow dynamics across different time horizons, offering deeper insights into market behavior.
- Customizable VFI Settings: The indicator includes configurable VFI parameters such as length, coefficient, and volume cutoff, allowing users to tailor the analysis to different market conditions and trading strategies. This flexibility ensures that the indicator remains relevant across diverse market environments.
- Signal Line and Delta Calculations: The script features a signal line derived from the VFI and calculates the delta values (the difference between VFI and the signal line). These delta values are essential for identifying potential buy or sell signals and are presented as histograms for easy visual interpretation.
- Cumulative Delta with Dynamic Bands: The indicator introduces cumulative delta, a powerful tool that combines average and median VFI values to provide a clearer picture of market sentiment. Two standard deviation bands are plotted around the cumulative delta, offering a range within which price movements are likely to remain. These bands are smoothed using a 21-period EMA, providing a more refined view of market volatility.
- Multi-Timeframe and Analysis Tables: The MTF VFI includes optional tables that display VFI, signal line, and delta values across all selected timeframes. Additionally, an analysis table presents key statistical metrics such as the highest, lowest, average, standard deviation, range, and median VFI values. These tables provide a concise summary of market conditions, aiding in strategic decision-making.
- Dynamic Display Options: The indicator offers extensive customization options, allowing traders to display or hide elements such as delta histograms, delta bands, and tables. This ensures that users can focus on the most relevant information for their trading strategy.
- Neutral Candle Coloring Option: Traders can enable neutral candle colors, where bearish candles are gray and bullish candles are white. This feature helps to reduce noise and maintain focus on the overall trend and volume flow analysis.
How It Works
- Volume Flow Indicator Calculation: The VFI is calculated using a combination of typical price, volume, and the standard deviation of price changes. The indicator smooths the VFI based on user preferences, allowing traders to adjust the sensitivity of the analysis to better match their trading style.
- Multi-Timeframe Integration: The script pulls VFI calculations from multiple timeframes, providing a holistic view of market trends. By analyzing VFI across different timeframes, traders can detect alignments or divergences in volume flow that might indicate trend strength or weakness.
- Cumulative Delta and Dynamic Bands: The cumulative delta is computed by combining the average and median VFI values. Dynamic two-standard-deviation bands are plotted around this cumulative delta, providing upper and lower bounds for expected price movements. These bands are further smoothed with a 21-period EMA, enhancing their effectiveness in volatile markets.
- Delta Analysis and Histogram Display: The difference between the VFI and its signal line (delta) is calculated and displayed as histograms. This visual representation helps traders quickly assess momentum and identify potential reversals or trend continuations. The cumulative delta is color-coded dynamically based on its direction, adding an extra layer of visual clarity.
Alerts
- VFI Crossover Alerts: The indicator includes customizable alerts that notify traders when the VFI crosses above or below its signal line. These alerts are crucial for catching potential trend reversals or continuation signals, even when the trader is not actively monitoring the chart.
- Customizable Alert Conditions: Traders can tailor alert conditions to their preferred timeframes and VFI settings, ensuring that the notifications they receive are relevant and timely for their specific trading strategies.
Application
- Trend Identification and Confirmation: The MTF VFI aids in identifying and confirming trends by analyzing volume flow across multiple timeframes. This capability is particularly useful for detecting trends that may not be visible on a single timeframe.
- Momentum and Divergence Analysis: By comparing VFI and delta values across timeframes, and analyzing cumulative delta with dynamic bands, traders can gain insights into market momentum and potential divergences, which are often precursors to reversals.
- Strategic Decision-Making: With its comprehensive multi-timeframe analysis, cumulative delta, and statistical summaries, the MTF VFI equips traders with the information needed to make informed trading decisions, whether for short-term trades or long-term investments.
- Visual Clarity and Customization: The indicator’s dynamic display options and neutral candle coloring help traders maintain a clear and focused view of the market, customizing the visualization to match their specific needs.
The MTF Volume Flow Indicator (MTF VFI) by CryptoSea is an essential tool for traders who seek to gain a deeper understanding of market trends and volume dynamics across multiple timeframes. Its advanced features and customization options make it a valuable addition to any trader’s toolkit.
Script de código aberto
Em verdadeiro espírito do TradingView, o criador deste script o tornou de código aberto, para que os traders possam revisar e verificar sua funcionalidade. Parabéns ao autor! Embora você possa usá-lo gratuitamente, lembre-se de que a republicação do código está sujeita às nossas Regras da Casa.
Create Your Capital
Aviso legal
As informações e publicações não se destinam a ser, e não constituem, conselhos ou recomendações financeiras, de investimento, comerciais ou de outro tipo fornecidos ou endossados pela TradingView. Leia mais nos Termos de Uso.