OPEN-SOURCE SCRIPT
VSLRT with Divergences
Overview
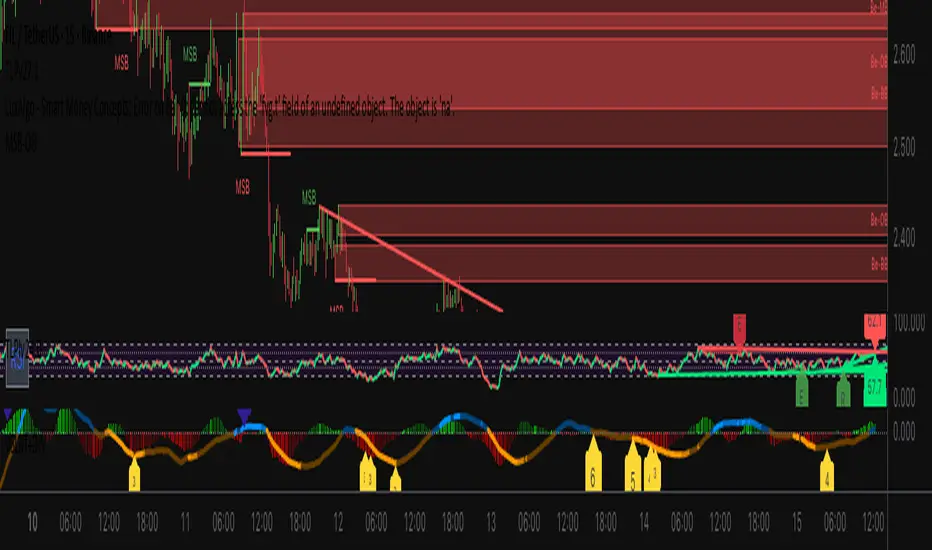
This indicator combines Volume-Synchronized Linear Regression Trend (VSLRT) analysis with multi-indicator divergence detection to provide comprehensive market momentum and reversal signals. It displays volume-weighted price trends in both short-term and long-term timeframes, while simultaneously detecting divergences across 10 different technical indicators.
Key Features
VSLRT (Volume-Synchronized Linear Regression Trend):
Short-term and long-term trend analysis using linear regression
Volume-weighted calculations that account for buying vs selling pressure
Color-coded histogram showing trend strength and direction
Forecast projection showing anticipated trend continuation
Divergence-adjusted forecasting for enhanced prediction accuracy
Multi-Indicator Divergence Detection:
The indicator simultaneously monitors divergences across:
MACD (Moving Average Convergence Divergence)
MACD Histogram
RSI (Relative Strength Index)
Stochastic Oscillator
CCI (Commodity Channel Index)
Momentum
OBV (On-Balance Volume)
Volume-Weighted MACD
Chaikin Money Flow
Money Flow Index
Divergence Types:
Regular Bullish Divergence (potential reversal to upside)
Regular Bearish Divergence (potential reversal to downside)
Hidden Bullish Divergence (trend continuation upward)
Hidden Bearish Divergence (trend continuation downward)
How It Works
VSLRT Calculations:
The indicator calculates linear regression slopes for both price and volume, separating buying volume from selling volume. The histogram displays:
Green columns: Bullish price movement with strong buying volume
Red columns: Bearish price movement with strong selling volume
Shaded columns: Weaker conviction in the current trend
Thick line: Long-term trend direction
Divergence Detection:
The script automatically scans for divergences by comparing:
Price action (higher highs/lower lows)
Indicator values at pivot points
When price and indicators move in opposite directions, a divergence is detected
Divergences are displayed as labels on the histogram showing:
Which indicators are diverging
Number of simultaneous divergences (stronger signal when multiple indicators agree)
Color-coded by divergence type
Customizable Settings
VSLRT Settings:
Short-term length (default: 20)
Long-term length (default: 50)
Forecast bars (1-50, default: 10)
Divergence forecast adjustment factor
Custom colors for all trend states
Divergence Settings:
Pivot period for divergence detection
Source (Close or High/Low)
Divergence type (Regular, Hidden, or Both)
Minimum number of divergences to display
Maximum pivot points and bars to check
Toggle individual indicators on/off
Custom colors for each divergence type
Label display options (Full names, First letter, or Don't show)
Show divergence count option
Trading Applications
Trend Following:
Use VSLRT histogram to identify trend direction and strength
Enter trades when short-term and long-term trends align
Monitor forecast bars for potential trend continuation
Reversal Trading:
Watch for multiple regular divergences (3+ indicators)
Confirm with VSLRT color changes
Higher divergence count = stronger reversal signal
Trend Continuation:
Hidden divergences suggest trend will continue
Use during pullbacks in strong trends
Combine with VSLRT forecast for entry timing
Risk Management:
Divergence alerts can signal potential exits
VSLRT color changes can indicate stop-loss levels
Forecast helps anticipate trend exhaustion
Alert Conditions
Built-in alert conditions for:
Positive Regular Divergence Detected
Negative Regular Divergence Detected
Positive Hidden Divergence Detected
Negative Hidden Divergence Detected
Any Positive Divergence
Any Negative Divergence
Tips for Best Results
Multiple Timeframe Analysis: Check divergences on higher timeframes for more reliable signals
Confirmation: Wait for bar close (enabled by default) to avoid false signals
Volume Context: Stronger VSLRT signals occur during high volume periods
Divergence Count: More simultaneous divergences = higher probability signal
Trend Alignment: Best results when divergences align with overall trend direction
Script de código aberto
Em verdadeiro espírito do TradingView, o criador deste script o tornou de código aberto, para que os traders possam revisar e verificar sua funcionalidade. Parabéns ao autor! Embora você possa usá-lo gratuitamente, lembre-se de que a republicação do código está sujeita às nossas Regras da Casa.
[̲̅$̲̅( ͡❛ ͜ʖ ͡❛)̲̅$̲̅]
Aviso legal
As informações e publicações não se destinam a ser, e não constituem, conselhos ou recomendações financeiras, de investimento, comerciais ou de outro tipo fornecidos ou endossados pela TradingView. Leia mais nos Termos de Uso.