PROTECTED SOURCE SCRIPT
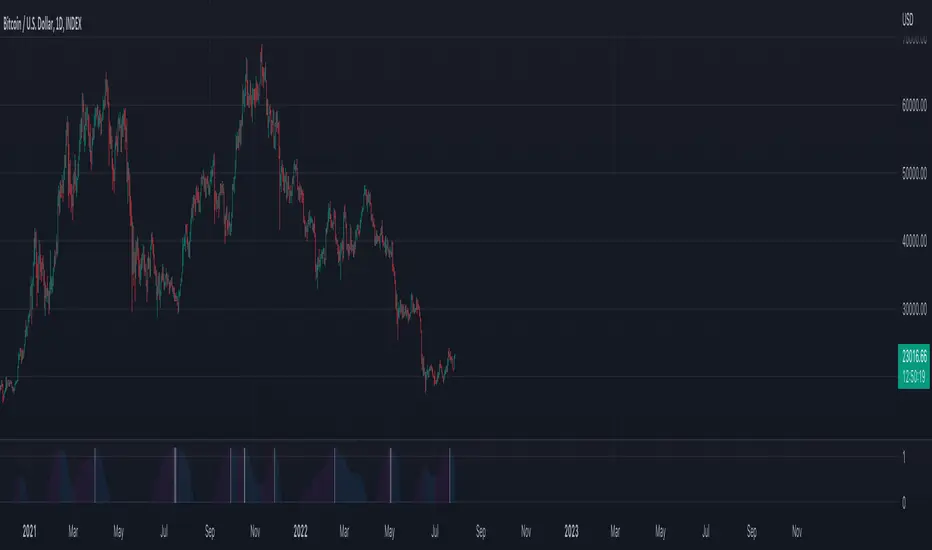
SR Strength

This indicator measures the strength of support and resistance. Purple bars show SR is increasing. Blue bars show SR strength is decreasing. White bars show the peak of SR strength. The threshold of the white bars can be adjusted in the settings. These extremes happen before a boom. This indicator is also very useful for picking up reversals. Sensitivity can be adjusted to 20 or 50 to find smaller booms and pushed all the way to 1000 or more to find stronger booms.
Script protegido
Esse script é publicada como código fechado. No entanto, você pode gerenciar suas escolhas de bate-papo. Por favor, abra suas Configurações do perfil
Aviso legal
As informações e publicações não se destinam a ser, e não constituem, conselhos ou recomendações financeiras, de investimento, comerciais ou de outro tipo fornecidos ou endossados pela TradingView. Leia mais nos Termos de Uso.