INVITE-ONLY SCRIPT
VolWaves‴ | Volume Waves‴
Atualizado
What does it do?
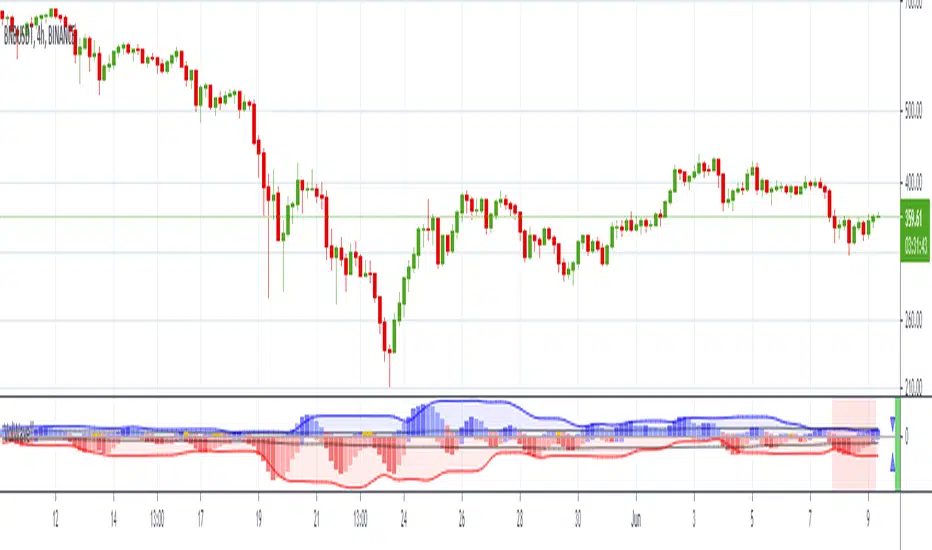
This indicator allows you to identify possible top and bottom reversals by having a prior volume reversal identifiable by positive (top reversal) and negative (bottom reversal) waves.
How does it work?
Everytime the wave starts ending its movement by shrinking the size of the histogram bars, it might be signing that a price reversal is on its way. It is possible to adjust the wave shape by increasing/decreasing its gradient value analysis, but it's so easy to use that sometimes no reconfiguration is needed, just add it and let it guide you.
What's my filling?
I've been testing this indicator for weeks and so far with incredible reversal signals.
Notas de Lançamento
Otimized version.Notas de Lançamento
What signals it provides:- measures the directional force of the volume
- suggests movement reversal
Indicator attributes:
- generally waves formation makes a symmetrical arc
- when the second half of a wave is elongated (compared to its first half), it suggests a lack of directional force of the current movement
- peak / bottom formation suggests reversal of the current movement
- smaller amplitude of a wave (compared to the previous wave) suggests loss of power, and vice-verse
- indicates divergence indication between peaks / bottoms
- when the volume bar touches the volume wave band, it suggests imminent reversal of the current movement
- band opening suggests movement increasing strength in that direction
- wavelengths (distance between two peaks / bottoms) tend to be similar
- subsequent wave rarely occurs
Technical information:
- the calculation of the positive movement is independent of the calculation of the positive movement
- the black line in the upper and lower zone is the average of the wave that is overcome, suggests strength in movement
- bands suggest delimitation of a wave's peak / bottom
Notas de Lançamento
Some improvements:- new Expantion/Contraction signal
- code optimization
Notas de Lançamento
Just another publication with a cleaner chart.Notas de Lançamento
Just added the very right bar image and the Expantion/Contraction arrows that didn't show up in the previous chart.Notas de Lançamento
Just minor adjustment to the INPUT panel.Notas de Lançamento
Histogram Expand/Contract Arrow Sign implemented.Notas de Lançamento
Just updated the colors for the Histogram Expantion/Contration Arrow Sign. Notas de Lançamento
Just minor ajustment to Hhistogram color to make it easier to view.Notas de Lançamento
Some nice new features:1. now you can choose with color setup you which to see the waves presenting (I like the standard since the other option leads me to misunderstanding signal);
2. light red background presented every time the Volatility is activated in the indicator's timeframe.
Script sob convite
O acesso a este script é restrito aos usuários autorizados pelo autor e pode requerir pagamento. Você pode adicioná-lo a seus favoritos, mas só poderá utilizá-lo após solicitar permissão e obtê-la do autor. Contate MarceloTorres para mais informações, ou siga as instruções do autor abaixo.
O TradingView não sugere pagar por um script e usá-lo, a menos que você confie 100% no seu autor e entenda como o script funciona. Em muitos casos, você pode encontrar uma boa alternativa de código aberto gratuita nos nossos Scripts da Comunidade.
Instruções do autor
″If you wish to now more about this indicator, please DM me. Do not call me through the comments area.
Quer usar esse script no gráfico?
Aviso: por favor leia antes de solicitar acesso.
TRADEWISER | Marcelo Torres
marcelo@tradewiser.pro
Vídeo-Análise completa diária no YouTube:
youtube.com/c/TradeWiserPro
Curso/AE
CursoAE.TradeWiser.pro
@TradeWiserPro
Telegram, Twitter, Facebook, LinkedIn, Instagram
marcelo@tradewiser.pro
Vídeo-Análise completa diária no YouTube:
youtube.com/c/TradeWiserPro
Curso/AE
CursoAE.TradeWiser.pro
@TradeWiserPro
Telegram, Twitter, Facebook, LinkedIn, Instagram
Aviso legal
As informações e publicações não devem ser e não constituem conselhos ou recomendações financeiras, de investimento, de negociação ou de qualquer outro tipo, fornecidas ou endossadas pela TradingView. Leia mais em Termos de uso.