OPEN-SOURCE SCRIPT
Atualizado VVIX/VIX Ratio with Interpretation Levels
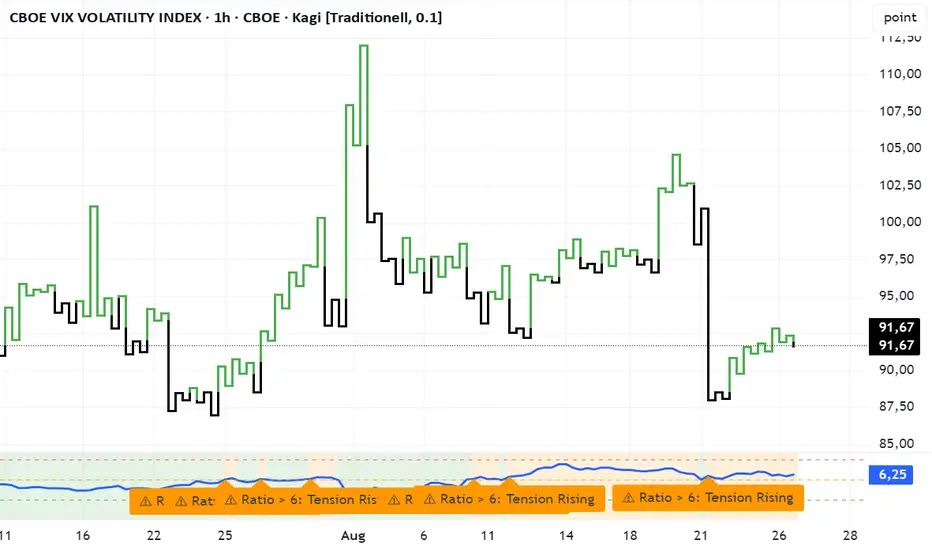
VVIX/VIX Ratio with Interpretation Levels
This indicator plots the ratio of VVIX (Volatility of Volatility Index) to VIX (CBOE Volatility Index) in a separate panel.
The ratio highlights when the options market is pricing unusually high volatility in volatility (VVIX) relative to the base volatility index (VIX).
Ratio < 5 → Complacency: Markets expect stability; often a pre-shock zone.
5–6 → Tension Building: Traders begin hedging volatility risk while VIX remains low.
6–7 → Elevated Risk: Divergence warns of potential regime change in volatility.
> 7 → High-Risk Zone: Options market pricing aggressive swings; can precede volatility spikes in equities.
The script also includes dashed interpretation lines (5, 6, 7) and automatic labels when key thresholds are crossed.
Background shading helps visualize current regime.
Use cases:
Detect hidden stress when VIX remains calm but VVIX rises.
Anticipate potential volatility regime shifts.
Support risk management and timing of long/short volatility strategies.
Notas de Lançamento
DescriptionThe VVIX/VIX Ratio Indicator plots the ratio of the CBOE VVIX (Volatility of Volatility Index) to the CBOE VIX (Volatility Index) in a separate panel.
This ratio is a useful signal to detect when the options market is pricing volatility-of-volatility significantly higher relative to equity volatility.
Interpretation Levels
Ratio < 5 → Complacency – Market calm, often precedes shocks
5–6 → Tension Building – Options traders begin hedging, VIX still calm
6–7 → Elevated Risk – Divergence may indicate regime shift
> 7 → High-Risk Zone – Panic or crisis pricing, potential volatility spike
Features:
Colored background zones (complacency → high risk)
Horizontal threshold lines at 5, 6, 7
Automatic labels when levels are crossed
Clean ratio visualization with customizable levels
Use Cases:
Early warning system for hidden stress when VIX remains low
Risk management for volatility strategies
Identifying regime changes in volatility pricing
License
Open Source – MIT License (2025).
Free to use, share, and modify with attribution.
Disclaimer: This script is for educational purposes only and does not constitute financial advice. Use at your own risk.
Script de código aberto
Em verdadeiro espírito do TradingView, o criador deste script o tornou de código aberto, para que os traders possam revisar e verificar sua funcionalidade. Parabéns ao autor! Embora você possa usá-lo gratuitamente, lembre-se de que a republicação do código está sujeita às nossas Regras da Casa.
Aviso legal
As informações e publicações não se destinam a ser, e não constituem, conselhos ou recomendações financeiras, de investimento, comerciais ou de outro tipo fornecidos ou endossados pela TradingView. Leia mais nos Termos de Uso.