OPEN-SOURCE SCRIPT
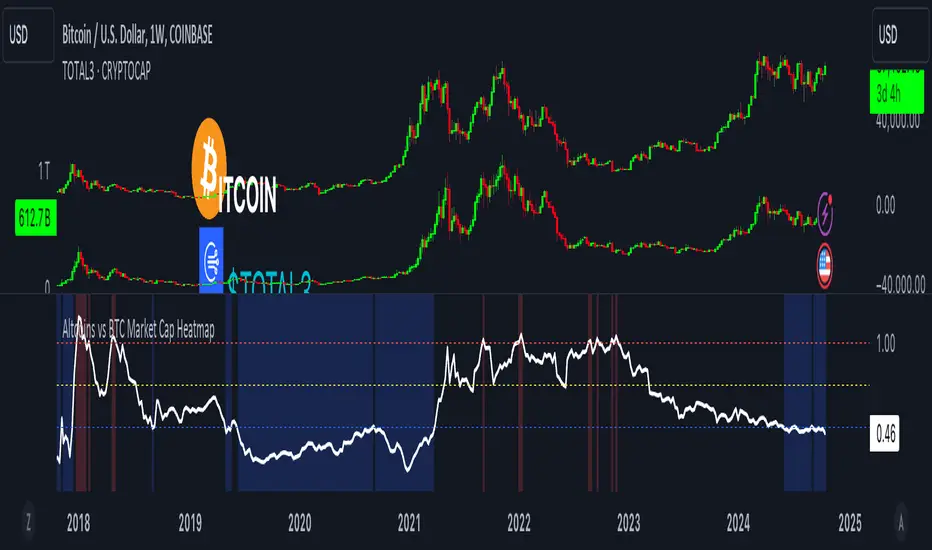
Altcoins vs BTC Market Cap Heatmap

Altcoins vs BTC Market Cap Heatmap
"Ground control to major Tom" 🌙 👨🚀 🚀
This indicator provides a visual heatmap for tracking the relationship between the market cap of altcoins (TOTAL3) and Bitcoin (BTC). The primary goal is to identify potential market cycle tops and bottoms by analyzing how the TOTAL3 market cap (all cryptocurrencies excluding Bitcoin and Ethereum) compares to Bitcoin’s market cap.
Key Features:
• Market Cap Ratio: Plots the ratio of TOTAL3 to BTC market caps to give a clear visual representation of altcoin strength versus Bitcoin.
• Heatmap: Colors the background red when altcoins are overheating (TOTAL3 market cap equals or exceeds BTC) and blue when altcoins are cooling (TOTAL3 market cap is half or less than BTC).
• Threshold Levels: Includes horizontal lines at 1 (Overheated), 0.75 (Median), and 0.5 (Cooling) for easy reference.
• Alerts: Set alert conditions for when the ratio crosses key levels (1.0, 0.75, and 0.5), enabling timely notifications for potential market shifts.
How It Works:
• Overheated (Ratio ≥ 1): Indicates that the altcoin market cap is on par or larger than Bitcoin's, which could signal a top in the cycle.
• Cooling (Ratio < 0.5): Suggests that the altcoin market cap is half or less than Bitcoin's, potentially signaling a market bottom or cooling phase.
• Median (Ratio ≈ 0.75): A midpoint that provides insight into the market's neutral zone.
Use this tool to monitor market extremes and adjust your strategy accordingly when the altcoin market enters overheated or cooling phases.
Script de código aberto
Em verdadeiro espírito do TradingView, o criador deste script o tornou de código aberto, para que os traders possam revisar e verificar sua funcionalidade. Parabéns ao autor! Embora você possa usá-lo gratuitamente, lembre-se de que a republicação do código está sujeita às nossas Regras da Casa.
Aviso legal
As informações e publicações não se destinam a ser, e não constituem, conselhos ou recomendações financeiras, de investimento, comerciais ou de outro tipo fornecidos ou endossados pela TradingView. Leia mais nos Termos de Uso.