OPEN-SOURCE SCRIPT
Atualizado Liquidity weighted Supertrend
Overview
The Liquidity Weighted Supertrend Indicator (LWST) is an advanced iteration of the traditional Supertrend indicator, meticulously crafted to improve trend detection by incorporating liquidity into its calculations. By weighting price movements according to trading volume, the LWST becomes more responsive to significant market activities, offering traders a more accurate depiction of market trends.
Indicator Description
The Liquidity Weighted Supertrend Indicator is a versatile and adaptive tool designed to assist traders in recognizing trends and potential reversal points within the market. This indicator features two operational modes: Aggressive and Smoothed, allowing traders to tailor trend detection to their specific trading style and market conditions.
Key Features
Two Supertrend Modes:
Aggressive Mode: This mode offers more responsive signals, ideal for short-term trading. It utilizes an Exponential Moving Average (EMA) to smooth the price data, resulting in quicker reactions to market changes.
Smoothed Mode: This mode provides more stable signals, suitable for longer-term trading, by employing a Simple Moving Average (SMA). Note that when "Smoothed" mode is selected, the "Fast MA length" input is not utilized, focusing instead on producing smoother trend lines.
LWMA Calculation:
The Liquidity Weighted Moving Average (LWMA) is a distinctive feature of the LWST, blending volume and price action to filter out market noise and pinpoint significant price movements. This calculation begins with the liquidity factor, determined by multiplying volume with the price change, which is then smoothed using an EMA for accuracy.
Customizable Parameters:
Factor: Adjusts the Supertrend line's sensitivity to price movements.
Supertrend Length: Defines the lookback period for the Average True Range (ATR) calculation, which affects the width of the Supertrend channel.
Fast and Slow MA Lengths: Allows customization of the fast and slow moving averages used in the LWMA calculation, offering further control over the indicator's responsiveness.
How the Indicator Works
LWMA Smoothing:
The LWST calculates liquidity by multiplying volume with the absolute difference between the close and open prices. This liquidity value is smoothed using an EMA and compared to its standard deviation, identifying significant price movements. Depending on the selected mode, the price data (hl2) is smoothed either with an EMA (in Aggressive Mode) or an SMA (in Smoothed Mode). It’s important to note that when Smoothed mode is active, the "Fast MA length" input does not affect the output.
Visual Signals:
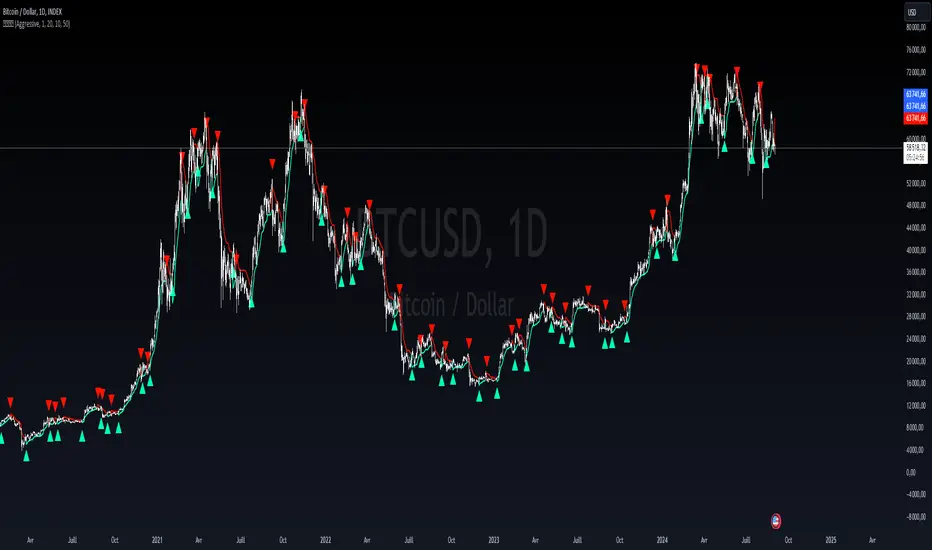
The Supertrend line is visually represented on the chart, with different colors indicating bullish (lime) and bearish (red) trends.
Buy and sell signals are clearly marked with arrows: green triangles indicate potential buying opportunities (when the price crosses above the Supertrend line), and red triangles suggest selling opportunities (when the price crosses below the Supertrend line).
Additional arrows may appear, signaling potential trend reversals, providing further confirmation for traders.
How to Use the Indicator
Configuring the Indicator:
Supertrend Type: Choose between Aggressive and Smoothed modes depending on your trading strategy and the current market conditions. Aggressive mode is better suited for shorter timeframes, while Smoothed mode provides more consistent signals for longer-term analysis.
Factor and Length Settings: Customize the Factor, Supertrend Length, and Moving Average lengths to fine-tune the sensitivity and responsiveness of the Supertrend line, adapting the indicator to various market environments.
Interpreting the Signals:
Trend Identification: The Supertrend line offers a clear visualization of the current market trend. A green line indicates a bullish trend, suggesting upward price movement, while a red line indicates a bearish trend, signaling potential downward price movement.
Entry and Exit Points: The arrows plotted by the LWST provide straightforward entry and exit signals. Green arrows signal potential buy opportunities, indicating that the price may continue to rise, while red arrows signal potential sell opportunities, suggesting that the price may decline. These visual cues help traders make informed decisions based on the current market trend.
The Liquidity Weighted Supertrend Indicator (LWST) is an advanced iteration of the traditional Supertrend indicator, meticulously crafted to improve trend detection by incorporating liquidity into its calculations. By weighting price movements according to trading volume, the LWST becomes more responsive to significant market activities, offering traders a more accurate depiction of market trends.
Indicator Description
The Liquidity Weighted Supertrend Indicator is a versatile and adaptive tool designed to assist traders in recognizing trends and potential reversal points within the market. This indicator features two operational modes: Aggressive and Smoothed, allowing traders to tailor trend detection to their specific trading style and market conditions.
Key Features
Two Supertrend Modes:
Aggressive Mode: This mode offers more responsive signals, ideal for short-term trading. It utilizes an Exponential Moving Average (EMA) to smooth the price data, resulting in quicker reactions to market changes.
Smoothed Mode: This mode provides more stable signals, suitable for longer-term trading, by employing a Simple Moving Average (SMA). Note that when "Smoothed" mode is selected, the "Fast MA length" input is not utilized, focusing instead on producing smoother trend lines.
LWMA Calculation:
The Liquidity Weighted Moving Average (LWMA) is a distinctive feature of the LWST, blending volume and price action to filter out market noise and pinpoint significant price movements. This calculation begins with the liquidity factor, determined by multiplying volume with the price change, which is then smoothed using an EMA for accuracy.
Customizable Parameters:
Factor: Adjusts the Supertrend line's sensitivity to price movements.
Supertrend Length: Defines the lookback period for the Average True Range (ATR) calculation, which affects the width of the Supertrend channel.
Fast and Slow MA Lengths: Allows customization of the fast and slow moving averages used in the LWMA calculation, offering further control over the indicator's responsiveness.
How the Indicator Works
LWMA Smoothing:
The LWST calculates liquidity by multiplying volume with the absolute difference between the close and open prices. This liquidity value is smoothed using an EMA and compared to its standard deviation, identifying significant price movements. Depending on the selected mode, the price data (hl2) is smoothed either with an EMA (in Aggressive Mode) or an SMA (in Smoothed Mode). It’s important to note that when Smoothed mode is active, the "Fast MA length" input does not affect the output.
Visual Signals:
The Supertrend line is visually represented on the chart, with different colors indicating bullish (lime) and bearish (red) trends.
Buy and sell signals are clearly marked with arrows: green triangles indicate potential buying opportunities (when the price crosses above the Supertrend line), and red triangles suggest selling opportunities (when the price crosses below the Supertrend line).
Additional arrows may appear, signaling potential trend reversals, providing further confirmation for traders.
How to Use the Indicator
Configuring the Indicator:
Supertrend Type: Choose between Aggressive and Smoothed modes depending on your trading strategy and the current market conditions. Aggressive mode is better suited for shorter timeframes, while Smoothed mode provides more consistent signals for longer-term analysis.
Factor and Length Settings: Customize the Factor, Supertrend Length, and Moving Average lengths to fine-tune the sensitivity and responsiveness of the Supertrend line, adapting the indicator to various market environments.
Interpreting the Signals:
Trend Identification: The Supertrend line offers a clear visualization of the current market trend. A green line indicates a bullish trend, suggesting upward price movement, while a red line indicates a bearish trend, signaling potential downward price movement.
Entry and Exit Points: The arrows plotted by the LWST provide straightforward entry and exit signals. Green arrows signal potential buy opportunities, indicating that the price may continue to rise, while red arrows signal potential sell opportunities, suggesting that the price may decline. These visual cues help traders make informed decisions based on the current market trend.
Notas de Lançamento
Added alerts for buy signals and sell signals as requestedNotas de Lançamento
Update for Multi Timeframe version Notas de Lançamento
added watermark in code Script de código aberto
Em verdadeiro espírito do TradingView, o criador deste script o tornou de código aberto, para que os traders possam revisar e verificar sua funcionalidade. Parabéns ao autor! Embora você possa usá-lo gratuitamente, lembre-se de que a republicação do código está sujeita às nossas Regras da Casa.
🚀 Elevate your edge with institutional-grade indicators & full trading systems.
🔗 Access tools: linktr.ee/0xKazo
🔗 Access tools: linktr.ee/0xKazo
Aviso legal
As informações e publicações não se destinam a ser, e não constituem, conselhos ou recomendações financeiras, de investimento, comerciais ou de outro tipo fornecidos ou endossados pela TradingView. Leia mais nos Termos de Uso.
Script de código aberto
Em verdadeiro espírito do TradingView, o criador deste script o tornou de código aberto, para que os traders possam revisar e verificar sua funcionalidade. Parabéns ao autor! Embora você possa usá-lo gratuitamente, lembre-se de que a republicação do código está sujeita às nossas Regras da Casa.
🚀 Elevate your edge with institutional-grade indicators & full trading systems.
🔗 Access tools: linktr.ee/0xKazo
🔗 Access tools: linktr.ee/0xKazo
Aviso legal
As informações e publicações não se destinam a ser, e não constituem, conselhos ou recomendações financeiras, de investimento, comerciais ou de outro tipo fornecidos ou endossados pela TradingView. Leia mais nos Termos de Uso.