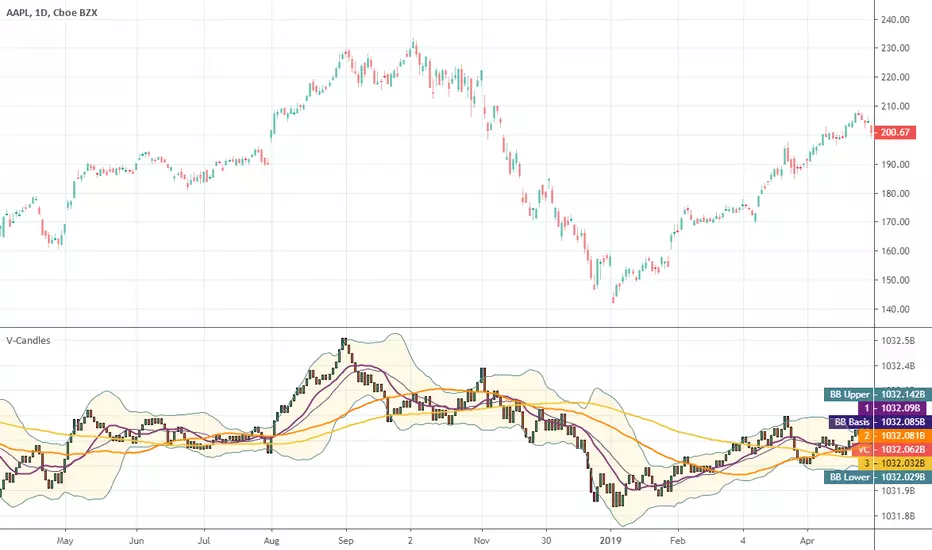
Volume Candles
Well, I was trying to implement EquiVolume Charts that were developed by Richard W. Arms, but unfortunately I got a poor result.
Instead, I used my groundwork on EquiVolumes to create Volume Candles indicator to help you make better, smarter trades.
What are the cool features?
- Excellently filters the instrument's movements
- Gives a better view of the accumulation/distribution phases
- Completely removes price gaps
- Works on ANY instrument that has available volume data.
Personally, I am a big fan of the volume-based indicators and to clarify my position I cite the following words of Buff Pelz Dormeier from his book "Investing with Volume Analysis: Identify, Follow, and Profit from Trends":
A trade produces only two pieces of information: the price and price's neglected sibling, volume. Perhaps the least appreciated piece of the puzzle, volume represents fertile ground for technical analysis. Proficiency in volume analysis is a rare skill. Properly understood, though, volume analysis can provide its practitioner with the power to peer deeply into market mechanics.
Benjamin Graham, the father of value investing and a mentor of Warren Buffett, often called the market a 'voting machine'. If so, then volume is the ballot box. Volume is a literal illustration of the power behind the forces of supply and demand.
Volume is understood as the validation of price, the source of liquidity, the substantiation of information, the fulfillment of convictions, the revelation of divergent opinions, the fuel of the market, the proponent of truth, and the energy behind the velocity of money. If you believe any of this information might be important in making an investment decision, volume analysis is important to you.
I attached some screenshots to show you how it works with other instruments.
Happy Trading!
- Added 26 types of moving averages
- Added ability to plot up to 3 moving averages
- Refactored
- Optimized calculations
Supported Bands and Channels (up to 3 on the same chart)
- Bollinger Bands (by John Bollinger)
- Kirshenbaum Bands (by Paul Kirshenbaum)
- Donchian Channels (by Richard D. Donchian)
Supported Moving Averages (up to 3 on the same chart)
- AHMA, Ahrens MA (by Richard D. Ahrens)
- ARSI, Adaptive RSI
- DEMA, Double Exponential MA (by Patrick G. Mulloy)
- DWMA, Double Weighted (Linear) MA
- EMA, Exponential MA
- FAMA, Following Adaptive MA (by John F. Ehlers)
- FRAMA, Fractal Adaptive MA (by John F. Ehlers)
- HMA, Hull MA (by Alan Hull)
- IIRF, Infinite Impulse Response Filter (by John F. Ehlers)
- JMA, Jurik MA (by Mark Jurik, https://www.tradingview.com/script/714vYiDe-Jurik-Moving-Average/)
- KAMA, Kaufman Adaptive MA (by Perry J. Kaufman)
- LMA, Leo MA (by ProRealCode' user Leo)
- LSMA, Least Squares MA (Moving Linear Regression)
- MAMA, (by John F. Ehlers)
- Median, Moving Median
- PWMA, Parabolic Weighted MA
- RMA, Running MA (by J. Welles Wilder)
- RMTA, Recursive Moving Trend Average (by Dennis Meyers)
- SMA, Simple MA
- SSF, Super Smoother Filter with 2 poles (by John F. Ehlers)
- TEMA, Triple Exponential MA (by Patrick G. Mulloy)
- TMA, Triangular MA (generalized by John F. Ehlers)
- VIDYA, Variable Index Dynamic Average (by Tushar S. Chande)
- WMA, Weighted (Linear) MA
- ZLEMA, Zero Lag Exponential MA (by John F. Ehlers and Ric Way)
- Added alert on candle color change
- Updated the settings window
- Pine Script V4
- Minor optimizations
Script sob convite
Somente usuários aprovados pelo autor podem acessar este script. Você precisará solicitar e obter permissão para usá-lo. Normalmente, essa permissão é concedida após o pagamento. Para obter mais detalhes, siga as instruções do autor abaixo ou entre em contato diretamente com everget.
A TradingView NÃO recomenda pagar ou usar um script, a menos que você confie totalmente em seu autor e entenda como ele funciona. Você também pode encontrar alternativas gratuitas e de código aberto em nossos scripts da comunidade.
Instruções do autor
🆓 List of my FREE indicators: bit.ly/2S7EPuN
💰 List of my PREMIUM indicators: bit.ly/33MA81f
Join Bybit and get up to $6,045 in bonuses!
bybit.com/invite?ref=56ZLQ0Z
Aviso legal
Script sob convite
Somente usuários aprovados pelo autor podem acessar este script. Você precisará solicitar e obter permissão para usá-lo. Normalmente, essa permissão é concedida após o pagamento. Para obter mais detalhes, siga as instruções do autor abaixo ou entre em contato diretamente com everget.
A TradingView NÃO recomenda pagar ou usar um script, a menos que você confie totalmente em seu autor e entenda como ele funciona. Você também pode encontrar alternativas gratuitas e de código aberto em nossos scripts da comunidade.
Instruções do autor
🆓 List of my FREE indicators: bit.ly/2S7EPuN
💰 List of my PREMIUM indicators: bit.ly/33MA81f
Join Bybit and get up to $6,045 in bonuses!
bybit.com/invite?ref=56ZLQ0Z