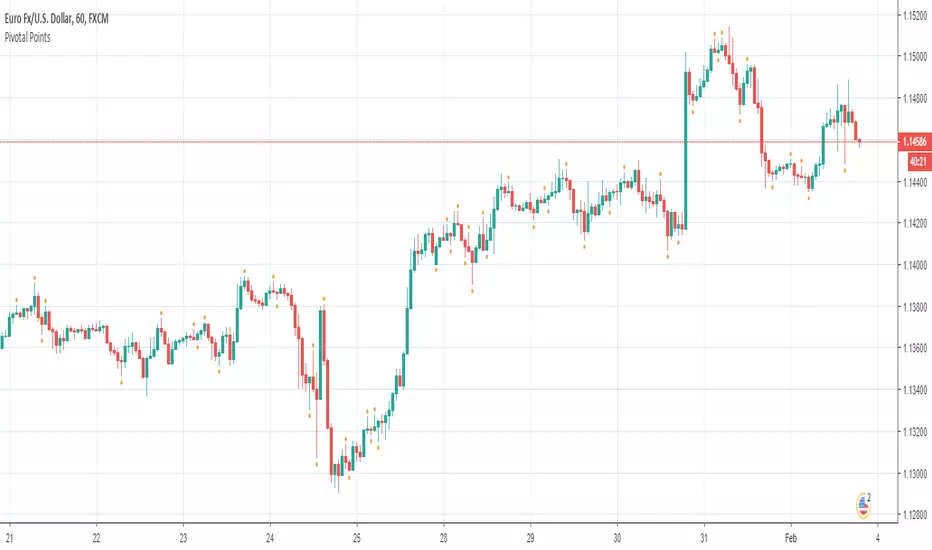
Pivotal Points, Wyckoff Trend Tracking Trading SystemPivotal Points by Wyckoff Trend Tracking Trading System
Wyckoff
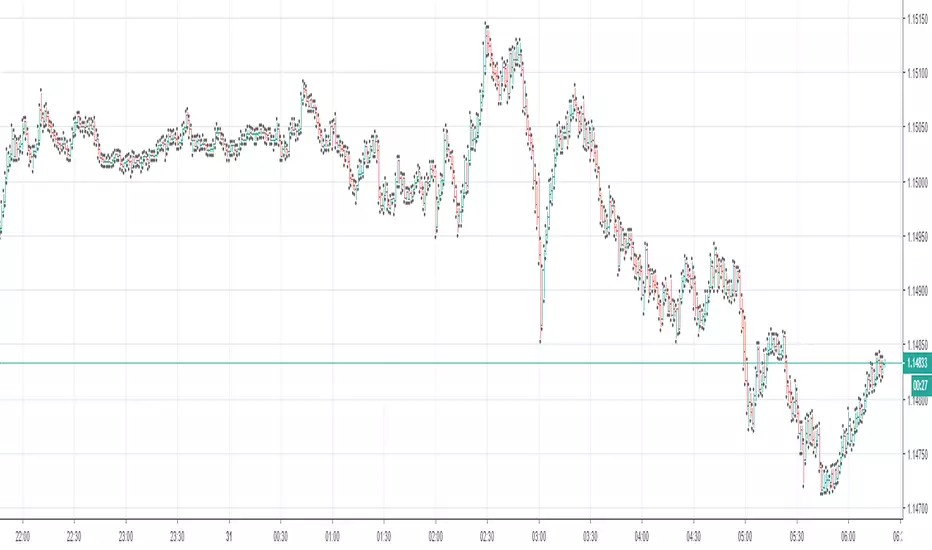
High Volatility Bar, Wyckoff Trend Tracking Trading SystemHigh Volatility Bar by Wyckoff Trend Tracking Trading System

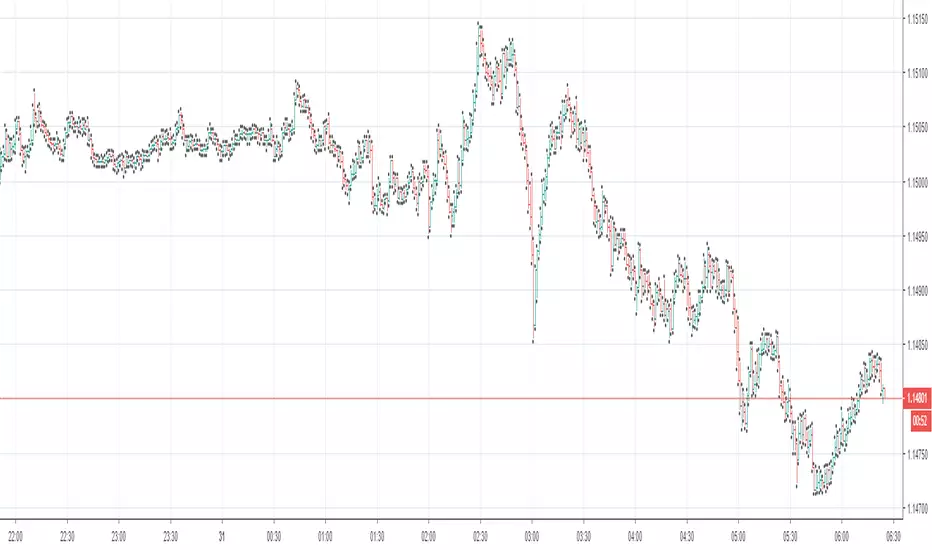
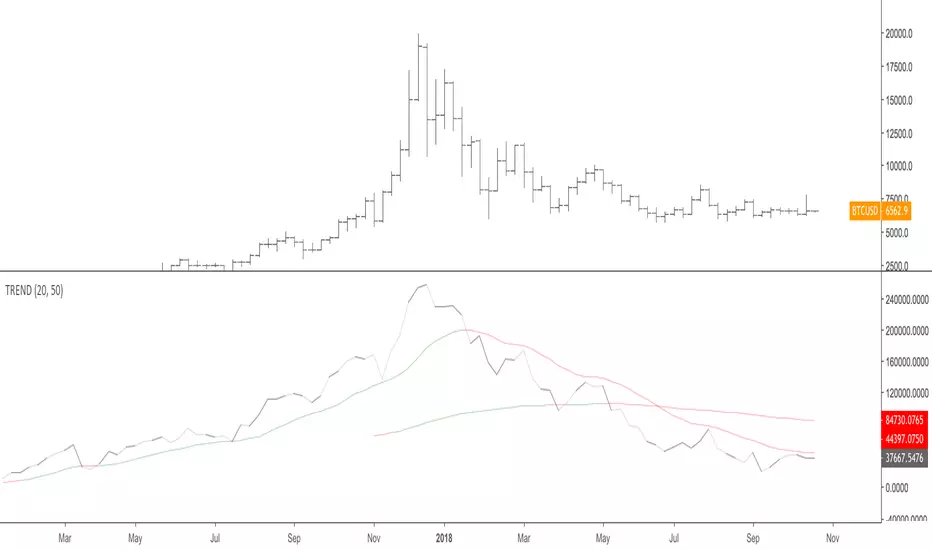
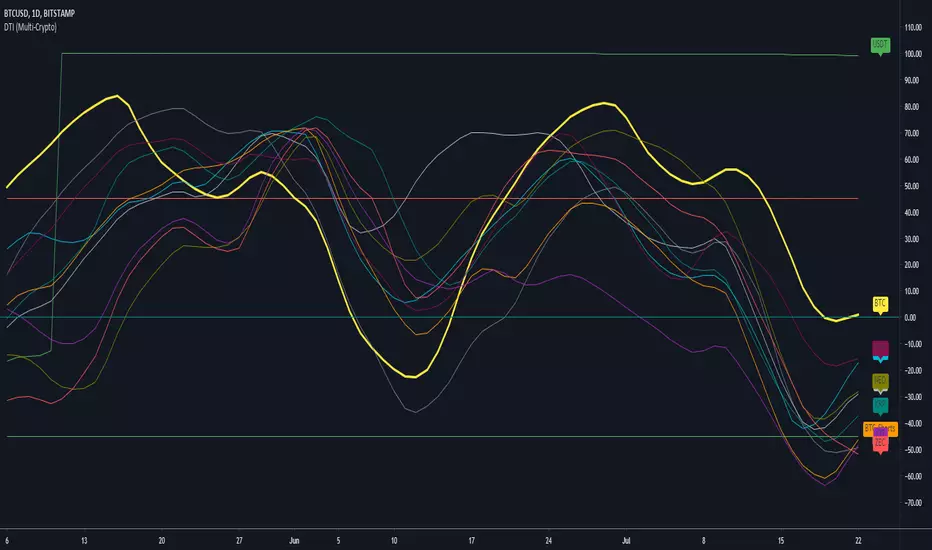
Trend Strength Indicator, Wyckoff Trend Tracking Trading SystemTrend Strength Indicator by Wyckoff Trend Tracking Trading System

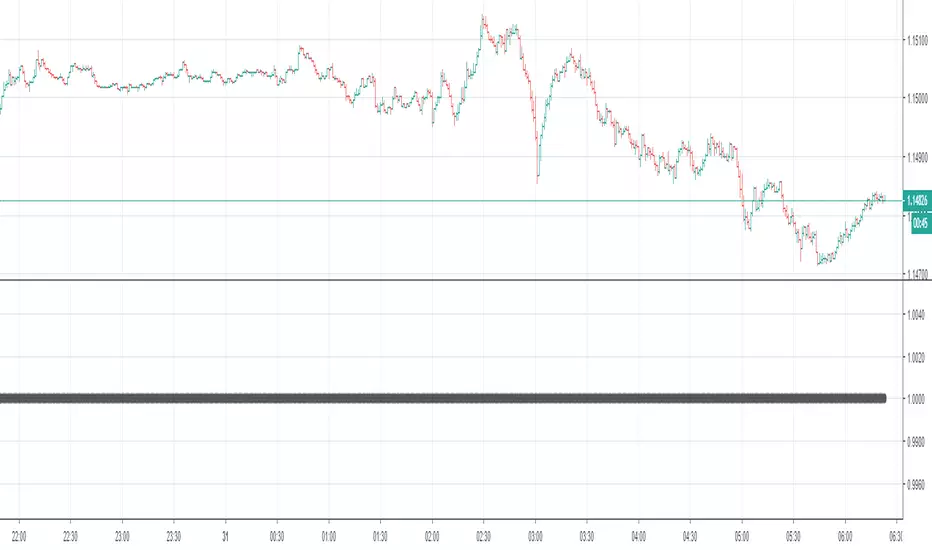
Wyckoff Trend Following, Wyckoff Trend Tracking Trading SystemWyckoff Trend Following by Wyckoff Trend Tracking Trading System

High Volatility Bar, Wyckoff Trend Tracking Trading SystemHigh Volatility Bar by Wyckoff Trend Tracking Trading System
Pivotal Points, Wyckoff Trend Tracking Trading SystemPivotal Points by Wyckoff Trend Tracking Trading System
Volume Warning, Wyckoff Trend Tracking Trading SystemVolume Warning by Wyckoff Trend Tracking Trading System
Wyckoff Volume, Wyckoff Trend Tracking Trading SystemWyckoff Volume by Wyckoff Trend Tracking Trading System

Wyckoff Volume on Price, Wyckoff Trend Tracking Trading SystemWyckoff Volume on Price by Wyckoff Trend Tracking Trading System

Support/Resistance Algo-Tradeing StrategyThis strategy Automates Support and resistance trading and a tight trailing stop loss technique. The support and resistance levels are calculated from previous highs and lows; these levels are used to make two types of trades:
1. Break out trades, taking a trade if the market is able to push through a support or resistance level.
2. Liquidity pool rejection, also known as a stop loss hunt. When the market is brought past a key level (to take out stop losses) which traders (usually institutions) use to enter, which then reverses back through the support/resistance level where the strategy enters a trade.
An optional "volatility filter" may be used when on a suitable market. This means that trades are only entered when there is suitable volatility.
A tight stop loss is kept so most trades lose, but winning trades are left to run much further. So this is a very reliable profitable strategy on many markets.
For a limited time I will provide access to this strategy for free as it is not yet complete, there is still testing to do and I would appreciate any feedback.

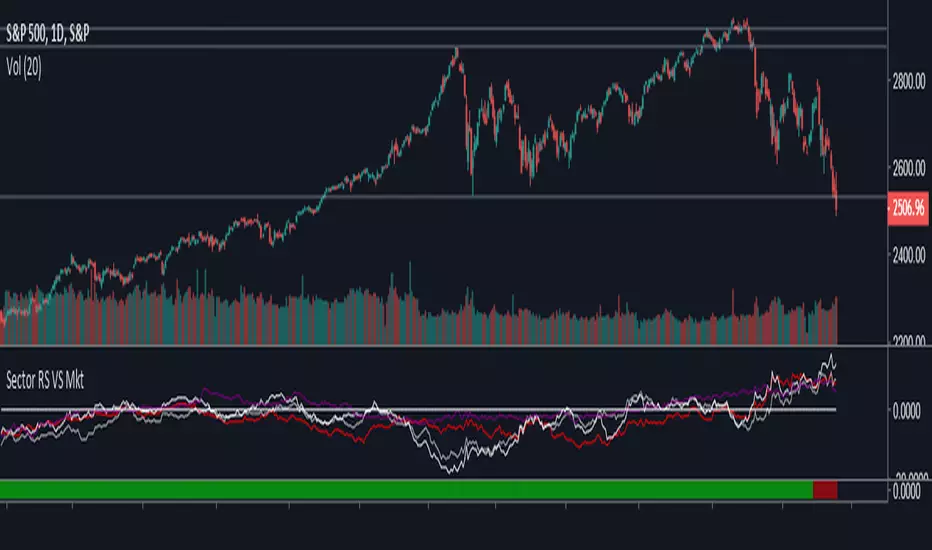
LT Cycle Analysis - S&P500This script aims to identify bullish and bearish trend of the US market.
For traders to identify a Bullish or Bearish market and trade according to the market trend.
Always Long in a Bullish market and Short in a Bearish Market. 1st step of Wyckoff Market Approach.
Wyckoff Selection MethodThis is a simple script that compares the current asset RSI with the RSI of another asset that you can set in the input scrren. By default the comparable asset is the XETR:DAX index.

JSE Wyckoff Wave Volume Code// The Stock Market Institute (SMI) describes an propriety indicator the "SMI Wyckoff Wave" for US Stocks. This code is an attempt to make a Wyckoff Wave for the Johannesburg Stock Exchange (JSE).
// The JSE Wyckoff Wave is in a separate code. This is the code for the volume of the wave. Please see code for the JSE Wyckoff Wave which goes with this indicator.
//
// The Wave presents a normalized price for the 10 selected stocks (An Index for the 10 stocks).
// The theory is to select stocks that are widely held, market leaders, actively traded and participate in important market moves.
// This is only my attempt to select 10 stocks and a different selection can be made.
// I am not certain how SMI determine their weightings but what I have done it to equalize the Rand value of the stock volumne so that moves are of equal magnitude.
// The then provides a view of the overall condition of the market and volume flow in the market.
//
// I have used the September 2018 price to normalize the stock price for the 10 selected stocks based. The stocks and weightings can be changed periodically depending on the performance and leadership.
//
// Please, let me know if there is a better work around this.
The stocks and their weightings are:
"JSE:BTI"/0.79
"JSE:SHP"/2.87
"JSE:NPN"/0.18
"JSE:AGL"/1.96
"JSE:SOL"/1.0
"JSE:CFR"/4.42
"JSE:MND"/1.40
"JSE:MTN"/7.63
"JSE:SLM"/7.29
"JSE:FSR"/8.25

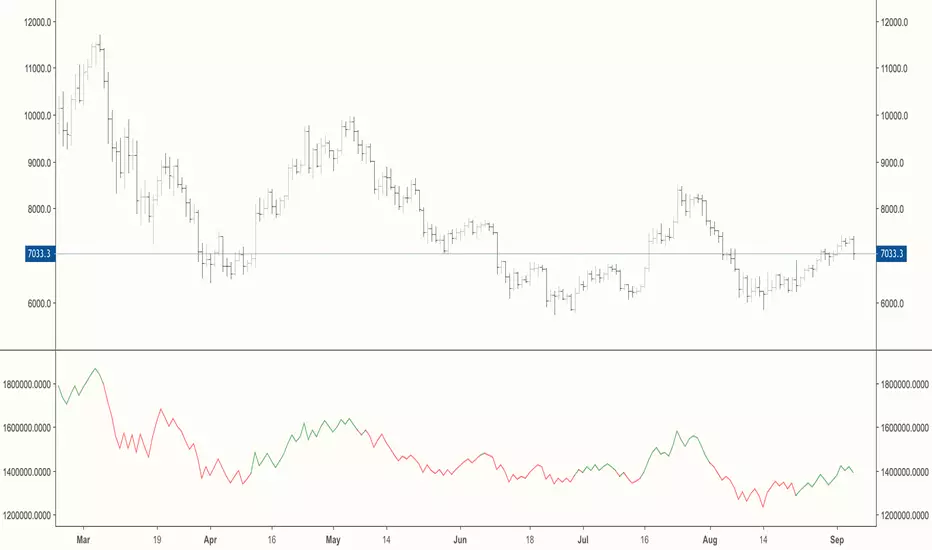
OBV/CCI By AssetDisplay on balance volume, with trend strength identification by colour of another asset in a window of your current chart.
Wave Volume OverlayWaves of price action are created based on periods of sustained direction volume. This indicator allows you to see the rating of volume in each of these waves relative to others.

Volume Plus (Volume+)View Total Volume, Bull Volume, and/or Bear Volume. View Volume Effectiveness to reveal how Volume has effected the price. View the Moving Average of any of the above metrics, selecting one or more types of moving averages(SMA, EMA, RMA, SWMA, VWMA, WMA, or ALMA). Create nearly infinite crossovers by activating the Secondary Moving Average and choosing a longer or shorter Length. Use the highlighter to quickly filter out noise and focus the events you're searching for, by choosing one or more highlight-scenarios from the Highlighting Menu. Use the Average Amplifier to fine tune your Highlighting results.
Use as an ordinary Volume Indicator
Show the Bullish volume within Total Volume
Show the Bearish volume within Total Volume
Show the Bullish and Bearish volume simultaneously within Total Volume
Create crossovers like this one, Bullish Volume Average with Bearish Volume Average
Show the gas mileage of volume, the Volume Effectiveness
Create crossovers like this, Volume Effectiveness 14 with Volume Effectiveness 60
Use Amplifiers to show things that are usually out of scale with one another, like Volume Effectiveness with Volume
Use the Highlighter to show anything, like here, when Bearish Volume was above average AND Volume Effectiveness was under average
From left to right, the Indicator Values are as follows:
1) Total True Volume (red, green, or gray when viewed alongside Bulls/Bears)
2) Volume Winner - Bulls v/s Bears (red or green)
3) Volume Loser - Bulls v/s Bears (red or green)
4) Volume Effectiveness (blue)
5) Design Spacer - Ignore This (green)
6) Design Spacer - Ignore This (red)
7) Total True Volume Primary Moving Average (dark gray)
8) Total True Volume Secondary Moving Average (dark gray)
9) Inferred Bullish Volume Primary Moving Average (dark green)
10) Inferred Bullish Volume Secondary Moving Average (dark green)
11) Inferred Bearish Volume Primary Moving Average (dark red)
12) Inferred Bearish Volume Secondary Moving Average (dark red)
13) Volume Effectiveness Primary Moving Average (blue)
14) Volume Effectiveness Secondary Moving Average (blue)
Click the sprocket and you'll find the following settings (which are explained below):
Total True Volume - This is your everyday, ordinary volume indicator, a total sum of the volume from each candle.
Inferred Bullish Volume - This subtracts Bearish Volume out of the Total True Volume. But without the bull-volume data from the exchange, we can only forensically infer the bullish volume by evaluating OHLC data to guess what ratio of upward v/s downward movement happened within the candle.
Inferred Bearish Volume - This subtracts Bullish Volume out of the Total True Volume. But without the bear-volume data from the exchange, we can only forensically infer the bearish volume by evaluating OHLC data to guess what ratio of downward v/s upward movement happened within the candle.
Volume Effectiveness - This shows how much price movement occurred for each unit of Volume, by dividing the Price Change of each candle by the Total True Volume of each candle. If this volume were gas-mileage, then Volume would be the gas and Price would be the mileage.
• Inferred Effectiveness - Rather than using the Price Change divided by the Total True Volume, this method of determining Volume Effectiveness uses the Total Price-Mileage divided by the Total True Volume. The Total Price-Mileage is determined by figuring the high minus low, the wick times two, and the tail times two, and ad

Weis Wave ChartThis indicator is based on the Weis Wave described by David H. Weis in his book Trades About to Happen: A Modern Adaptation of the Wyckoff Method, more info how to use this indicator can be found in this video . The Weis Wave is an adaptation of Richard D. Wyckoff’s method Wave Charts. It works in all time periods and can be applied to all asset types.
Unlike other implementations I found here on TradingView, this implementation make use of a Renko-like zig zag pattern, very similar to how it is described in David H. Weis' book. The settings for the zig zag pattern are very similar to the standard Renko settings here on TradingView, in the "Renko Assignment Method" you either chose "ATR" or "Traditional" (read more about it here ). The ATR length or the brick size is then entered in the textbox "Value". You can also chose another setting in the "Renko Assignment Method" drop down named "Part of Price" which calculate the brick size from the current close and divide it by the value in the text box "Value". It is also possible to chose if the zig zag pattern shall use the high/low, the open/close or just the close as the most extreme values in its calculation, you select this in the drop down "Price Source".
TradingView's pine script does currently not support to print non-static text on the chart, so it is not possible at this point to write out the volume on the zig zag chart. It is also not possible to have both an overlay and separate chart pane in the same indicator, therefor this indicator is split up in two.
You can find the volume indicator here:

Weis Wave VolumeThis indicator is based on the Weis Wave described by David H. Weis in his book Trades About to Happen: A Modern Adaptation of the Wyckoff Method, more info how to use this indicator can also be found in this video . The Weis Wave is an adaptation of Richard D. Wyckoff’s method Wave Charts. It works in all time periods and can be applied to all asset types. For assets that do not support volume Weis propose in his book to use the true range instead, so if you want to use this indicator for assets that do not support volume, make sure to enable the checkbox "Use True Range instead of Volume".
Unlike other implementations I found here on Trading, this implementation make use of a Renko-like zig zag pattern, very similar to how it is described in David H. Weis' book. The settings for the zig zag pattern are very similar to the standard Renko settings here on TradingView, in the "Renko Assignment Method" you either chose "ATR" or "Traditional" (read more about it here ). The ATR length or the brick size is then entered in the textbox "Value". You can also chose another setting in the "Renko Assignment Method" drop down named "Part of Price" which calculate the brick size from the current close and divide it by the value in the text box "Value". It is also possible to chose if the zig zag pattern shall use the high/low, the open/close or just the close as the most extreme values in its calculation, you select this in the drop down "Price Source". If you want the price to oscillate around a zero value, enable the "Oscillating" checkbox.
TradingView's pine script does currently not support to print non-static text on the chart, so it is not possible at this point to write out the volume on the zig zag chart. It is also not possible to have both an overlay and separate chart pane in the same indicator, therefor this indicator is split up in two.
You can find the zig zag indicator here:


On Balance Consolidated Volume 1min [BTC] CCI EMA OROn Balance Consolidated Volume var interval
38 Exchanges
