Larry Williams Oops StrategyThis strategy is a modern take on Larry Williams’ classic Oops setup. It trades intraday while referencing daily bars to detect opening gaps and align entries with the prior day’s direction. Risk is managed with day-based stops, and—unlike the original—all positions are closed at the end of the session (or at the last bar’s close), not at a fixed profit target or the first profitable open.
Entry Rules
Long setup (bullish reversion): Today opens below yesterday’s low (down gap) and yesterday’s candle was bearish. Place a buy stop at yesterday’s low + Filter (ticks).
Short setup (bearish reversion): Today opens above yesterday’s high (up gap) and yesterday’s candle was bullish. Place a sell stop at yesterday’s high − Filter (ticks).
Longs are only taken on down-gap days; shorts only on up-gap days.
Protective Stop
If long, stop loss trails the current day’s low.
If short, stop loss trails the current day’s high.
Exit Logic
Positions are force-closed at the end of the session (in the last bar), ensuring no overnight exposure. There is no take-profit; only stop loss or end-of-day flat.
Notes
This strategy is designed for intraday charts (minutes/seconds) using daily data for gaps and prior-day direction.
Longs/shorts can be enabled or disabled independently.
Osciladores de Williams

Larry Williams Bonus Track PatternThis strategy trades the day immediately following an Inside Day, under specific directional and timing conditions. It is designed for daily-based setups but executed on intraday charts to ensure orders are placed exactly at the open of the following day, rather than at the daily bar close.
Entry Conditions
Only trades on Monday, Thursday, or Friday.
The previous day must be an Inside Day (its high is lower than the prior high and its low is higher than the prior low).
The bar before the Inside Day must be bullish (close > open).
On the following day (t):
The daily open must be below both the Inside Day’s high and the highest high of the two days before that.
A buy stop is placed at the highest high of the three previous days (Inside Day and the two days before it).
If the new day’s open is already above that level (gap up), the strategy enters long immediately at the open.
Exit Rules
Stop Loss: Fixed, defined in points or percentage (user input).
FPO (First Profitable Open): the position is closed at the first daily open after the entry day where the open price is above the average entry price (the first profitable open).
Notes
The script must be applied on an intraday timeframe (e.g., 15-minute or 1-hour) so that the strategy can:
Detect the Inside Day pattern using daily data (request.security).
Execute orders in real time at the next day’s open.
Running it directly on the daily timeframe will delay executions by one bar due to Pine Script’s evaluation model.

Larry Williams - Smash Day (SL/TP in %)This strategy implements Larry Williams’ “Smash Day” reversal concept on any symbol and timeframe (daily is the classic). A Smash Day is a bar that closes beyond a recent extreme and then potentially reverses on the next session.

Anomalous Holonomy Field Theory🌌 Anomalous Holonomy Field Theory (AHFT) - Revolutionary Quantum Market Analysis
Where Theoretical Physics Meets Trading Reality
A Groundbreaking Synthesis of Differential Geometry, Quantum Field Theory, and Market Dynamics
🔬 THEORETICAL FOUNDATION - THE MATHEMATICS OF MARKET REALITY
The Anomalous Holonomy Field Theory represents an unprecedented fusion of advanced mathematical physics with practical market analysis. This isn't merely another indicator repackaging old concepts - it's a fundamentally new lens through which to view and understand market structure .
1. HOLONOMY GROUPS (Differential Geometry)
In differential geometry, holonomy measures how vectors change when parallel transported around closed loops in curved space. Applied to markets:
Mathematical Formula:
H = P exp(∮_C A_μ dx^μ)
Where:
P = Path ordering operator
A_μ = Market connection (price-volume gauge field)
C = Closed price path
Market Implementation:
The holonomy calculation measures how price "remembers" its journey through market space. When price returns to a previous level, the holonomy captures what has changed in the market's internal geometry. This reveals:
Hidden curvature in the market manifold
Topological obstructions to arbitrage
Geometric phase accumulated during price cycles
2. ANOMALY DETECTION (Quantum Field Theory)
Drawing from the Adler-Bell-Jackiw anomaly in quantum field theory:
Mathematical Formula:
∂_μ j^μ = (e²/16π²)F_μν F̃^μν
Where:
j^μ = Market current (order flow)
F_μν = Field strength tensor (volatility structure)
F̃^μν = Dual field strength
Market Application:
Anomalies represent symmetry breaking in market structure - moments when normal patterns fail and extraordinary opportunities arise. The system detects:
Spontaneous symmetry breaking (trend reversals)
Vacuum fluctuations (volatility clusters)
Non-perturbative effects (market crashes/melt-ups)
3. GAUGE THEORY (Theoretical Physics)
Markets exhibit gauge invariance - the fundamental physics remains unchanged under certain transformations:
Mathematical Formula:
A'_μ = A_μ + ∂_μΛ
This ensures our signals are gauge-invariant observables , immune to arbitrary market "coordinate changes" like gaps or reference point shifts.
4. TOPOLOGICAL DATA ANALYSIS
Using persistent homology and Morse theory:
Mathematical Formula:
β_k = dim(H_k(X))
Where β_k are the Betti numbers describing topological features that persist across scales.
🎯 REVOLUTIONARY SIGNAL CONFIGURATION
Signal Sensitivity (0.5-12.0, default 2.5)
Controls the responsiveness of holonomy field calculations to market conditions. This parameter directly affects the threshold for detecting quantum phase transitions in price action.
Optimization by Timeframe:
Scalping (1-5min): 1.5-3.0 for rapid signal generation
Day Trading (15min-1H): 2.5-5.0 for balanced sensitivity
Swing Trading (4H-1D): 5.0-8.0 for high-quality signals only
Score Amplifier (10-200, default 50)
Scales the raw holonomy field strength to produce meaningful signal values. Higher values amplify weak signals in low-volatility environments.
Signal Confirmation Toggle
When enabled, enforces additional technical filters (EMA and RSI alignment) to reduce false positives. Essential for conservative strategies.
Minimum Bars Between Signals (1-20, default 5)
Prevents overtrading by enforcing quantum decoherence time between signals. Higher values reduce whipsaws in choppy markets.
👑 ELITE EXECUTION SYSTEM
Execution Modes:
Conservative Mode:
Stricter signal criteria
Higher quality thresholds
Ideal for stable market conditions
Adaptive Mode:
Self-adjusting parameters
Balances signal frequency with quality
Recommended for most traders
Aggressive Mode:
Maximum signal sensitivity
Captures rapid market moves
Best for experienced traders in volatile conditions
Dynamic Position Sizing:
When enabled, the system scales position size based on:
Holonomy field strength
Current volatility regime
Recent performance metrics
Advanced Exit Management:
Implements trailing stops based on ATR and signal strength, with mode-specific multipliers for optimal profit capture.
🧠 ADAPTIVE INTELLIGENCE ENGINE
Self-Learning System:
The strategy analyzes recent trade outcomes and adjusts:
Risk multipliers based on win/loss ratios
Signal weights according to performance
Market regime detection for environmental adaptation
Learning Speed (0.05-0.3):
Controls adaptation rate. Higher values = faster learning but potentially unstable. Lower values = stable but slower adaptation.
Performance Window (20-100 trades):
Number of recent trades analyzed for adaptation. Longer windows provide stability, shorter windows increase responsiveness.
🎨 REVOLUTIONARY VISUAL SYSTEM
1. Holonomy Field Visualization
What it shows: Multi-layer quantum field bands representing market resonance zones
How to interpret:
Blue/Purple bands = Primary holonomy field (strongest resonance)
Band width = Field strength and volatility
Price within bands = Normal quantum state
Price breaking bands = Quantum phase transition
Trading application: Trade reversals at band extremes, breakouts on band violations with strong signals.
2. Quantum Portals
What they show: Entry signals with recursive depth patterns indicating momentum strength
How to interpret:
Upward triangles with portals = Long entry signals
Downward triangles with portals = Short entry signals
Portal depth = Signal strength and expected momentum
Color intensity = Probability of success
Trading application: Enter on portal appearance, with size proportional to portal depth.
3. Field Resonance Bands
What they show: Fibonacci-based harmonic price zones where quantum resonance occurs
How to interpret:
Dotted circles = Minor resonance levels
Solid circles = Major resonance levels
Color coding = Resonance strength
Trading application: Use as dynamic support/resistance, expect reactions at resonance zones.
4. Anomaly Detection Grid
What it shows: Fractal-based support/resistance with anomaly strength calculations
How to interpret:
Triple-layer lines = Major fractal levels with high anomaly probability
Labels show: Period (H8-H55), Price, and Anomaly strength (φ)
⚡ symbol = Extreme anomaly detected
● symbol = Strong anomaly
○ symbol = Normal conditions
Trading application: Expect major moves when price approaches high anomaly levels. Use for precise entry/exit timing.
5. Phase Space Flow
What it shows: Background heatmap revealing market topology and energy
How to interpret:
Dark background = Low market energy, range-bound
Purple glow = Building energy, trend developing
Bright intensity = High energy, strong directional move
Trading application: Trade aggressively in bright phases, reduce activity in dark phases.
📊 PROFESSIONAL DASHBOARD METRICS
Holonomy Field Strength (-100 to +100)
What it measures: The Wilson loop integral around price paths
>70: Strong positive curvature (bullish vortex)
<-70: Strong negative curvature (bearish collapse)
Near 0: Flat connection (range-bound)
Anomaly Level (0-100%)
What it measures: Quantum vacuum expectation deviation
>70%: Major anomaly (phase transition imminent)
30-70%: Moderate anomaly (elevated volatility)
<30%: Normal quantum fluctuations
Quantum State (-1, 0, +1)
What it measures: Market wave function collapse
+1: Bullish eigenstate |↑⟩
0: Superposition (uncertain)
-1: Bearish eigenstate |↓⟩
Signal Quality Ratings
LEGENDARY: All quantum fields aligned, maximum probability
EXCEPTIONAL: Strong holonomy with anomaly confirmation
STRONG: Good field strength, moderate anomaly
MODERATE: Decent signals, some uncertainty
WEAK: Minimal edge, high quantum noise
Performance Metrics
Win Rate: Rolling performance with emoji indicators
Daily P&L: Real-time profit tracking
Adaptive Risk: Current risk multiplier status
Market Regime: Bull/Bear classification
🏆 WHY THIS CHANGES EVERYTHING
Traditional technical analysis operates on 100-year-old principles - moving averages, support/resistance, and pattern recognition. These work because many traders use them, creating self-fulfilling prophecies.
AHFT transcends this limitation by analyzing markets through the lens of fundamental physics:
Markets have geometry - The holonomy calculations reveal this hidden structure
Price has memory - The geometric phase captures path-dependent effects
Anomalies are predictable - Quantum field theory identifies symmetry breaking
Everything is connected - Gauge theory unifies disparate market phenomena
This isn't just a new indicator - it's a new way of thinking about markets . Just as Einstein's relativity revolutionized physics beyond Newton's mechanics, AHFT revolutionizes technical analysis beyond traditional methods.
🔧 OPTIMAL SETTINGS FOR MNQ 10-MINUTE
For the Micro E-mini Nasdaq-100 on 10-minute timeframe:
Signal Sensitivity: 2.5-3.5
Score Amplifier: 50-70
Execution Mode: Adaptive
Min Bars Between: 3-5
Theme: Quantum Nebula or Dark Matter
💭 THE JOURNEY - FROM IMPOSSIBLE THEORY TO TRADING REALITY
Creating AHFT was a mathematical odyssey that pushed the boundaries of what's possible in Pine Script. The journey began with a seemingly impossible question: Could the profound mathematical structures of theoretical physics be translated into practical trading tools?
The Theoretical Challenge:
Months were spent diving deep into differential geometry textbooks, studying the works of Chern, Simons, and Witten. The mathematics of holonomy groups and gauge theory had never been applied to financial markets. Translating abstract mathematical concepts like parallel transport and fiber bundles into discrete price calculations required novel approaches and countless failed attempts.
The Computational Nightmare:
Pine Script wasn't designed for quantum field theory calculations. Implementing the Wilson loop integral, managing complex array structures for anomaly detection, and maintaining computational efficiency while calculating geometric phases pushed the language to its limits. There were moments when the entire project seemed impossible - the script would timeout, produce nonsensical results, or simply refuse to compile.
The Breakthrough Moments:
After countless sleepless nights and thousands of lines of code, breakthrough came through elegant simplifications. The realization that market anomalies follow patterns similar to quantum vacuum fluctuations led to the revolutionary anomaly detection system. The discovery that price paths exhibit holonomic memory unlocked the geometric phase calculations.
The Visual Revolution:
Creating visualizations that could represent 4-dimensional quantum fields on a 2D chart required innovative approaches. The multi-layer holonomy field, recursive quantum portals, and phase space flow representations went through dozens of iterations before achieving the perfect balance of beauty and functionality.
The Balancing Act:
Perhaps the greatest challenge was maintaining mathematical rigor while ensuring practical trading utility. Every formula had to be both theoretically sound and computationally efficient. Every visual had to be both aesthetically pleasing and information-rich.
The result is more than a strategy - it's a synthesis of pure mathematics and market reality that reveals the hidden order within apparent chaos.
📚 INTEGRATED DOCUMENTATION
Once applied to your chart, AHFT includes comprehensive tooltips on every input parameter. The source code contains detailed explanations of the mathematical theory, practical applications, and optimization guidelines. This published description provides the overview - the indicator itself is a complete educational resource.
⚠️ RISK DISCLAIMER
While AHFT employs advanced mathematical models derived from theoretical physics, markets remain inherently unpredictable. No mathematical model, regardless of sophistication, can guarantee future results. This strategy uses realistic commission ($0.62 per contract) and slippage (1 tick) in all calculations. Past performance does not guarantee future results. Always use appropriate risk management and never risk more than you can afford to lose.
🌟 CONCLUSION
The Anomalous Holonomy Field Theory represents a quantum leap in technical analysis - literally. By applying the profound insights of differential geometry, quantum field theory, and gauge theory to market analysis, AHFT reveals structure and opportunities invisible to traditional methods.
From the holonomy calculations that capture market memory to the anomaly detection that identifies phase transitions, from the adaptive intelligence that learns and evolves to the stunning visualizations that make the invisible visible, every component works in mathematical harmony.
This is more than a trading strategy. It's a new lens through which to view market reality.
Trade with the precision of physics. Trade with the power of mathematics. Trade with AHFT.
I hope this serves as a good replacement for Quantum Edge Pro - Adaptive AI until I'm able to fix it.
— Dskyz, Trade with insight. Trade with anticipation.

Williams R Zone Scalper v1.0[BullByte]Originality & Usefulness
Unlike standard Williams R cross-over scripts, this strategy layers five dynamic filters—moving-average trend, Supertrend, Choppiness Index, Bollinger Band Width, and volume validation —and presents a real-time dashboard with equity, PnL, filter status, and key indicator values. No other public Pine script combines these elements with toggleable filters and a custom dashboard. In backtests (BTC/USD (Binance), 5 min, 24 Mar 2025 → 28 Apr 2025), adding these filters turned a –2.09 % standalone Williams R into a +5.05 % net winner while cutting maximum drawdown in half.
---
What This Script Does
- Monitors Williams R (length 14) for overbought/oversold reversals.
- Applies up to five dynamic filters to confirm trend strength and volatility direction:
- Moving average (SMA/EMA/WMA/HMA)
- Supertrend line
- Choppiness Index (CI)
- Bollinger Band Width (BBW)
- Volume vs. its 50-period MA
- Plots blue arrows for Long entries (R crosses above –80 + all filters green) and red arrows for Short entries (R crosses below –20 + all filters green).
- Optionally sets dynamic ATR-based stop-loss (1.5×ATR) and take-profit (2×ATR).
- Shows a dashboard box with current position, equity, PnL, filter status, and real-time Williams R / MA/volume values.
---
Backtest Summary (BTC/USD(Binance), 5 min, 24 Mar 2025 → 28 Apr 2025)
• Total P&L : +50.70 USD (+5.05 %)
• Max Drawdown : 31.93 USD (3.11 %)
• Total Trades : 198
• Win Rate : 55.05 % (109/89)
• Profit Factor : 1.288
• Commission : 0.01 % per trade
• Slippage : 0 ticks
Even in choppy March–April, this multi-filter approach nets +5 % with a robust risk profile, compared to –2.09 % and higher drawdown for Williams R alone.
---
Williams R Alone vs. Multi-Filter Version
• Total P&L :
– Williams R alone → –20.83 USD (–2.09 %)
– Multi-Filter → +50.70 USD (+5.05 %)
• Max Drawdown :
– Williams R alone → 62.13 USD (6.00 %)
– Multi-Filter → 31.93 USD (3.11 %)
• Total Trades : 543 vs. 198
• Win Rate : 60.22 % vs. 55.05 %
• Profit Factor : 0.943 vs. 1.288
---
Inputs & What They Control
- wrLen (14): Williams R look-back
- maType (EMA): Trend filter type (SMA, EMA, WMA, HMA)
- maLen (20): Moving-average period
- useChop (true): Toggle Choppiness Index filter
- ciLen (12): CI look-back length
- chopThr (38.2): CI threshold (below = trending)
- useVol (true): Toggle volume-above-average filter
- volMaLen (50): Volume MA period
- useBBW (false): Toggle Bollinger Band Width filter
- bbwMaLen (50): BBW MA period
- useST (false): Toggle Supertrend filter
- stAtrLen (10): Supertrend ATR length
- stFactor (3.0): Supertrend multiplier
- useSL (false): Toggle ATR-based SL/TP
- atrLen (14): ATR period for SL/TP
- slMult (1.5): SL = slMult × ATR
- tpMult (2.0): TP = tpMult × ATR
---
How to Read the Chart
- Blue arrow (Long): Williams R crosses above –80 + all enabled filters green
- Red arrow (Short) : Williams R crosses below –20 + all filters green
- Dashboard box:
- Top : position and equity
- Next : cumulative PnL in USD & %
- Middle : green/white dots for each filter (green=passing, white=disabled)
- Bottom : Williams R, MA, and volume current values
---
Usage Tips
- Add the script : Indicators → My Scripts → Williams R Zone Scalper v1.0 → Add to BTC/USD chart on 5 min.
- Defaults : Optimized for BTC/USD.
- Forex majors : Raise `chopThr` to ~42.
- Stocks/high-beta : Enable `useBBW`.
- Enable SL/TP : Toggle `useSL`; stop-loss = 1.5×ATR, take-profit = 2×ATR apply automatically.
---
Common Questions
- * Why not trade every Williams R reversal?*
Raw Williams R whipsaws in sideways markets. Choppiness and volume filters reduce false entries.
- *Can I use on 1 min or 15 min?*
Yes—adjust ATR length or thresholds accordingly. Defaults target 5 min scalping.
- *What if all filters are on?*
Fewer arrows, higher-quality signals. Expect ~10 % boost in average win size.
---
Disclaimer & License
Trading carries risk of loss. Use this script “as is” under the Mozilla Public License 2.0 (mozilla.org). Always backtest, paper-trade, and adjust risk settings to your own profile.
---
Credits & References
- Pine Script v6, using TradingView’s built-in `ta.supertrend()`.
- TradingView House Rules: www.tradingview.com
Goodluck!
BullByte

Scalping with Williams %R, MACD, and SMA (1m)Overview:
This trading strategy is designed for scalping in the 1-minute timeframe. It uses a combination of the Williams %R, MACD, and SMA indicators to generate buy and sell signals. It also includes alert functionalities to notify users when trades are executed or closed.
Indicators Used:
Williams %R : A momentum indicator that measures overbought and oversold conditions. The Williams %R values range from -100 to 0.
Length: 140 bars (i.e., 140-period).
MACD (Moving Average Convergence Divergence) : A trend-following momentum indicator that shows the relationship between two moving averages of a security's price.
Fast Length: 24 bars
Slow Length: 52 bars
MACD Length: 9 bars (signal line)
SMA (Simple Moving Average) : A trend-following indicator that smooths out price data to create a trend-following indicator.
Length: 7 bars
Conditions and Logic:
Timeframe Check :
The strategy is designed specifically for the 1-minute timeframe. If the current chart is not on the 1-minute timeframe, a warning label is displayed on the chart instructing the user to switch to the 1-minute timeframe.
Williams %R Conditions :
Buy Condition: The strategy looks for a crossover of Williams %R from below -94 to above -94. This indicates a potential buying opportunity when the market is moving out of an oversold condition.
Sell Condition: The strategy looks for a crossunder of Williams %R from above -6 to below -6. This indicates a potential selling opportunity when the market is moving out of an overbought condition.
Deactivate Buy: If Williams %R crosses above -40, the buy signal is deactivated, suggesting that the buying condition is no longer valid.
Deactivate Sell: If Williams %R crosses below -60, the sell signal is deactivated, suggesting that the selling condition is no longer valid.
MACD Conditions :
MACD Histogram: Used to identify the momentum and the direction of the trend.
Long Entry: The strategy initiates a buy order if the MACD histogram shows a positive bar after a negative bar while a buy condition is active and Williams %R is above -94.
Long Exit: The strategy exits the buy position if the MACD histogram turns negative and is below the previous histogram bar.
Short Entry: The strategy initiates a sell order if the MACD histogram shows a negative bar after a positive bar while a sell condition is active and Williams %R is below -6.
Short Exit: The strategy exits the sell position if the MACD histogram turns positive and is above the previous histogram bar.
Trend Confirmation (Using SMA) :
Bullish Trend: The strategy considers a bullish trend if the current price is above the 7-bar SMA. A buy signal is only considered if this condition is met.
Bearish Trend: The strategy considers a bearish trend if the current price is below the 7-bar SMA. A sell signal is only considered if this condition is met.
Alerts:
Long Entry Alert: An alert is triggered when a buy order is executed.
Long Exit Alert: An alert is triggered when the buy order is closed.
Short Entry Alert: An alert is triggered when a sell order is executed.
Short Exit Alert: An alert is triggered when the sell order is closed.
Summary:
Buy Signal: Activated when Williams %R crosses above -94 and the price is above the 7-bar SMA. A buy order is placed if the MACD histogram shows a positive bar after a negative bar. The buy order is closed when the MACD histogram turns negative and is below the previous histogram bar.
Sell Signal: Activated when Williams %R crosses below -6 and the price is below the 7-bar SMA. A sell order is placed if the MACD histogram shows a negative bar after a positive bar. The sell order is closed when the MACD histogram turns positive and is above the previous histogram bar.
This strategy combines momentum (Williams %R), trend-following (MACD), and trend confirmation (SMA) to identify trading opportunities in the 1-minute timeframe. It is designed for short-term trading or scalping.

EUR/USD 45 MIN Strategy - FinexBOTThis strategy uses three indicators:
RSI (Relative Strength Index) - It indicates if a stock is potentially overbought or oversold.
CCI (Commodity Channel Index) - It measures the current price level relative to an average price level over a certain period of time.
Williams %R - It is a momentum indicator that shows whether a stock is at the high or low end of its trading range.
Long (Buy) Trades Open:
When all three indicators suggest that the stock is oversold (RSI is below 25, CCI is below -130, and Williams %R is below -85), the strategy will open a buy position, assuming there is no current open trade.
Short (Sell) Trades Open:
When all three indicators suggest the stock is overbought (RSI is above 75, CCI is above 130, and Williams %R is above -15), the strategy will open a sell position, assuming there is no current open trade.
SL (Stop Loss) and TP (Take Profit):
SL (Stop Loss) is 0.45%.
TP (Take Profit) is 1.2%.
The strategy automatically sets these exit points as a percentage of the entry price for both long and short positions to manage risks and secure profits. You can easily adopt these inputs according to your strategy. However, default settings are recommended.

Ultimate Balance StrategyThe Ultimate Balance Oscillator Strategy harnesses the power of the Ultimate Balance Oscillator to deliver a comprehensive and disciplined approach to trading. By combining the insights of the Rate of Change (ROC), Relative Strength Index (RSI), Commodity Channel Index (CCI), Williams Percent Range, and Average Directional Index (ADX) from TradingView, this strategy offers traders a systematic way to navigate the markets with precision.
The core principle of this strategy lies in its ability to identify optimal entry and exit points based on the movement of the Ultimate Balance Oscillator. When the oscillator line crosses below the 0.75 level, a buy signal is generated, indicating a potential opportunity for a bullish trend reversal. Conversely, when the oscillator line crosses above the 0.25 level, it triggers an exit signal, suggesting a possible end to a bullish trend.
Key Features:
1. Objective Market Analysis: The Ultimate Balance Oscillator Strategy provides a disciplined and objective approach to market analysis. By relying on the quantified insights of multiple indicators, it helps traders cut through market noise and focus on key signals, improving decision-making and reducing emotional biases.
2. Enhanced Timing and Precision: This strategy's entry and exit signals are based on the specific thresholds of the Ultimate Balance Oscillator. By waiting for confirmation through the crossing of these levels, traders can potentially enter trades at opportune moments and exit with greater precision, maximizing profit potential and minimizing risk exposure.
3. Customizability and Adaptability: The strategy offers flexibility, allowing traders to customize the parameters to fit their preferred trading style and timeframes. Whether you're a short-term trader or a long-term investor, the Ultimate Balance Oscillator Strategy can be adjusted to suit your specific needs, making it adaptable to various market conditions.
4. Real-time Alerts: Stay informed and never miss a potential trade opportunity with the strategy's built-in alert system. Set personalized alerts for buy and exit signals to receive timely notifications, ensuring you're always aware of the latest developments in the market.
5. Backtesting and Optimization: Before applying the strategy to live trading, it's recommended to conduct thorough backtesting and optimization. By testing the strategy's performance over historical data and fine-tuning the parameters, you can gain insights into its strengths and weaknesses, enabling you to make informed adjustments and increase its effectiveness.
Trading involves risk. Use the Ultimate Balance Oscillator Strategy at your own discretion. Past performance is not indicative of future results.

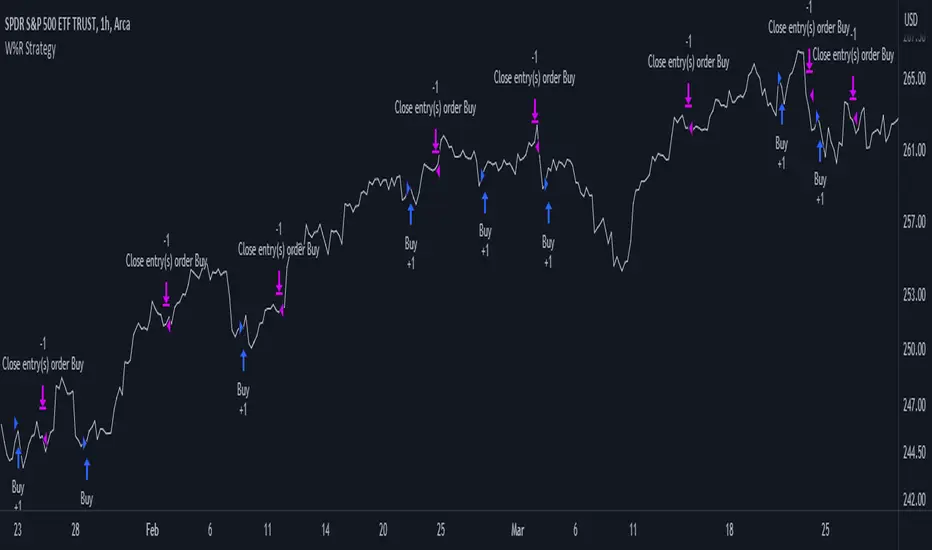
Williams %R Strategy
The Williams %R Strategy is a trading approach that is based on the Williams Percent Range indicator, available on the TradingView platform.
This strategy aims to identify potential overbought and oversold conditions in the market, providing clear buy and sell signals for entry and exit.
The strategy utilizes the Williams %R indicator, which measures the momentum of the market by comparing the current close price with the highest high and lowest low over a specified period. When the Williams %R crosses above the oversold level, a buy signal is generated, indicating a potential upward price movement. Conversely, when the indicator crosses below the overbought level, a sell signal is generated, suggesting a possible downward price movement.
Position management is straightforward with this strategy. Upon receiving a buy signal, a long position is initiated, and the position is closed when a sell signal is generated. This strategy allows traders to capture potential price reversals and take advantage of short-term market movements.
To manage risk, it is recommended to adjust the position size based on the available capital. In this strategy, the position size is set to 10% of the initial capital, ensuring proper risk allocation and capital preservation.
It is important to note that the Williams %R Strategy should be used in conjunction with other technical analysis tools and risk management techniques. Backtesting and paper trading can help evaluate the strategy's performance and fine-tune the parameters before deploying it with real funds.
Remember, trading involves risks, and past performance is not indicative of future results. It is always advised to do thorough research, seek professional advice, and carefully consider your financial goals and risk tolerance before making any investment decisions.
MACD Willy StrategyThis strategy is mainly developed for scalping / intraday trading. It could potentially be used to identify entry/exit signals for short term options trading. It performs decently well on popular stocks when used on time frames between 5 min to 15 min using regular session bar data. It combines 3 popular indicators, EMA, MACD, and William %range, to generate both long and short signals.
EMA:
Default is 200 EMA line.
MACD:
Default is 12/26 lengths for fast/slow signal inputs.
William %R - Smoothed (Published):
This is a custom indicator that generates two moving average lines from the original William %R line.
How it works:
Entry conditions:
1. Long/short entries when bar closes above/below EMA line
2. Long/short entries when MACD line is above/below signal line (histogram > 0 for long, < 0 for short)
3. Long/short entries when William %R fast MA line is above/below slow MA line
Exit conditions:
1. Exit long when MACD line is below signal line, vise versa for exit short
2. Exit long when William %R fast MA line is below slow MA line, vise versa for exit short
3. Exit long when William %R fast MA line must in below the overbought (-20) limit, exit short when above the oversold (-80) limit.
***Note that parameters are NOT optimized for any particular stocks / instruments.
Enjoy~~!!

Combo Backtest 123 Reversal & Smoothed Williams ADThis is combo strategies for get a cumulative signal.
First strategy
This System was created from the Book "How I Tripled My Money In The
Futures Market" by Ulf Jensen, Page 183. This is reverse type of strategies.
The strategy buys at market, if close price is higher than the previous close
during 2 days and the meaning of 9-days Stochastic Slow Oscillator is lower than 50.
The strategy sells at market, if close price is lower than the previous close price
during 2 days and the meaning of 9-days Stochastic Fast Oscillator is higher than 50.
Second strategy
Accumulation is a term used to describe a market controlled by buyers;
whereas distribution is defined by a market controlled by sellers.
Williams recommends trading this indicator based on divergences:
Distribution of the security is indicated when the security is making
a new high and the A/D indicator is failing to make a new high. Sell.
Accumulation of the security is indicated when the security is making
a new low and the A/D indicator is failing to make a new low. Buy.
WARNING:
- For purpose educate only
- This script to change bars colors.

[DS]Entry_Exit_TRADE.V01-StrategyThe proposal of this script is to show the possible trading points of BUY and SELL based on the 15-minute chart of the Nasdaq Future Index. The start point of the strategy was schedule for 2021/01/01 and until the time of this publication (2021/01/31), for 1 index contract the results presented area a Gross Profit of 2.97% with a Net Profit of 1.35%.
█ FEATURES
The indicator shows on the graph the position of the MACD and TSI indicators that are the places of strength among Buyers and Sellers.
It's possible to observe a sharp fall or rise in the price of these positions.
On the current candle, a label is displayed containing the value of the William %R Mod indicator, which will display the OverBought position (dark red) and OverSold position (dark green). The other colors like light red and green are the regions where the price makes the decision of which direction to go.
There are also other indicators:
a) The positions of the BUY (light green) and SELL areas (light red);
b) The label with the position of BUY (dark green) and SELL (dark red) with the line that connects these points;
c) DEMA 72 (orange);
d) EmaOchl4 in the color green for BULL and red for BEAR market;
e) Pivots high and low
f) Maximum (purple light) and minimum areas (blue light)
█ FUNCTIONS AND SETTINGS
The indicator uses the following functions:
(1) DEMA - Double Exponential Moving Average (08,17,34, 72)
(2) ema () - Exponential Moving Averge (72, ohlc4)
(3) plot()
(4) barcolor()
(5) cross()
(6) pivots ()
(7) William R% Md (OverBought = -7, OverSold=-93)
(8) Maximum and Minimum Value
(9) fill()
(10) macd () - Moving Average Convergence Divergence (Fast Lengt=12, Slow Length=26, Source=close, Signal Smoothing=9)
(11) tsi() - Trading Strenght Indicator==> Índice de Força Real ( IFR ) (Long Length=72, Short Length=17, Signal Length=17)
(12) Buy and Sell TRADE Points
█ PERFORMANCE AND ERRORS
The positions of BUY and SELL points are defined through the crossing of the Dema 34 candles with the Ema Ohcl4. As it is an indicator, it can present different positions from de market direction. Thus there is a need to observe the direction of the market in order to verify whether the indicate decision is really acceptable. The decision to BUY or SELL an asset must be well studied to avoid financial losses. The indicator will only help you in this decision, is your responsibility the decision of entering or leaving an asset.
█ THANKS TO
PineCoders for all they do, all the tools and help they provide, and their involvement in making a better community. All the PineCoders, Pine Pros, and Pine Wizards, people who share their work and knowledge for the sake of it and helping others, I'm very happy and grate full indeed.
█ NOTE
If you have any suggestions for improving the script or need help using it, please send a message in the comments

Combo Backtest 123 Reversal & DSS Bressert This is combo strategies for get a cumulative signal.
First strategy
This System was created from the Book "How I Tripled My Money In The
Futures Market" by Ulf Jensen, Page 183. This is reverse type of strategies.
The strategy buys at market, if close price is higher than the previous close
during 2 days and the meaning of 9-days Stochastic Slow Oscillator is lower than 50.
The strategy sells at market, if close price is lower than the previous close price
during 2 days and the meaning of 9-days Stochastic Fast Oscillator is higher than 50.
Second strategy
Double Smoothed Stochastics (DSS) is designed by William Blaw.
It attempts to combine moving average methods with oscillator principles.
WARNING:
- For purpose educate only
- This script to change bars colors.

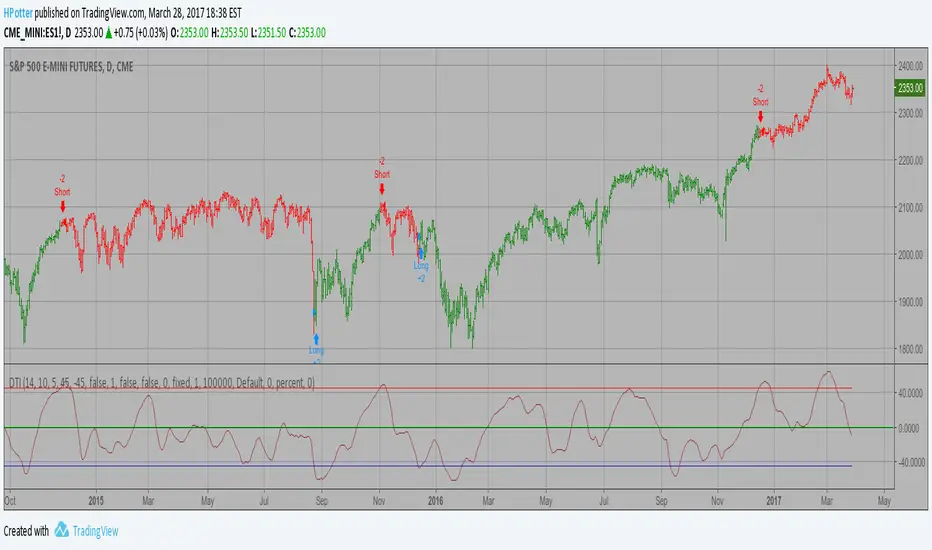
Combo Backtest 123 Reversal & Directional Trend Index (DTI) This is combo strategies for get a cumulative signal.
First strategy
This System was created from the Book "How I Tripled My Money In The
Futures Market" by Ulf Jensen, Page 183. This is reverse type of strategies.
The strategy buys at market, if close price is higher than the previous close
during 2 days and the meaning of 9-days Stochastic Slow Oscillator is lower than 50.
The strategy sells at market, if close price is lower than the previous close price
during 2 days and the meaning of 9-days Stochastic Fast Oscillator is higher than 50.
Second strategy
This technique was described by William Blau in his book "Momentum,
Direction and Divergence" (1995). His book focuses on three key aspects
of trading: momentum, direction and divergence. Blau, who was an electrical
engineer before becoming a trader, thoroughly examines the relationship between
price and momentum in step-by-step examples. From this grounding, he then looks
at the deficiencies in other oscillators and introduces some innovative techniques,
including a fresh twist on Stochastics. On directional issues, he analyzes the
intricacies of ADX and offers a unique approach to help define trending and
non-trending periods.
Directional Trend Index is an indicator similar to DM+ developed by Welles Wilder.
The DM+ (a part of Directional Movement System which includes both DM+ and
DM- indicators) indicator helps determine if a security is "trending." William
Blau added to it a zeroline, relative to which the indicator is deemed positive or
negative. A stable uptrend is a period when the DTI value is positive and rising, a
downtrend when it is negative and falling.
WARNING:
- For purpose educate only
- This script to change bars colors.

Ergodic CSI Backtest This is one of the techniques described by William Blau in his book
"Momentum, Direction and Divergence" (1995). If you like to learn more,
we advise you to read this book. His book focuses on three key aspects
of trading: momentum, direction and divergence. Blau, who was an electrical
engineer before becoming a trader, thoroughly examines the relationship between
price and momentum in step-by-step examples. From this grounding, he then looks
at the deficiencies in other oscillators and introduces some innovative techniques,
including a fresh twist on Stochastics. On directional issues, he analyzes the
intricacies of ADX and offers a unique approach to help define trending and
non-trending periods.
This indicator plots Ergotic CSI and smoothed Ergotic CSI to filter out noise.
You can change long to short in the Input Settings
WARNING:
- For purpose educate only
- This script to change bars colors.

Smoothened Williams Accumulation/Distribution (Williams AD) Accumulation is a term used to describe a market controlled by buyers;
whereas distribution is defined by a market controlled by sellers.
Williams recommends trading this indicator based on divergences:
Distribution of the security is indicated when the security is making
a new high and the A/D indicator is failing to make a new high. Sell.
Accumulation of the security is indicated when the security is making
a new low and the A/D indicator is failing to make a new low. Buy.
You can change long to short in the Input Settings
WARNING:
- For purpose educate only
- This script to change bars colors.

Williams Accumulation/Distribution (Williams AD) Backtest Accumulation is a term used to describe a market controlled by buyers;
whereas distribution is defined by a market controlled by sellers.
Williams recommends trading this indicator based on divergences:
Distribution of the security is indicated when the security is making
a new high and the A/D indicator is failing to make a new high. Sell.
Accumulation of the security is indicated when the security is making
a new low and the A/D indicator is failing to make a new low. Buy.
You can change long to short in the Input Settings
WARNING:
- For purpose educate only
- This script to change bars colors.

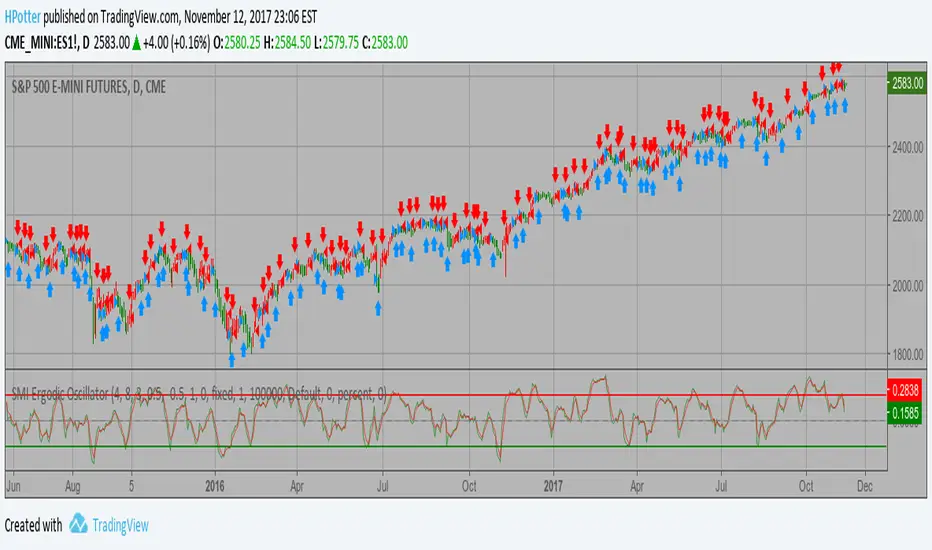
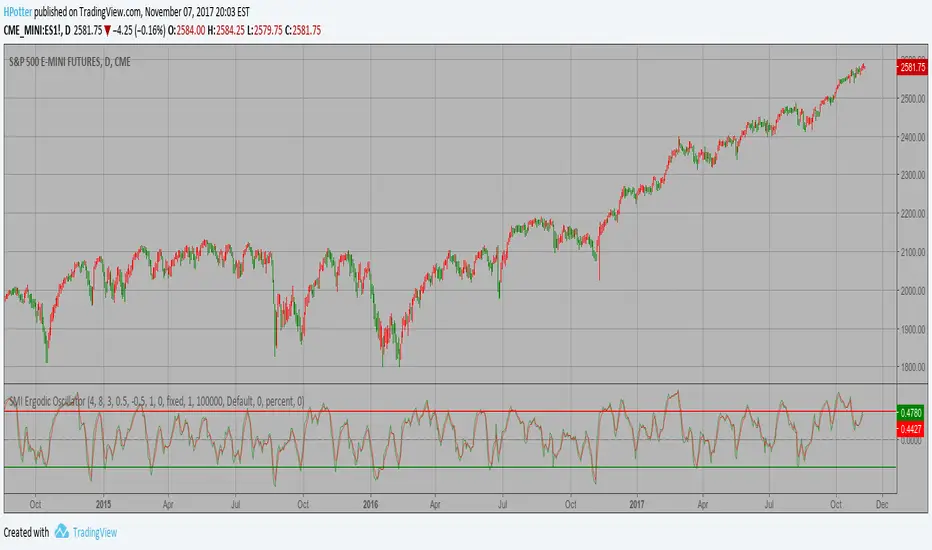
SMI Ergodic Oscillator Backtest ver.2 The SMI Ergodic Indicator is the same as the True Strength Index (TSI) developed by
William Blau, except the SMI includes a signal line. The SMI uses double moving averages
of price minus previous price over 2 time frames. The signal line, which is an EMA of the
SMI, is plotted to help trigger trading signals. Adjustable guides are also given to fine
tune these signals. The user may change the input (close), method (EMA), period lengths
and guide values.
You can use in the xPrice any series: Open, High, Low, Close, HL2, HLC3, OHLC4 and ect...
WARNING:
- For purpose educate only
SMI Ergodic Oscillator Strategy ver.2 The SMI Ergodic Indicator is the same as the True Strength Index (TSI) developed by
William Blau, except the SMI includes a signal line. The SMI uses double moving averages
of price minus previous price over 2 time frames. The signal line, which is an EMA of the
SMI, is plotted to help trigger trading signals. Adjustable guides are also given to fine
tune these signals. The user may change the input (close), method (EMA), period lengths
and guide values.
You can use in the xPrice any series: Open, High, Low, Close, HL2, HLC3, OHLC4 and ect...
WARNING:
- For purpose educate only
Klinger Volume Oscillator (KVO) Backtest The Klinger Oscillator (KO) was developed by Stephen J. Klinger. Learning
from prior research on volume by such well-known technicians as Joseph Granville,
Larry Williams, and Marc Chaikin, Mr. Klinger set out to develop a volume-based
indicator to help in both short- and long-term analysis.
The KO was developed with two seemingly opposite goals in mind: to be sensitive
enough to signal short-term tops and bottoms, yet accurate enough to reflect the
long-term flow of money into and out of a security.
The KO is based on the following tenets:
Price range (i.e. High - Low) is a measure of movement and volume is the force behind
the movement. The sum of High + Low + Close defines a trend. Accumulation occurs when
today's sum is greater than the previous day's. Conversely, distribution occurs when
today's sum is less than the previous day's. When the sums are equal, the existing trend
is maintained.
Volume produces continuous intra-day changes in price reflecting buying and selling pressure.
The KO quantifies the difference between the number of shares being accumulated and distributed
each day as "volume force". A strong, rising volume force should accompany an uptrend and then
gradually contract over time during the latter stages of the uptrend and the early stages of
the following downtrend. This should be followed by a rising volume force reflecting some
accumulation before a bottom develops.
You can change long to short in the Input Settings
Please, use it only for learning or paper trading.

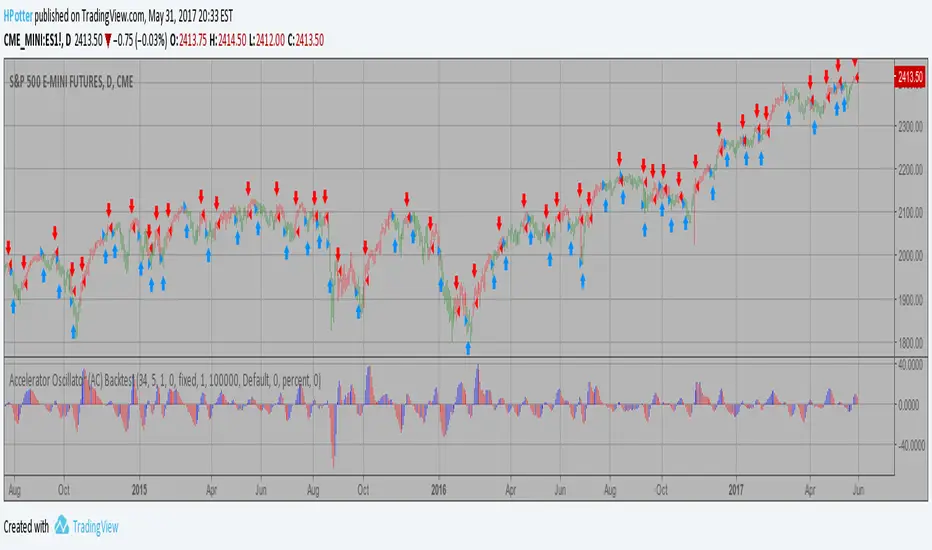
Accelerator Oscillator (AC) Backtest The Accelerator Oscillator has been developed by Bill Williams
as the development of the Awesome Oscillator. It represents the
difference between the Awesome Oscillator and the 5-period moving
average, and as such it shows the speed of change of the Awesome
Oscillator, which can be useful to find trend reversals before the
Awesome Oscillator does.
You can change long to short in the Input Settings
Please, use it only for learning or paper trading. Do not for real trading
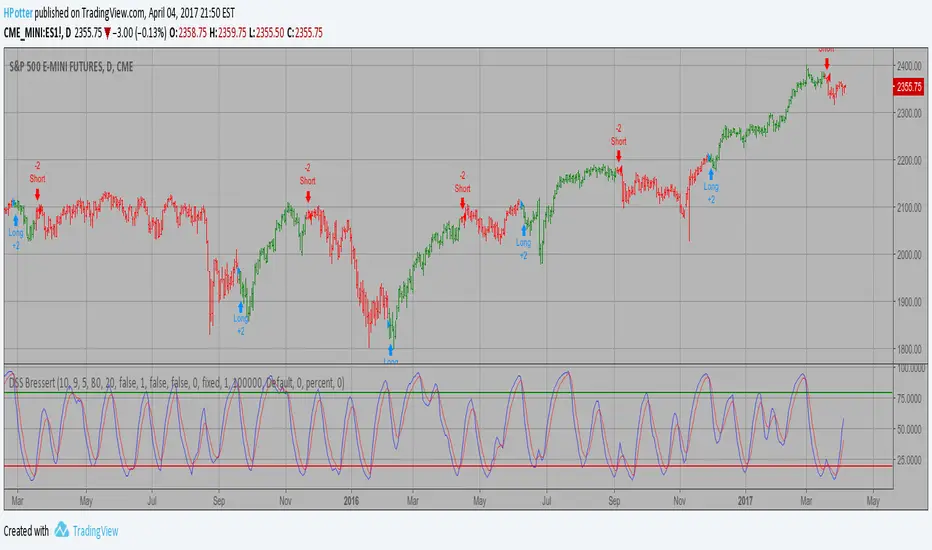
DSS Bressert (Double Smoothed Stochastic) Strategy Backtest Double Smoothed Stochastics (DSS) is designed by William Blaw.
It attempts to combine moving average methods with oscillator principles.
You can change long to short in the Input Settings
Please, use it only for learning or paper trading. Do not for real trading.
Directional Trend Index (DTI) This technique was described by William Blau in his book "Momentum,
Direction and Divergence" (1995). His book focuses on three key aspects
of trading: momentum, direction and divergence. Blau, who was an electrical
engineer before becoming a trader, thoroughly examines the relationship between
price and momentum in step-by-step examples. From this grounding, he then looks
at the deficiencies in other oscillators and introduces some innovative techniques,
including a fresh twist on Stochastics. On directional issues, he analyzes the
intricacies of ADX and offers a unique approach to help define trending and
non-trending periods.
Directional Trend Index is an indicator similar to DM+ developed by Welles Wilder.
The DM+ (a part of Directional Movement System which includes both DM+ and
DM- indicators) indicator helps determine if a security is "trending." William
Blau added to it a zeroline, relative to which the indicator is deemed positive or
negative. A stable uptrend is a period when the DTI value is positive and rising, a
downtrend when it is negative and falling.
You can change long to short in the Input Settings
Please, use it only for learning or paper trading. Do not for real trading