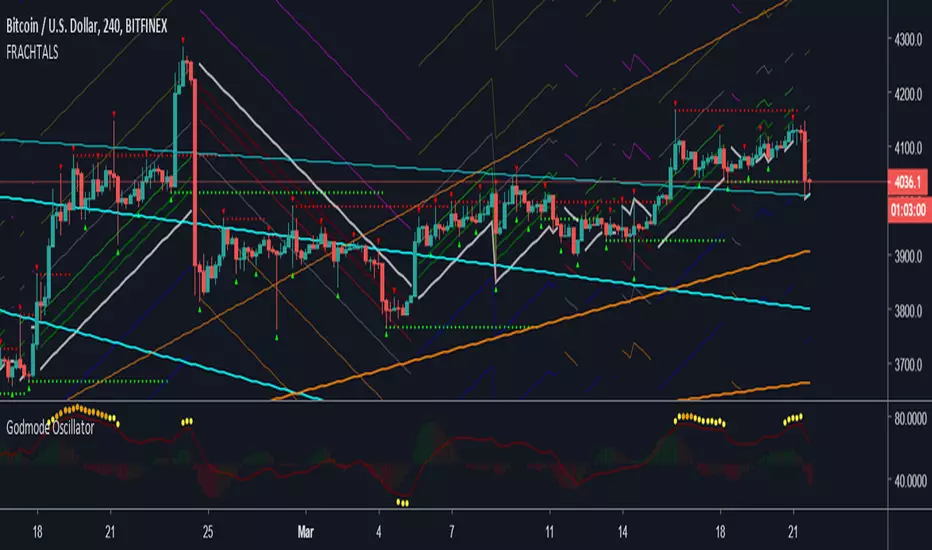
FRACHTALS"FRACHTALS" - A practical example of taking a joke entirely way, way too far
Speaking of which - Moon when?
#REKT
Credits/Acknowledgements/References:
Fractal detection + other functions (@RicardoSantos)
Laguerre RSI w/ self-Adjusting Alpha (@everget)
Fractal de Williams
Swing PointsThis indicator gives a clear indication of price action swing-points as well as an indication of whether it is a higher, lower, or equal swing point relative to the last high/low.

TB!G-Scalp Strategy [Alert]Scalping Crypto Assets Made Easy
TB!G-Scalp is a TradingView based alert and accompanying strategy PineV3 Script.
Backtest vs Realtime
When designing the algorithms for this strategy our focus was primarily on ease of use.This results in a beautiful yet easy to use scalping strategy. As input it takes a chart period and only one extra parameter for fine tuning. The backtest results are an accurate representation of it’s real-time behaviour.
What makes it tick?
Over the last 2 years we collected a lot of market data regarding Bull and Bear behaviours. This previous market behaviour echo’s into the current market trend.
By recognising these echo’s we are able to anticipate an upcoming micro reversal which eventually end up being a scalping strategy.
Interested
Access is provided to a limited amount of people and for the duration that is determined by it’s Alpha Decay Rate.
This ADR is expected to become problematic after 2.3 year of usage on a lot of 150 users.

TB!G-Scalp Strategy [Backtest]Scalping Crypto Assets Made Easy
TB!G-Scalp is a TradingView based alert and accompanying strategy PineV3 Script.
Backtest vs Realtime
When designing the algorithms for this strategy our focus was primarily on ease of use.This results in a beautiful yet easy to use scalping strategy. As input it takes a chart period and only one extra parameter for fine tuning. The backtest results are an accurate representation of it’s real-time behaviour.
What makes it tick?
Over the last 2 years we collected a lot of market data regarding Bull and Bear behaviours. This previous market behaviour echo’s into the current market trend.
By recognising these echo’s we are able to anticipate an upcoming micro reversal which eventually end up being a scalping strategy.
Interested
Access is provided to a limited amount of people and for the duration that is determined by it’s Alpha Decay Rate.
This ADR is expected to become problematic after 2.3 year of usage on a lot of 150 users.

Fractals V9 ModifiedSo taking Ricardo Santos script for fractals V9 -I change the time function of the high TF fractal to non repainting one
adding daily fib levels
This hybrid seems to look nice . I have to admit that all credit to Ricardo Santos for his exelent script.
thi work it hybrid work and not so much original work....
The main improvment is the signals which are not reapinting as we remove security from that.
Security function exist for daily fib but it has nothing to do wih signal generation so i did not touch it

Keltner Channels+Parabolic Sar+Fractals+MACDA mixture of 4 indicators on the same overlay. Keltner Channels, Parabolic Sar, Fractals. MACD is integrated for yellow candles in order to show huge macd and trigger line gaps. MACD integration focuses on hist line by determining negative upper level and positive bottom level.

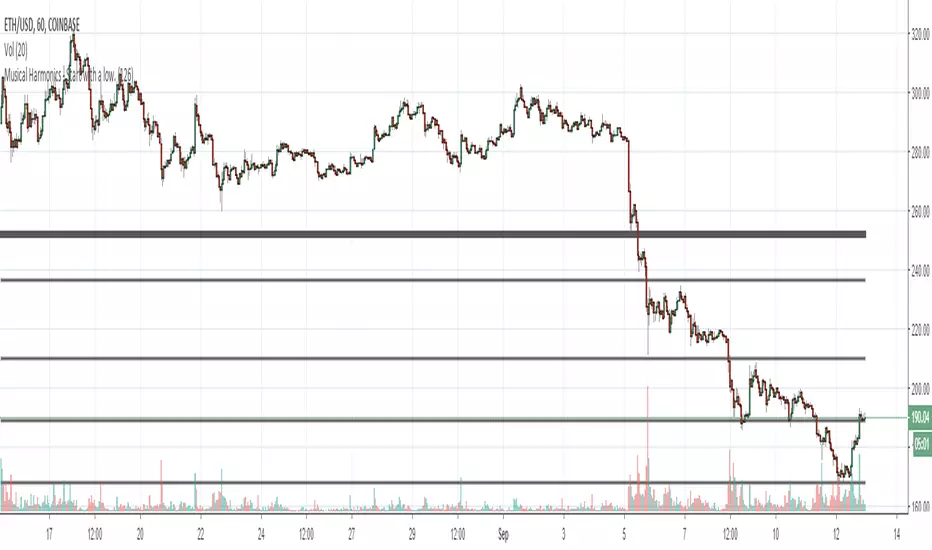
Musical Harmonics - Start with a low.Octaves double from one octave to another, so start with octaves beginning with the number one, for example:
1 doubled is 2, 2 doubled is 4, 4 double is 8 and then we go on to this sequence:
1,2,4,8,16,32,64,126,256,512,1024,2048,etc,etc
Find one of the numbers near a range, so for example on this chart Ethereum was trading at 190.31. That price is in between the octaves of 126 and 256. The number I use as the low for the indicator is 126.
Working on updating with labels and such
Time Pattern IndicatorHigh Priority = Gold Diamonds
Medium Priority = Silver Circles
Leading Priority = Fuchsia Crosses

FILBFILBv3- Components:
1)
EMA 8 moves above 24: Candles Flip Green
EMA 8 moves Below 24: Candles Flip Pink
2)
Bull Div - Blue Candle
Bear Div - Red Candle
(On Mac D)
3)
Williams Fractals
Was designed on the 6 Hour Chart.
- Settings need to be adjusted:
Deslect the normal candles by right clicking the chart description in the top left and select "hide"
Hide the EMAs (i sometimes show the EMA 24) in the FILBFILB settings
Select the wick colour to grey in the FILBFILB settings
The Way i use this to:
- Use Stops based on Fractal points
- Enter Trades Long when flip Green Bear when flip Pink
- Hedge on Red Candles when in bull trend, unhedge when Blue (vica - versa in bear trend)

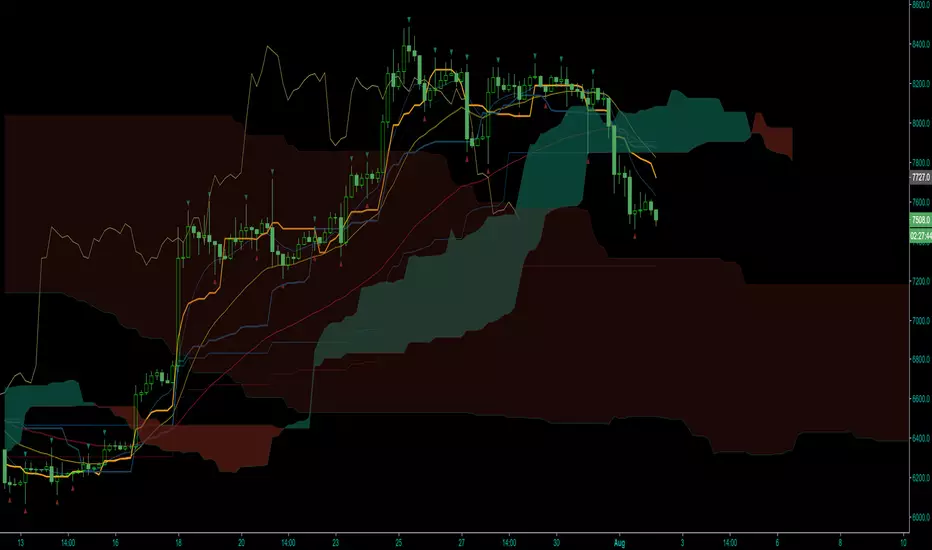
2xIchimoku Cloud + 4xEMA + Williams FractalCopy+Pasted/edited the code from :
Moku
www.tradingview.com
EMA
www.tradingview.com
Fractal
www.tradingview.com

BottomFinder Adv. Charts Suite V2.0With the advanced charts suite you get multiple indicators you can overlay on your charts, while only using one indicator slot. We made this after requests from our members, to assist those who use a free TV account. IT can take a minute or more to load... be patient! Its not advised to use them all at once, use them in combinations and see what works for you! I wanted to include more indicators, but hit some of the limits imposed by pine script. All options are off by default.
Included are:
Ichimoku Cloud
Support Resistance Fractal
Trailing Long/Short Stoploss
Bull Bear Squares
Triple Hull Moving Average
Standard Hull Moving Average
Fibonacci Daily
Advance Decline Lines
This indicator is available to all our members at no extra charge. If you would like access join us in the link from my signature. You can get a trial of our paid indicators and access to the free ones as well.
Please also like this indicator, and follow me on TradingView for access! We have many more great free indicators coming in the future!


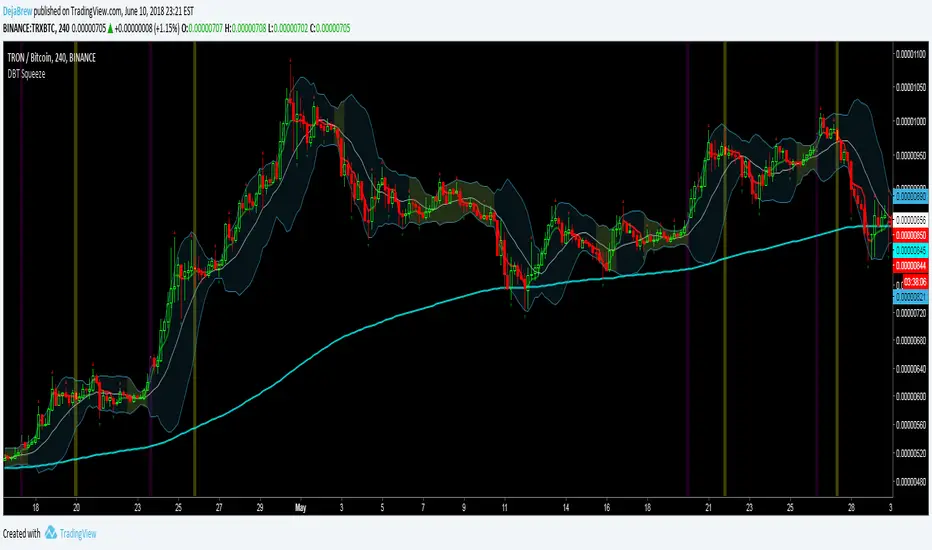
DBT SqueezeThe DejaBrew Trading Squeeze is an indicator designed over years of trading volatility. It uses Bollinger Bands to determine areas of low volatility, signified by the yellow shading of the squeeze. Then it takes into account CCI values to determine a breakout incoming. This indicator also has VWAP, 200 ema, and Williams Fractals built in.
To use this indicator first determine a time frame that does not give a large amount of signals (it was designed to work best on the 5min but has been tested and works great on all time frames above 5min). Once a time frame is determined then look for Bollinger Band squeezes signified by yellow shading. Once the squeeze is determined wait for a purple or blue buy candle to signal (purple are stronger signals). Once a buy candle has signaled evaluate price action, if bullish and supported by other indicators then either take an aggressive entry on the buy candle or wait for a pullback no greater than 50% of the buy candle. Once your position has been established place a stop loss at 1% or below the 200ema and VWAP if possible, no greater than 3% is recommended. Target a 3% gain or wait for the Yellow Sell Candle to close most or all of your position.
Do not take buy candles in extremely bearish markets. Purple Buy Candles are much stronger than blue because they are above the 200ema signifying a bullish trend. Do not take every buy candle if market is choppy and giving a lot of signals. Pair this indicator with a Commodity Channel Index (50) for the best signals. When the CCI is stable and not choppy the buy candles will be much more accurate. Do not take buy candles if the CCI is very choppy.
Use at your own risk. This is not financial advise and this indicator is not guaranteed to make you profits. Please message me if you have any questions or feedback. Enjoy.
DO NOT ASK FOR ACCESS. THIS INDICATOR WILL BE AVAILABLE ON MY WEBSITE ONCE IT RELEASES.
Fractal HelperA spinoff from a previous script I published, this configurable indicator also selects highs and lows and then plots a trend line that bounces between them. In addition, it also iterates this up to two more times in a quasi-fractal manner, on larger time scales, and plots them on the same graph.
Of course this will not spit out Elliott waves, but with adjusting, it could aid in discerning one wave from another.
I may experiment with the security function again to get a better, longer L3 plot, although charts are limited in duration anyway.

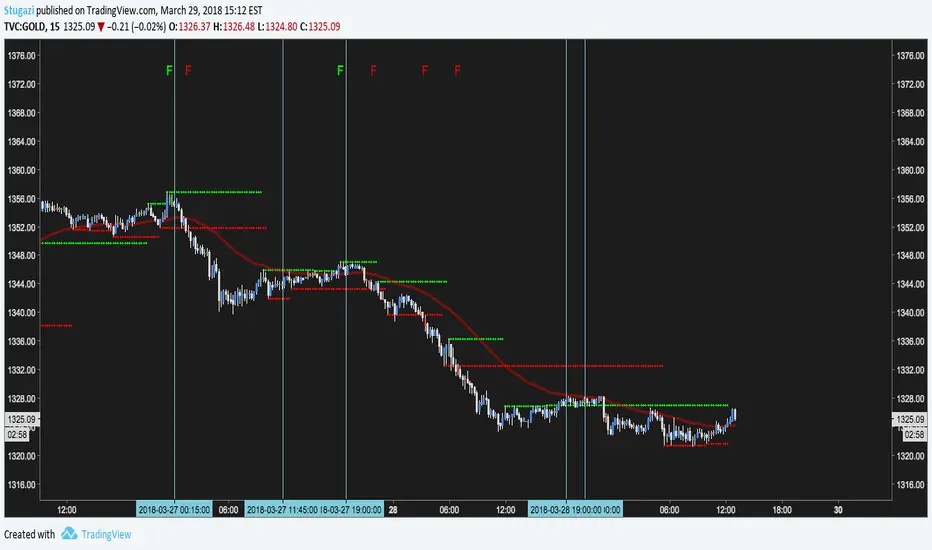
Fractal Support ResistanceTroubleshooting this script.
The vertical lines are when the alerts fired in TradingView. Along the top a green F is LONG signal and red F is SHORT. Signals fire only after CLOSING for two consecutive bars above or below a fractal. Also there is a min delay of 12 bars between signals.
The alerts are configured identical to the F character plots. Not sure why the alerts are randomly firing. =(
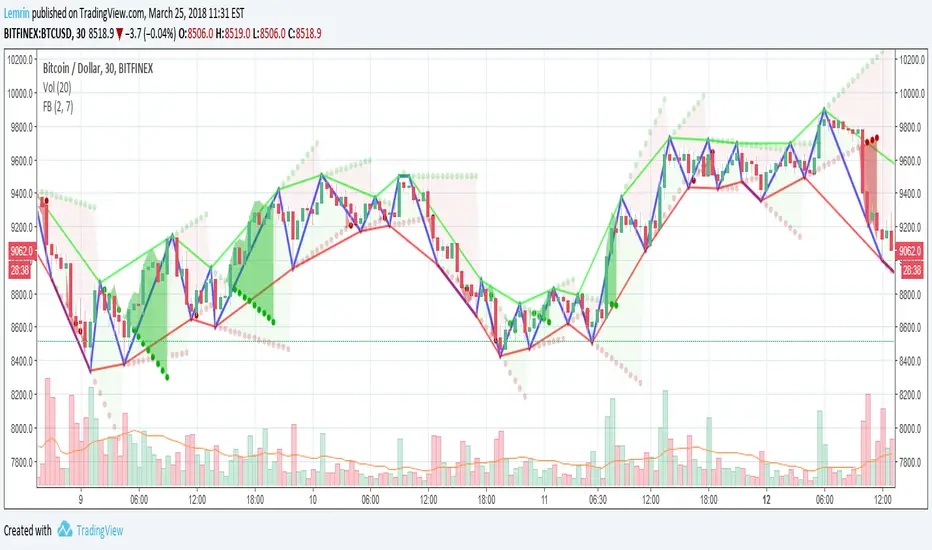
Fractal Breakout V2Version 2 of my fractal pattern aid ( Version 1 ).
I added a bouncing line between the high and low trend lines, connecting consecutive extreme points. I also chased down a pesky bug in the slope calculation...and for now I have disabled the ability to change resolution basis for extreme detection (e.g. 30m on a 1hr chart).
For fun, I added some shading to make it more apparent at a glance what is happening, but if you find it gimmicky, there's an option to turn that off.
I am inexperienced with pattern recognition, so please send feedback if you have any ideas that would make this more useful.
Thanks!
Lemrin
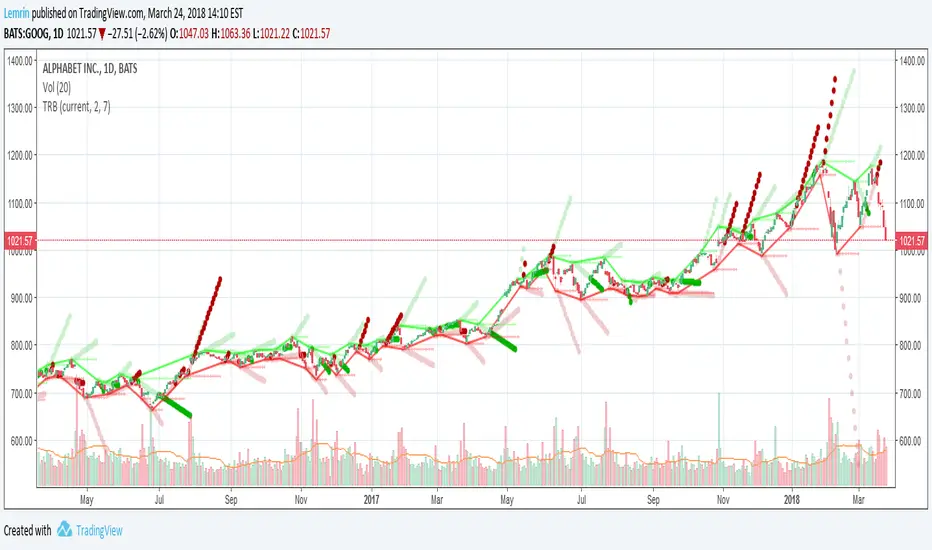
Fractal BreakoutFirst of all, huge credit to synapticEx , whose brilliant use of the security function inspired me to figure out a way to get quasi-shape boundaries automatically drawn on a chart.
This study draws upper and lower trend lines, based on configurable fractal*** reversal detection, calculates slope from the last two upper or lower reversal points, and then extends a dotted line along the same slope...until the next upper (or lower) reversal occurs. If the high (or low) breaks this extension, the dotted line becomes solid to aid visibility. Reversal detection is configurable to use any number of ticks, but probably four to eight will work best.
I made the inclusion of volume in the reversal logic optional (off by default) and left the existing SMA input found in synapticEx's code intact, albeit with a lower default. With the addition of trend lines, I found volume hindered identification of reversals, although I could try various other filters than the SMA included originally.
I have also left intact the very nice ability to change the period and use the requested period identify reversals, courtesy of synapticEx.
This could be used in a strategy, as the values plotted are actual values that are available to include in logic and do not include knowledge of the future. However , information is not available until the floor of half the number of ticks used in reversal detection (I then offset by that number to line things up visually). Having never heard of it until now, I just Googled the Bill Williams Alligator strategy, which looks interesting, so maybe I could see how this could be ported to that.
***As I typed this, I remembered that while making reversal detection configurable, I changed the detection logic simply to look for highest (or lowest) of the desired length of ticks. I don't know whether this is not strictly fractal anymore, but if desired, with a little work, I could make it require consecutive, consistent changes before and after each reversal again.
Here are a few screenshots from hourly ticks, using the "current" (hourly) period, with and without volume, and playing with the number of points used to identify reversals.
Not using volume
Using volume
Brandon: Fractals MKIICustom Indicator development published for customer verification and acceptance.
Features
Generate buy / sell signals if x number of candles following a fractal are up/down.
Generate an early warning (background color change) if x - 1 candles following a fractal are up/down
Generate alerts for buy/sell signals and early warning.


Bill Williams. Alligator, Fractals & Res/Sup combined (by vlkvr)Bill Williams indicators (each separately) are simple and quite self-sufficient, however, are most often used together. The key ones (Alligator and Fractals) are freely available and everyone can use them, but why use them on the chart separately, when "together more fun", and not conceivable, in my opinion, they are one without the other.
So, I present "split/copypasta" of two key indicators of Bill Williams, plus (as a bonus) visualization of "Support/Resistance" levels (and in fact, lines from extremes or the same fractals).
As a result, before you indicator "three-in-one".

Brandon FractalsCustom Indicator developed for a Backtest-Rookies customer. Published for verification and acceptance
Dual Fractal indicator. Display fractals from an upper timeframe and provide alerts when price breaks above/below the upper timeframe fractal.

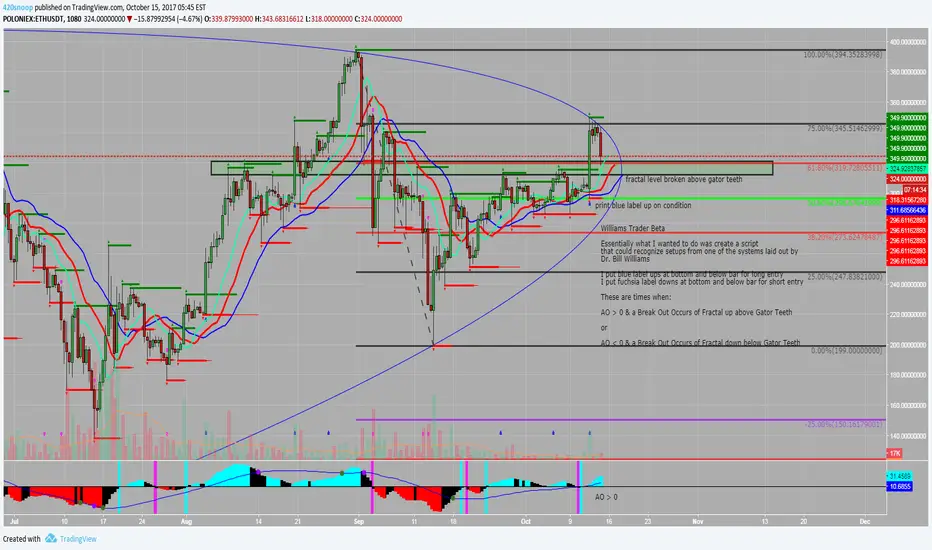
Williams Trader BetaWilliams Trader Beta (not for public use)
Essentially what I wanted to do was create a script that could recognize setups from one of the systems laid out by Dr. Bill Williams
I put blue label ups at bottom and below bar for long entry
I put fuchsia label downs at bottom and below bar for short entry
These are times when:
AO > 0 & a Break Out Occurs of Fractal up above Gator Teeth
or
AO < 0 & a Break Out Occurs of Fractal down below Gator Teeth
These also have alert conditions... be sure to use once per bar on close if using this condition!